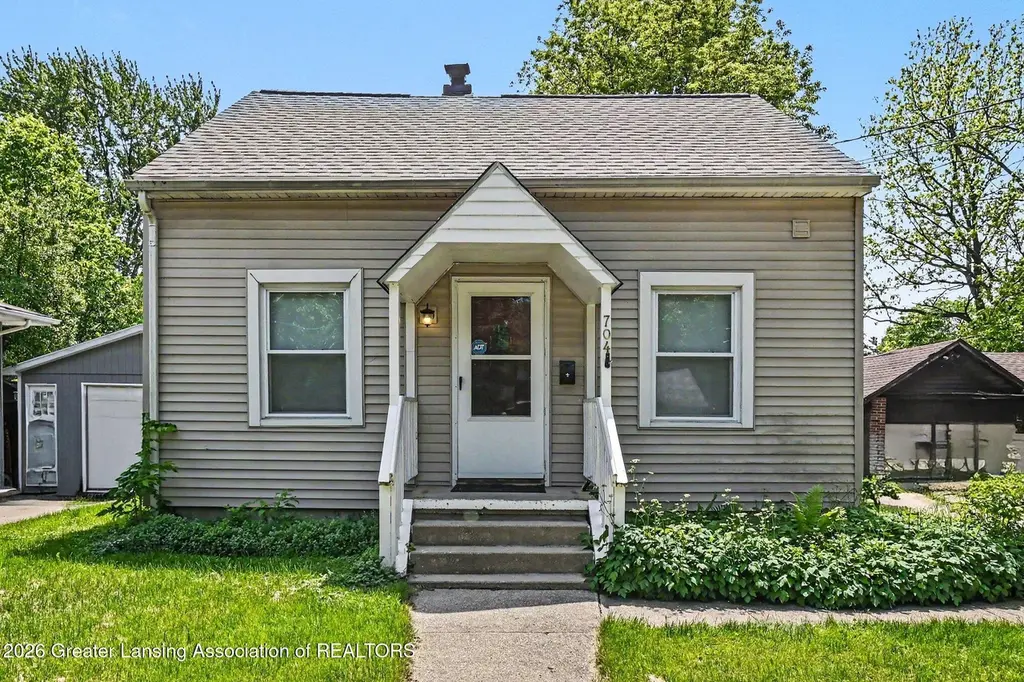
704 Kenwood Ave · Lansing, MI
Flood risk 5/10 · Moderate
- FEMA flood zone
- X (unshaded)
- Chance of flooding over 30 yrs
- 0.24%
- Est. flood insurance / yr
- $507 – $1,088
Fire risk 1/10 · Minimal
- Est. fire insurance / yr
- $784 – $1,456
Heat risk 2/10 · Minimal
- Hot days now (above 96°F)
- 7 days/yr
- Hot days in 30 yrs
- 16 days/yr
Wind risk 2/10 · Minimal
- Chance of severe wind over 30 yrs
- —
Air-quality risk 2/10 · Minimal
- Unhealthy air days now
- 1 days/yr
- Unhealthy air days in 30 yrs
- 2 days/yr
Risk factors via First Street. Map © Google.
Why this score? — see what drove the C grade
The composite is a weighted blend of 9 inputs, each scored 0–100. Each bar is that input's sub-score; the figure is the points it added to the 100-point composite (weight × sub-score).
- Cash flow +20.0/30.0
- ARV discount +11.1/15.0
- DSCR +6.3/10.0
- 1% rule +6.1/10.0
- Livability +4.0/5.0
- Rent growth +3.7/5.0
- Condition / age +2.5/5.0
- Schools +1.9/10.0
- Appreciation +0.0/10.0
$111,900
🖨 Deal sheet (PDF) 📄 Offer letter ✓ Due diligence
Listing remarks MLS
Meticulous comes to mind when you walk through this 2-3 bed 1 bath. Located on a Secluded short dead end road in a GREAT neighborhood. Sit back and enjoy the newly built 12x10 deck. This Move In Ready home is just waiting for you to make it your Home. Appliances included. Many updates were completed in 97. Current improvement are flooring paint and plumbing. Motivated seller!! Call today!!
Key facts
- 5,227 sq ft lot
- Garage
- Built 1928
Neighborhood map
What this means for you Summary
Snapshot
- This is a 3-bed/1.0-bath single-family listed at $112k.
Deal economics
- At list price, monthly cash flow is $137 ($2k/yr) — positive.
- The deal already cash-flows at list — no discount required.
- Meets the 1% rule at list price ($1k rent vs $112k).
- Recommended offer: $110k (1.5% below list) — sets the bar for market timing.
- Cap rate 7.8% vs local median 6.0% in Lansing — meaningfully above typical; check what's discounted (condition, days-on-market, listing class) to confirm the premium yield is real.
Location & tenants
- Location reads 79/100 on livability (#94 in MI, #2,182 nationally) — a middle-class / working-renter tenant base. Strengths: amenities A+, commute A+, cost of living A+; Watch: employment D, schools F, crime F.
- Lansing Public School District (urban): math 14% / reading 23% proficiency, ranked #650 of 760 in MI (top 86%) — low school quality limits family demand, transient renter base, plan for 1-2y turnover; 68% free/reduced lunch — lower-income household profile, screen leases tightly.
- Market conditions: Rents rising fast (+4.7%/yr); 177 active listings in the ZIP; 19 comparable units currently listed for rent nearby; rentals lingering (median 44d on market — plan ~5-8 weeks vacancy on turnover, expect pricing pressure); 58% of comp listings sitting > 30 days — soft ceiling on asking rent; 350 units permitted in Ingham County in 2024 (186 in 5+ unit buildings).
Forward outlook
- Local home prices are declining (-3.0%/yr); year-one equity from $774 of loan paydown is wiped out by about $3k of value loss. Plan a longer hold.
- Ingham County population projected at +11% by 2050 — modest demand growth; plan on rents tracking national, not racing it.
Negotiation context
- It's been on market 17 days — a 2% lower offer ($110k) is reasonable based on typical stale-listing flexibility.
- 2 sale attempts since 4y ago; this cycle's ask is 19% above the opening price — seller raised mid-cycle; expect resistance to lowballs.
- Current owner paid $87k; 29% above their basis — modest negotiation headroom, anchor on the comps not their cost.
Risks & watch-outs
- Watch-outs: built in 1928 — expect roof / HVAC / electrical / plumbing capex.
- Climate carrying-cost: moderate flood risk — expect insurance premiums to compound above CPI over the hold.
Questions for the listing agent
- Built in 1928 — when were the roof, HVAC, electrical panel, plumbing, and water heater last replaced?
- Is there a deadline driving the sale (1031 exchange, divorce, estate, relocation)? That informs how much negotiation room exists.
- Schools are F-rated, which usually means shorter tenancies and higher turnover. Who's the typical renter profile here, and what's been the actual vacancy rate?
- Crime grade is F in this area — have there been break-ins, vandalism, or insurance claims at this property in the last 3 years? What carrier currently insures it and at what premium?
- What's the average days-on-market for RENTAL listings here right now (not sales)? A rising rental-DOM trend means longer vacancies and softer asking-rent achievability than the comps imply.
- What's the recent tenant-quality profile in this submarket — average credit score on applications, eviction rate, late-payment / NSF rate, and stable-employment percentage? A property-management company in the area should have these aggregated.
- How much new for-sale + rental construction is in the pipeline within 1–3 miles? Heavy new supply typically softens prices + rents 12–24 months out; constrained supply supports both.
Investment metrics
- 1% rule
- 1.11% ✓
- Cap rate
- 7.77%
- Cash-on-cash
- 5.26%
- DSCR
- 1.23
- GRM
- 7.5
CMA / ARV
- ARV (on-the-fly)
- $121,538
- Comps found
- 12
Show comp detail 12 sales within ~0.75 mi
| Address | Dist | Beds/Ba | Sqft | Sold | Price | $/sf | Match |
|---|---|---|---|---|---|---|---|
| 1718 Donora St | 0.29mi | 3/1.0 | 900 (-1%) | 4mo | $39,900 | $44 | 82 |
| 713 E Greenlawn Ave | 0.31mi | 3/1.0 | 939 (+4%) | 0mo | $77,500 | $83 | 79 |
| 512 Woodrow Ave | 0.24mi | 2/1.0 (-1) | 912 (+1%) | 5mo | $104,500 | $115 | 79 |
| 555 Tisdale Ave | 0.25mi | 2/1.0 (-1) | 879 (-3%) | 2mo | $166,500 | $189 | 76 |
| 841 Baker St | 0.48mi | 3/1.0 | 960 (+6%) | 0mo | $57,000 | $59 | 67 |
| 2305 Forest Ave | 0.48mi | 2/1.0 (-1) | 888 (-2%) | 4mo | $142,200 | $160 | 66 |
| 613 Tisdale Ave | 0.20mi | 2/1.0 (-1) | 800 (-12%) | 1mo | $107,250 | $134 | 65 |
| 619 E Mount Hope Ave | 0.16mi | 3/2.0 | 1,040 (+15%) | 5mo | $75,000 | $72 | 60 |
| 1703 Linval St | 0.29mi | 2/2.5 (-1) | 814 (-10%) | 5mo | $117,000 | $144 | 54 |
| 531 Torrance Ct | 0.44mi | 2/1.0 (-1) | 780 (-14%) | 4mo | $80,000 | $103 | 48 |
| 546 Hamilton Ave | 0.63mi | 2/1.0 (-1) | 1,011 (+12%) | 0mo | $135,900 | $134 | 46 |
| 2515 Harding Ave | 0.55mi | 2/1.0 (-1) | 776 (-14%) | 0mo | $136,500 | $176 | 45 |
Match score weights: distance 35% · size 25% · config 20% · recency 20%. Top-matched comps best support the ARV.
Projected returns pro-forma
-3.0% appreciation · 4.71% rent growth · sell at horizon
- IRR
- -6.0%
- Equity multiple
- 0.77×
- Total profit
- $-7,155
- Equity at exit
- $16,685
- IRR
- 5.7%
- Equity multiple
- 1.46×
- Total profit
- $14,484
- Equity at exit
- $9,675
Cash invested: $31,332 (down + closing). Projections, not guarantees.
Landlord ↔ Tenant lean methodology
- Overall (STATE)
- 62 Landlord-Friendly
- State Michigan
- 62 Landlord-Friendly · EVEN
- County
- — inherits STATE
- City
- — inherits STATE
ZIP-level market 48910
- Rents YoY
- 4.7%
- Active inventory
- 177
- Price-to-rent
- 7.5×
Monthly cashflow live
- Estimated rent
- $1,237 high interval (Pro) →
- Mortgage (P&I)
- −$587
- Tax from tax record
- −$207 /mo · $2,481/yr
- Insurance
- −$47
- HOA
- −$0
- Vacancy / Maint / Mgmt
- −$260
- Net cashflow
- $137
Break-even live
Sensitivity live
| Price | -10% $201 | -5% $169 | +0% $137 | +5% $106 | +10% $74 |
|---|---|---|---|---|---|
| Rent | -10% $40 | -5% $89 | +0% $137 | +5% $186 | +10% $235 |
| Rate | -1.0pp $194 | -0.5pp $166 | base $137 | +0.5pp $108 | +1.0pp $79 |
UW: 25.0% down · 7.5% · 30yr · 1.5% tax · 5.0% vac · 8.0% maint · 8.0% mgmt
Financing live
Cash to close
- Down payment
- $27,975
- Closing costs
- $3,357
- Reserves months
- —
- Total cash needed
- —
Loan-product check · same deal, 3 products live
Conventional
25% down · 7.5% · 30yr
- Down + closing
- —
- Monthly P&I
- —
- Monthly cashflow
- —
- DSCR
- —
- Eligible?
- —
Personal DTI + credit; lowest rate.
DSCR
20% down · 8.5% · 30yr
- Down + closing
- —
- Monthly P&I
- —
- Monthly cashflow
- —
- DSCR
- —
- Eligible?
- —
No personal income docs; deal must DSCR.
Hard money
10% down · 12.0% · 12mo
- Down + closing
- —
- Monthly P&I
- —
- Monthly cashflow
- —
- DSCR
- —
- Eligible?
- —
Short-term bridge; refi at stabilization.
Rent comps 19 comps
| Address | Beds | Baths | Sqft | Rent | $/sqft | DOM | Units | Dist |
|---|---|---|---|---|---|---|---|---|
| 1016 E Greenlawn Ave Unit 3 Lansing, MI | 2.0 | 1.0 | 750 | $925 | $1.23 | 14d | 1 | 0.46mi |
| 401 E Willard Ave Unit 19 Lansing, MI | 2.0 | 1.0 | 775 | $1,000 | $1.29 | 44d | 1 | 0.53mi |
| 1828 Davis Ave Lansing, MI | 2.0 | 1.0 | 700 | $1,150 | $1.64 | 44d | 1 | 0.75mi |
| 1223 Bensch St Lansing, MI | 3.0 | 1.0 | 850 | $1,200 | $1.41 | 21d | 1 | 0.91mi |
| 430 Dunlap St Lansing, MI | 2.0 | 1.0 | 940 | $1,450 | $1.54 | 21d | 1 | 0.93mi |
| 3515 Bergman Ave Lansing, MI | 2.0 | 1.0 | 640 | $1,195 | $1.87 | 21d | 1 | 1.02mi |
| 3031 S Washington Ave Lansing, MI | 1.0–2.0 | 1.0 | 725 | $1,100 | $1.52 | 44d | 1 | 1.03mi |
| 920 S Washington Ave Lansing, MI | 1.0–2.0 | 1.0–2.0 | 900 | $1,250 | $1.39 | 14d | 1 | 1.07mi |
| 3716 Homewood Ave Lansing, MI | 2.0 | 1.0 | 692 | $1,300 | $1.88 | 21d | 1 | 1.10mi |
| 1100 Malcolm X St Unit B Lansing, MI | 2.0 | 1.0 | 979 | $1,050 | $1.07 | 14d | 1 | 1.11mi |
| 1913 Stirling Ave Unit 1 Lansing, MI | 2.0 | 2.0 | 1100 | $1,200 | $1.09 | 44d | 1 | 1.13mi |
| 3518 Davidson Dr Lansing, MI | 2.0 | 2.0 | 850 | $1,115 | $1.31 | 44d | 3 | 1.13mi |
| 335 E Saint Joseph St Unit 6 Lansing, MI | 2.0 | 1.0 | 700 | $949 | $1.36 | 44d | 1 | 1.17mi |
| 313 E Saint Joseph St Lansing, MI | 2.0 | 1.0 | 475 | $1,150 | $2.42 | 14d | 7 | 1.17mi |
| 910 Dakin St Lansing, MI | 3.0 | 1.0 | 908 | $1,295 | $1.43 | 44d | 1 | 1.21mi |
| 805 Bement St Unit Hosmer 507 Lansing, MI | 2.0 | 1.0 | 1120 | $1,075 | $0.96 | 44d | 1 | 1.26mi |
| 507 S Hosmer St Lansing, MI | 2.0 | 1.0 | 1120 | $1,075 | $0.96 | 44d | 1 | 1.28mi |
| 915 Loa St Lansing, MI | 2.0 | 1.0 | 674 | $999 | $1.48 | 44d | 1 | 1.29mi |
| 401 S Washington Sq Unit 205 Lansing, MI | 2.0 | 1.0 | 968 | $1,355 | $1.40 | 44d | 1 | 1.43mi |
Listing history 23 events
-
2026-06-18days on market $111,900 Active 17 DOM
-
2026-06-18price $111,900 Active 16 DOM
-
2026-06-17days on market $114,900 Active 16 DOM
-
2026-06-16days on market $114,900 Active 15 DOM
-
2026-06-15days on market $114,900 Active 14 DOM
-
2026-06-14days on market $114,900 Active 12 DOM
-
2026-06-13days on market $114,900 Active 11 DOM
-
2026-06-10days on market $114,900 Active 9 DOM
-
2026-06-09days on market $114,900 Active 8 DOM
-
2026-06-08days on market $114,900 Active 7 DOM
-
2026-06-07days on market $114,900 Active 6 DOM
-
2026-06-05days on market $114,900 Active 3 DOM
-
2026-06-03days on market $114,900 Active 2 DOM
-
2026-06-01statusdays on market $114,900 Active 1 DOM
-
2026-05-31days on market $114,900 Coming Soon 3 DOM
-
2026-05-30days on market $114,900 Coming Soon 2 DOM
-
2026-05-28historical $114,900
-
2022-11-21soldstatus $87,000
-
2022-11-14soldstatus $87,000 Closed 393-char remark
Show marketing remark (393 chars)
Meticulous comes to mind when you walk through this 2-3 bed 1 bath. Located on a Secluded short dead end road in a GREAT neighborhood. Sit back and enjoy the newly built 12x10 deck. This Move In Ready home is just waiting for you to make it your Home. Appliances included. Many updates were completed in 97. Current improvement are flooring paint and plumbing. Motivated seller!! Call today!!
-
2022-11-14soldstatus $87,000
Show marketing remark (393 chars)
Meticulous comes to mind when you walk through this 2-3 bed 1 bath. Located on a Secluded short dead end road in a GREAT neighborhood. Sit back and enjoy the newly built 12x10 deck. This Move In Ready home is just waiting for you to make it your Home. Appliances included. Many updates were completed in 97. Current improvement are flooring paint and plumbing. Motivated seller!! Call today!!
-
2022-10-03price $94,000 393-char remark
Show marketing remark (393 chars)
Meticulous comes to mind when you walk through this 2-3 bed 1 bath. Located on a Secluded short dead end road in a GREAT neighborhood. Sit back and enjoy the newly built 12x10 deck. This Move In Ready home is just waiting for you to make it your Home. Appliances included. Many updates were completed in 97. Current improvement are flooring paint and plumbing. Motivated seller!! Call today!!
-
2022-09-08$99,900 Active 393-char remark
Show marketing remark (393 chars)
Meticulous comes to mind when you walk through this 2-3 bed 1 bath. Located on a Secluded short dead end road in a GREAT neighborhood. Sit back and enjoy the newly built 12x10 deck. This Move In Ready home is just waiting for you to make it your Home. Appliances included. Many updates were completed in 97. Current improvement are flooring paint and plumbing. Motivated seller!! Call today!!
-
2022-09-08$94,000
Show marketing remark (393 chars)
Meticulous comes to mind when you walk through this 2-3 bed 1 bath. Located on a Secluded short dead end road in a GREAT neighborhood. Sit back and enjoy the newly built 12x10 deck. This Move In Ready home is just waiting for you to make it your Home. Appliances included. Many updates were completed in 97. Current improvement are flooring paint and plumbing. Motivated seller!! Call today!!
ⓘ Source: listings_history table (triggers on properties + properties_extension) + one-shot
backfill from property_details.listing_events for pre-trigger history.
Tax reassessment forecast MI · Partial reset (capped growth)
- Current annual tax
- $2,481 · $207/mo
- Projected year-2 tax
- $2,481 · $207/mo
- Expected delta
- $0/yr ($0/mo · 0.0%)
ⓘ Screening estimate from a state-policy table — verify with the county assessor before closing.
Climate risk First Street
- Flood 5/10 Major FEMA zone X (unshaded) · 24% chance over 30 yrs
- Wildfire 1/10 Low
- Heat 2/10 Low 7 d/yr ≥96°F today · 16 d/yr by 30 yrs out
- Wind 2/10 Low
- Air quality 2/10 Low 1 unhealthy d/yr today · 2 by 30 yrs out
Nearby sold comps map
Loading sold comps map…
Walkable amenities ~0.75 mi
Loading nearby amenities…
Taxation est. · year 1
- Rental income
- $14,850
- − Mortgage interest
- −$6,268
- − Property taxes
- −$2,481
- − Insurance
- −$560
- − Repairs & maintenance
- −$1,188
- − Management
- −$1,188
- − Depreciation
- −$3,255
- Taxable loss
- −$90
- Est. tax savings @ 24.0%
- +$22
- After-tax cash flow
- $1,671/yr
For passive investors: Depreciation is non-cash, so a rental often shows a tax loss while cash-flowing — sheltering income. Rental losses are passive: they offset passive income freely, and up to $25,000/yr can offset ordinary (W-2) income if you actively participate and your MAGI is under $100k (phasing out to $0 by $150k); unused losses carry forward. On sale, claimed depreciation is recaptured at up to 25%, and gains may owe capital-gains tax (a 1031 exchange can defer both). Figures are a year-1 estimate at your 24.0% rate — not tax advice; consult a CPA.
Schools (NCES district)
- District
- Lansing Public School District
- NCES district ID
- 2621150
- Math proficiency
- 14% ▲ 1.00%
- Reading proficiency
- 23% ▲ 3.00%
- Median HH income
- $37,453
- Composite
- 18.76/100
- National rank
- #14002
- State rank
- #650 of 760 in MI
Livability — Lansing
- Score
- 79/100
- State rank
- #94
- US rank
- #2182
Category grades
Schools grade is shown separately in the Schools card above.
Census & demographics
- Census place
- Lansing, MI
- County
- Ingham County · 237,052 people
- City population
- 161,269
- Metro
- Lansing-East Lansing, MI
- Population (ZIP)
- 32,800
- Household income
- $54,712
- Rent vs Own
- Severe rent burden
- 1305.0
Population outlook (Ingham County) Hauer SSP2
- Today (2025)
- 300,362 people
- By 2030
- 307,808 · +2.5%
- By 2040
- 320,492 · +6.7%
- By 2050
- 333,223 · +10.9%
- By 2075
- 373,693 · +24.4%
- By 2100
- 392,021 · +30.5%
Race, ethnicity, and origin ACS 2023
- Neighborhood character
- Diverse neighborhood (Simpson 0.62)
- Race & ethnicity
- White 58% Black 16% Hispanic / Latino 12% Two or more races 12% Asian 4% Native American 1%
- Hispanic origin (detail)
- Mexican 9% Cuban 2%
- Common ancestry
- Romanian 5% Lithuanian 3% Slovak 2%
- Foreign-born
- 9% · Canada, China, Vietnam
- Languages at home
- 87% English-only · Spanish 6% Chinese 1% Other Indo-European 1%
Political lean MEDSL · Ingham
- 2024 margin
- Strong D (+29.7) · D 63.9% · R 34.2% · Other 2.0%
- 2008→2024 swing
- -3.6pp toward R · 2008: 33.3pp · 2024: 29.7pp
- All cycles
- 2024: D+29.7 2020: D+32.2 2016: D+27.6 2012: D+27.9 2008: D+33.3
Not yet ingested
- Civics
- —
Market trends
- HPI YoY
- ▼ -211.82%
- Current HPI
- 196.8087
- Rent YoY
- ▲ 4.71%
- Metro
- Lansing-East Lansing, MI
- State GDP YoY
- ▲ 1.37%
- F500 in state
- 28
Industry mix (Fortune 500 HQ in MI)
| Industry | F500 HQs | Revenue |
|---|---|---|
| Automotive Parts | 3 | $48B |
|
||
| Automotive | 2 | $372B |
|
||
| Chemicals | 1 | $45B |
|
||
| Automotive Retail | 1 | $29B |
|
||
| Healthcare / Medical Devices | 1 | $23B |
|
||
| Automotive Technology | 1 | $20B |
|
||
Price history
+15.0% since first listed7 events — show timeline
- 2026-05-28 Coming Soon $114,900 Greater Lansing AoR
- 2022-11-21 Sold (Public Records) $87,000 Public Records
- 2022-11-14 Sold (MLS) $87,000 REALCOMP
- 2022-11-14 Sold (MLS) $87,000 Greater Lansing AoR
- 2022-10-03 Price Changed $94,000 Greater Lansing AoR
- 2022-09-08 Listed $94,000 REALCOMP
- 2022-09-08 Listed $99,900 Greater Lansing AoR
Property tax history
+7.5%/yrLatest (2025): $2,481 · +3.0% YoY. Source: county tax records.
Cash-flow waterfall
monthlySold comps — $/sqft
last 12 mo · ≤1 miLoading sold comps…