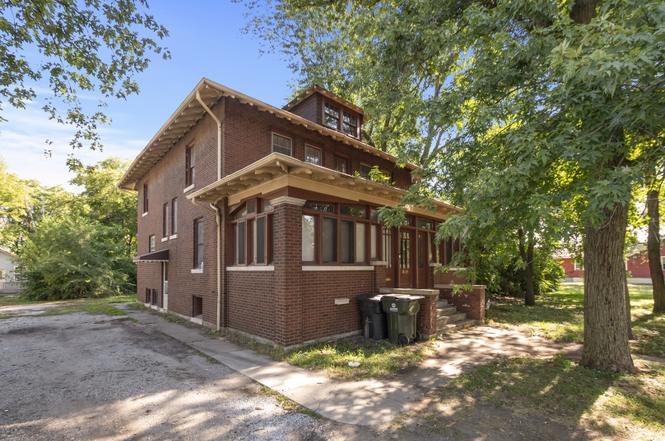
14119 Lincoln Ave · Dolton, IL
Flood risk 1/10 · Minimal
- FEMA flood zone
- X (unshaded)
- Chance of flooding over 30 yrs
- 0.0%
- Est. flood insurance / yr
- $507 – $1,088
Fire risk 1/10 · Minimal
- Est. fire insurance / yr
- $804 – $1,492
Heat risk 3/10 · Minor
- Hot days now (above 101°F)
- 7 days/yr
- Hot days in 30 yrs
- 15 days/yr
Wind risk 2/10 · Minimal
- Chance of severe wind over 30 yrs
- —
Air-quality risk 4/10 · Minor
- Unhealthy air days now
- 4 days/yr
- Unhealthy air days in 30 yrs
- 5 days/yr
Risk factors via First Street. Map © Google.
Why this score? — see what drove the B+ grade
The composite is a weighted blend of 9 inputs, each scored 0–100. Each bar is that input's sub-score; the figure is the points it added to the 100-point composite (weight × sub-score).
- Cash flow +30.0/30.0
- ARV discount +15.0/15.0
- 1% rule +10.0/10.0
- DSCR +10.0/10.0
- Rent growth +4.9/5.0
- Livability +3.7/5.0
- Condition / age +2.5/5.0
- Schools +0.7/10.0
- Appreciation +0.0/10.0
$169,900
🖨 Deal sheet 📄 Offer letter ✓ Due diligence
Listing remarks
If you like uniqueness then you will jump at the chance to be the next owner of this beauty! This property features almost 2300 s. f. above grade living space, original hardwood floors and woodwork throughout, coffered ceilings, real wood burning fire place, an expansive enclosed front porch, privacy galore, and so much more to mention! There are 4 spacious bedrooms on the second level and a bonus room on the main level, perfect for a home office or extra bedroom. The adjacent lot is also included in the sale which provides an opportunity for future expansion. Schedule your private showing, homes like this one aren't available too often!
Key facts
- Coffered ceilings
- Enclosed front porch
- 0.5 acre lot
Tags
Property features AI
Finance
- Other: School bus service available; Easy interstate access
- HOA & community: No master association fee required
Exterior
- Parking: Gravel parking; Side driveway; Space for about 6 vehicles
- Security: Holds earnest money
- Utilities: Public water; Public sewer
- Home design: Detached single-family home; 2 stories; Fee simple ownership; Property over 100 years old; Built before 1978
- Construction: Brick construction
- Exterior features: Street lights nearby; Lot dimensions approximately 429 x 51
Interior
- Kitchen: Kitchen (main level)
- Bedrooms: 4 bedrooms (master and three additional bedrooms on the second floor)
- Flooring: Hardwood floors in main living areas and bedrooms
- Bathrooms: 1 full bathroom
- Heating & cooling: Natural gas heat
- Interior features: 8 total rooms; Unfinished full basement; Bonus room (main level)
- Laundry & utility: Laundry room (basement)
Neighborhood map
What this means for you Summary
Snapshot
- This is a 4-bed/2.0-bath single-family listed at $170k.
Deal economics
- At list price, monthly cash flow is $941 ($11k/yr) — positive.
- The deal already cash-flows at list — no discount required.
- Meets the 1% rule at list price ($3k rent vs $170k).
- Recommended offer: $150k (12.0% below list) — sets the bar for market timing.
- Cap rate 12.9% vs local median 9.3% in Dolton — top-decile yield for the area; either an underpriced asset or a hidden risk that comps aren't pricing in. Stress-test before assuming the spread holds.
Location & tenants
- Location reads 74/100 on livability (#263 in IL, #4,883 nationally) — a middle-class / working-renter tenant base. Strengths: commute A+, cost of living A+, housing A+; Watch: employment C-, health & safety C-, schools F.
- Thornton Twp Hsd 205 (suburban): math 7% / reading 8% proficiency, ranked #594 of 620 in IL (top 96%) — low school quality limits family demand, transient renter base, plan for 1-2y turnover.
- Market conditions: Rents rising fast (+9.7%/yr); 130 active listings in the ZIP; 4 comparable units currently listed for rent nearby; rentals at typical pace (median 25d on market — plan ~3-4 weeks tenant-placement turnaround); 6,272 units permitted in Cook County in 2024 (4,658 in 5+ unit buildings).
- At $2,677/mo this rent would consume 55% of the median local household income ($58k/yr) (locally 919% of renters already pay >50% of income on rent) — very limited rent-growth headroom before tenants either downsize or default.
Forward outlook
- Local home prices are declining (-3.0%/yr); year-one equity from $1k of loan paydown is wiped out by about $5k of value loss. Plan a longer hold.
- At projected returns (-3.0% appreciation + 8.0% rent growth), your $48k cash investment doubles in ~5 years — after that, you're playing with house money.
Negotiation context
- It's been on market 131 days — a 12% lower offer ($150k) is reasonable based on typical stale-listing flexibility.
- 4 sale attempts with the ask held roughly flat each time — persistent listings suggest the price (not the market) is what's stuck; bring a comps-based counter.
Risks & watch-outs
- Watch-outs: built in 1920 — expect roof / HVAC / electrical / plumbing capex.
Questions for the listing agent
- It's been on market 131 days. Have you received any prior offers? Is the seller open to a 12% concession, seller financing, or rate buy-down credit?
- Built in 1920 — when were the roof, HVAC, electrical panel, plumbing, and water heater last replaced?
- Why hasn't it sold? Are there any deal-killer items the seller is aware of (foundation, flood, title, zoning, code violations)?
- Is there a deadline driving the sale (1031 exchange, divorce, estate, relocation)? That informs how much negotiation room exists.
- Schools are F-rated, which usually means shorter tenancies and higher turnover. Who's the typical renter profile here, and what's been the actual vacancy rate?
- Crime grade is D in this area — have there been break-ins, vandalism, or insurance claims at this property in the last 3 years? What carrier currently insures it and at what premium?
- What's the average days-on-market for RENTAL listings here right now (not sales)? A rising rental-DOM trend means longer vacancies and softer asking-rent achievability than the comps imply.
- What's the recent tenant-quality profile in this submarket — average credit score on applications, eviction rate, late-payment / NSF rate, and stable-employment percentage? A property-management company in the area should have these aggregated.
- How much new for-sale + rental construction is in the pipeline within 1–3 miles? Heavy new supply typically softens prices + rents 12–24 months out; constrained supply supports both.
Investment metrics
- 1% rule
- 1.58% ✓
- Cap rate
- 12.94%
- Cash-on-cash
- 23.73%
- DSCR
- 2.06
- GRM
- 5.3
CMA / ARV
- ARV (on-the-fly)
- $208,754
- Comps found
- 10
Show comp detail 10 sales within ~0.75 mi
| Address | Dist | Beds/Ba | Sqft | Sold | Price | $/sf | Match |
|---|---|---|---|---|---|---|---|
| 13920 Kanawha Ave | 0.28mi | 4/2.0 | 2,122 (-8%) | 2mo | $73,000 | $34 | 72 |
| 14208 Ingleside Ave | 0.62mi | 4/2.5 | 2,190 (-4%) | 2mo | $250,000 | $114 | 60 |
| 14223 Grant St | 0.16mi | 4/2.0 | 1,995 (-13%) | 18mo | $130,000 | $65 | 56 |
| 13837 Forest Ave | 0.41mi | 4/2.0 | 2,120 (-8%) | 18mo | $120,000 | $57 | 53 |
| 264 E 142nd Pl | 0.44mi | 3/3.0 (-1) | 2,190 (-4%) | 14mo | $200,000 | $91 | 52 |
| 14539 Murray Ave | 0.64mi | 4/3.0 | 2,500 (+9%) | 1mo | $269,900 | $108 | 50 |
| 13901 S Michigan Ave | 0.74mi | 4/1.0 | 2,300 (+0%) | 14mo | $162,000 | $70 | 50 |
| 14491 Lincoln Ave | 0.71mi | 4/3.0 | 2,300 (+0%) | 20mo | $274,000 | $119 | 46 |
| 14036 Lincoln Ave | 0.18mi | 4/3.0 | 1,966 (-14%) | 24mo | $56,650 | $29 | 44 |
| 14119 S Wabash Ave | 0.75mi | 5/1.5 (+1) | 2,200 (-4%) | 22mo | $225,000 | $102 | 33 |
Match score weights: distance 35% · size 25% · config 20% · recency 20%. Top-matched comps best support the ARV.
Projected returns pro-forma
-3.0% appreciation · 8.0% rent growth · sell at horizon
- IRR
- 22.4%
- Equity multiple
- 1.98×
- Total profit
- $46,574
- Equity at exit
- $25,333
- IRR
- 33.6%
- Equity multiple
- 4.83×
- Total profit
- $182,265
- Equity at exit
- $14,690
Cash invested: $47,572 (down + closing). Projections, not guarantees.
Landlord ↔ Tenant lean methodology
- Overall (STATE)
- 43 Moderately Tenant-Leaning
- State Illinois
- 43 Moderately Tenant-Leaning · D+7
- County
- — inherits STATE
- City
- — inherits STATE
ZIP-level market 60419
- Home prices YoY
- -25.7%
- Rents YoY
- 9.7%
- Active inventory
- 130
- Price-to-rent
- 5.3×
Monthly cashflow live
- Estimated rent
- $2,677 medium interval (Pro) →
- Mortgage (P&I)
- −$891
- Tax est. 1.5%
- −$212 /mo · $2,548/yr
- Insurance
- −$71
- HOA
- −$0
- Vacancy / Maint / Mgmt
- −$562
- Net cashflow
- $941
Break-even live
UW: 25.0% down · 7.5% · 30yr · 1.5% tax · 5.0% vac · 8.0% maint · 8.0% mgmt
Financing live
Cash to close
- Down payment
- $42,475
- Closing costs
- $5,097
- Reserves months
- —
- Total cash needed
- —
Loan-product check · same deal, 3 products live
Conventional
25% down · 7.5% · 30yr
- Down + closing
- —
- Monthly P&I
- —
- Monthly cashflow
- —
- DSCR
- —
- Eligible?
- —
Personal DTI + credit; lowest rate.
DSCR
20% down · 8.5% · 30yr
- Down + closing
- —
- Monthly P&I
- —
- Monthly cashflow
- —
- DSCR
- —
- Eligible?
- —
No personal income docs; deal must DSCR.
Hard money
10% down · 12.0% · 12mo
- Down + closing
- —
- Monthly P&I
- —
- Monthly cashflow
- —
- DSCR
- —
- Eligible?
- —
Short-term bridge; refi at stabilization.
Rent comps 4 comps
| Address | Beds | Baths | Sqft | Rent | $/sqft | DOM | Units | Dist |
|---|---|---|---|---|---|---|---|---|
| 19 E 140th Ct Riverdale, IL | 3.0 | 2.0 | 2076 | $2,231 | $1.07 | 7d | 1 | 0.77mi |
| 13903 S State St Riverdale, IL | 4.0 | 1.5 | 2300 | $2,650 | $1.15 | 24d | 1 | 0.87mi |
| 14505 Minerva Ave Dolton, IL | 4.0 | 2.0 | 2100 | $2,500 | $1.19 | 24d | 1 | 0.93mi |
| 1429 Kasten Dr Dolton, IL | 3.0 | 1.0 | 1600 | $2,500 | $1.56 | 1d | 1 | 1.36mi |
Listing history 21 events
-
2026-06-18days on market $169,900 Active 131 DOM
-
2026-06-17days on market $169,900 Active 130 DOM
-
2026-06-16days on market $169,900 Active 129 DOM
-
2026-06-15days on market $169,900 Active 128 DOM
-
2026-06-13days on market $169,900 Active 126 DOM
-
2026-06-13days on market $169,900 Active 125 DOM
-
2026-06-09days on market $169,900 Active 122 DOM
-
2026-06-08days on market $169,900 Active 121 DOM
-
2026-06-07days on market $169,900 Active 120 DOM
-
2026-06-04days on market $169,900 Active 117 DOM
-
2026-06-03days on market $169,900 Active 116 DOM
-
2026-06-02days on market $169,900 Active 115 DOM
-
2026-06-01days on market $169,900 Active 114 DOM
-
2026-05-31days on market $169,900 Active 113 DOM
-
2026-02-07$169,900 Active
-
2026-02-07historical
-
2026-02-06status Active
-
2026-01-31historical
-
2025-10-09Active
-
2025-07-29historical
-
2025-06-18Active
ⓘ Source: listings_history table (triggers on properties + properties_extension) + one-shot
backfill from property_details.listing_events for pre-trigger history.
Climate risk First Street
- Flood 1/10 Low FEMA zone X (unshaded) · 0% chance over 30 yrs
- Wildfire 1/10 Low
- Heat 3/10 Moderate 7 d/yr ≥101°F today · 15 d/yr by 30 yrs out
- Wind 2/10 Low
- Air quality 4/10 Moderate 4 unhealthy d/yr today · 5 by 30 yrs out
Nearby sold comps map
Loading sold comps map…
Walkable amenities ~0.75 mi
Loading nearby amenities…
Taxation est. · year 1
- Rental income
- $32,125
- − Mortgage interest
- −$9,517
- − Property taxes
- −$2,548
- − Insurance
- −$850
- − Repairs & maintenance
- −$2,570
- − Management
- −$2,570
- − Depreciation
- −$4,943
- Taxable income
- $9,127
- Est. tax owed @ 24.0%
- −$2,191
- After-tax cash flow
- $9,098/yr
For passive investors: Depreciation is non-cash, so a rental often shows a tax loss while cash-flowing — sheltering income. Rental losses are passive: they offset passive income freely, and up to $25,000/yr can offset ordinary (W-2) income if you actively participate and your MAGI is under $100k (phasing out to $0 by $150k); unused losses carry forward. On sale, claimed depreciation is recaptured at up to 25%, and gains may owe capital-gains tax (a 1031 exchange can defer both). Figures are a year-1 estimate at your 24.0% rate — not tax advice; consult a CPA.
Schools (NCES district)
- District
- Thornton Twp Hsd 205
- NCES district ID
- 1738970
- Math proficiency
- 7% ▬ 0.00%
- Reading proficiency
- 8% ▼ -2.00%
- Median HH income
- $43,392
- Composite
- 6.92/100
- National rank
- #9976
- State rank
- #594 of 620 in IL
Livability — Dolton
- Score
- 74/100
- State rank
- #263
- US rank
- #4883
Category grades
Schools grade is shown separately in the Schools card above.
Census & demographics
- Census place
- Dolton, IL
- County
- Cook County · 4,486,803 people
- City population
- 20,825
- Metro
- Chicago-Naperville-Elgin, IL-IN-WI
- Population (ZIP)
- 20,825
- Household income
- $57,887
- Rent vs Own
- Severe rent burden
- 919.0
Population outlook (Cook County) Hauer SSP2
- Today (2025)
- 5,347,519 people
- By 2030
- 5,357,703 · +0.2%
- By 2040
- 5,324,924 · -0.4%
- By 2050
- 5,230,762 · -2.2%
- By 2075
- 4,785,735 · -10.5%
- By 2100
- 4,188,836 · -21.7%
Race, ethnicity, and origin ACS 2023
- Neighborhood character
- Predominantly Black (91%)
- Race & ethnicity
- Black 91% White 4% Two or more races 3% Hispanic / Latino 1%
- Common ancestry
- Romanian 1% Hispanic 1%
- Foreign-born
- 3% · Canada
- Languages at home
- 95% English-only · French/Haitian/Cajun 2% Spanish 1%
Political lean MEDSL · Cook
- 2024 margin
- Solid D (+42.0) · D 70.4% · R 28.4% · Other 1.2%
- 2008→2024 swing
- -11.4pp toward R · 2008: 53.4pp · 2024: 42.0pp
- All cycles
- 2024: D+42.0 2020: D+50.3 2016: D+53.0 2012: D+49.4 2008: D+53.4
Not yet ingested
- Civics
- —
Market trends
- HPI YoY
- ▼ -66.88%
- Current HPI
- 193.2346
- Rent YoY
- ▲ 9.65%
- Metro
- Chicago-Naperville-Elgin, IL-IN-WI
- State GDP YoY
- ▲ 1.59%
- F500 in state
- 60
Industry mix (Fortune 500 HQ in IL)
| Industry | F500 HQs | Revenue |
|---|---|---|
| Insurance | 4 | $201B |
|
||
| Consumer Goods | 4 | $87B |
|
||
| Industrial Machinery | 3 | $64B |
|
||
| Healthcare | 2 | $55B |
|
||
| Retail / Pharmacy | 1 | $148B |
|
||
| Agriculture / Food | 1 | $86B |
|
||
Price history
7 events — show timeline
- 2026-02-07 Listing Removed — MRED as Distributed by MLS Grid
- 2026-02-07 Listed $169,900 MRED as Distributed by MLS Grid
- 2026-02-06 Relisted — MRED as Distributed by MLS Grid
- 2026-01-31 Listing Removed — MRED as Distributed by MLS Grid
- 2025-10-09 Listed — MRED as Distributed by MLS Grid
- 2025-07-29 Listing Removed — MRED as Distributed by MLS Grid
- 2025-06-18 Listed — MRED as Distributed by MLS Grid
Cash-flow waterfall
monthlySold comps — $/sqft
last 12 mo · ≤1 miLoading sold comps…