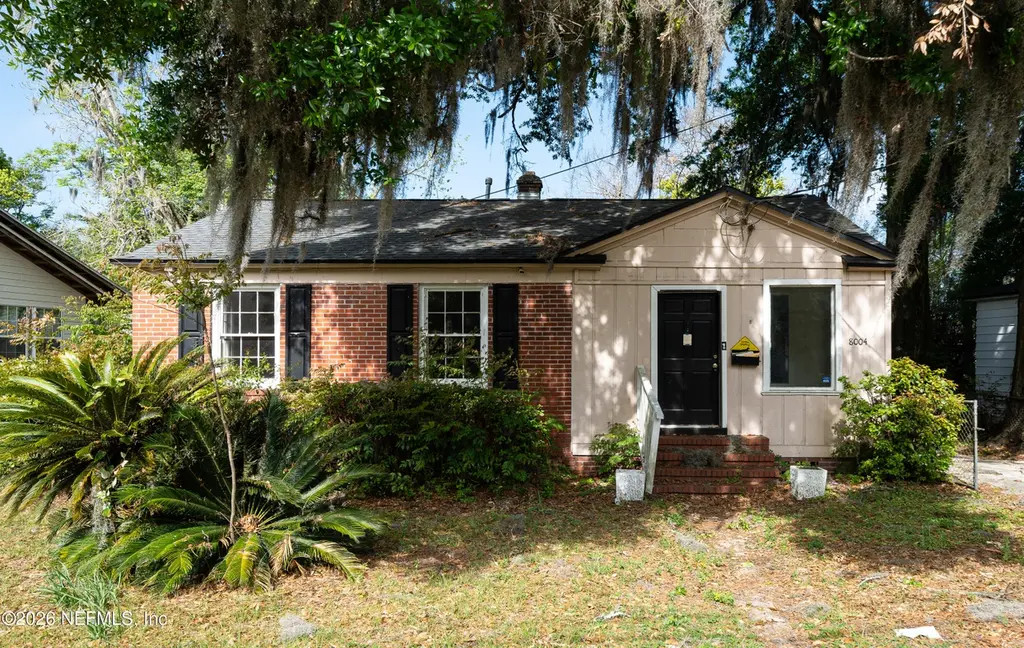
8004 Delaware Ave · Jacksonville, FL
Flood risk 4/10 · Minor
- FEMA flood zone
- X (unshaded)
- Chance of flooding over 30 yrs
- 0.22%
- Est. flood insurance / yr
- $507 – $1,088
Fire risk 1/10 · Minimal
- Est. fire insurance / yr
- $947 – $1,759
Heat risk 9/10 · Severe
- Hot days now (above 107°F)
- 7 days/yr
- Hot days in 30 yrs
- 20 days/yr
Wind risk 9/10 · Severe
- Chance of severe wind over 30 yrs
- 99.0%
Air-quality risk 4/10 · Minor
- Unhealthy air days now
- 6 days/yr
- Unhealthy air days in 30 yrs
- 6 days/yr
Risk factors via First Street. Map © Google.
Why this score? — see what drove the B grade
The composite is a weighted blend of 9 inputs, each scored 0–100. Each bar is that input's sub-score; the figure is the points it added to the 100-point composite (weight × sub-score).
- Cash flow +30.0/30.0
- DSCR +10.0/10.0
- 1% rule +9.8/10.0
- ARV discount +8.7/15.0
- Livability +4.2/5.0
- Schools +3.9/10.0
- Condition / age +2.5/5.0
- Rent growth +2.2/5.0
- Appreciation +0.0/10.0
$90,000
🖨 Deal sheet 📄 Offer letter ✓ Due diligence
Listing remarks MLS
2 bed 1 bath available
Key facts
- Easy access to i-95
- Florida room
- Fenced backyard
Tags
Neighborhood map
What this means for you Summary
Snapshot
- This is a 2-bed/1.0-bath single-family listed at $90k.
Deal economics
- At list price, monthly cash flow is $357 ($4k/yr) — positive.
- The deal already cash-flows at list — no discount required.
- Meets the 1% rule at list price ($1k rent vs $90k).
- Cap rate 11.1% vs local median 4.0% in Jacksonville — top-decile yield for the area; either an underpriced asset or a hidden risk that comps aren't pricing in. Stress-test before assuming the spread holds.
Location & tenants
- Location reads 83/100 on livability (#50 in FL, #911 nationally) — a professional / high-income tenant draw. Strengths: amenities A+, commute A+, housing A+.
- Duval (urban): math 46% / reading 45% proficiency, ranked #48 of 73 in FL (top 66%) — families likely to look elsewhere, expect single-tenant / working-renter base with shorter leases.
- Market conditions: Rents soft (-1.4%/yr); 291 active listings in the ZIP; 40 comparable units currently listed for rent nearby; rentals at typical pace (median 16d on market — plan ~3-4 weeks tenant-placement turnaround); lower-income renter base — watch delinquency; 6,503 units permitted in Duval County in 2024 (1,131 in 5+ unit buildings).
- This rent runs 39% of the median local income ($41k/yr) — at the standard rent-burdened threshold; future hikes will face affordability resistance.
Forward outlook
- Local home prices are declining (-3.0%/yr); year-one equity from $622 of loan paydown is wiped out by about $3k of value loss. Plan a longer hold.
- Duval County population projected at +19% by 2050 — long-run rental-demand tailwind backs the buy-and-hold thesis.
Negotiation context
- Only 13 days on market — expect competitive offers; lowballing is unlikely to land.
- 3 sale attempts since 20y ago with the ask held roughly flat each time — persistent listings suggest the price (not the market) is what's stuck; bring a comps-based counter.
Risks & watch-outs
- Watch-outs: built in 1944 — expect roof / HVAC / electrical / plumbing capex.
- Climate carrying-cost: severe wind risk, 99% chance of damaging wind over 30y; extreme-heat days projected 7→20/yr by 2055 (HVAC capex compounding) — expect insurance premiums to compound above CPI over the hold.
Questions for the listing agent
- Built in 1944 — when were the roof, HVAC, electrical panel, plumbing, and water heater last replaced?
- Is there a deadline driving the sale (1031 exchange, divorce, estate, relocation)? That informs how much negotiation room exists.
- Schools are B-rated — typically a magnet for longer-tenancy family renters. What's the average tenant stay here, and is there a school-zone premium baked into asking?
- What's the average days-on-market for RENTAL listings here right now (not sales)? A rising rental-DOM trend means longer vacancies and softer asking-rent achievability than the comps imply.
- What's the recent tenant-quality profile in this submarket — average credit score on applications, eviction rate, late-payment / NSF rate, and stable-employment percentage? A property-management company in the area should have these aggregated.
- How much new for-sale + rental construction is in the pipeline within 1–3 miles? Heavy new supply typically softens prices + rents 12–24 months out; constrained supply supports both.
Investment metrics
- 1% rule
- 1.48% ✓
- Cap rate
- 11.05%
- Cash-on-cash
- 17.01%
- DSCR
- 1.76
- GRM
- 5.6
CMA / ARV
- ARV (on-the-fly)
- $92,568
- Comps found
- 12
Show comp detail 12 sales within ~0.75 mi
| Address | Dist | Beds/Ba | Sqft | Sold | Price | $/sf | Match |
|---|---|---|---|---|---|---|---|
| 8004 Delaware Ave | 0.00mi | 3/1.0 (+1) | 1,064 (0%) | 1mo | $60,000 | $56 | 94 |
| 1116 Stark St | 0.05mi | 3/1.0 (+1) | 1,190 (+12%) | 2mo | $65,000 | $55 | 71 |
| 7632 Lueders Ave | 0.40mi | 3/1.0 (+1) | 1,024 (-4%) | 6mo | $144,000 | $141 | 65 |
| 1012 Brandywine St | 0.15mi | 3/1.0 (+1) | 945 (-11%) | 6mo | $115,000 | $122 | 64 |
| 7848 Tory Pl N | 0.60mi | 2/1.0 | 1,047 (-2%) | 7mo | $91,100 | $87 | 64 |
| 8608 2nd Ave | 0.52mi | 3/2.0 (+1) | 1,045 (-2%) | 4mo | $155,000 | $148 | 61 |
| 815 Cornwallis Dr | 0.57mi | 3/1.0 (+1) | 1,042 (-2%) | 8mo | $85,000 | $82 | 58 |
| 8053 Lexington Dr | 0.38mi | 3/1.0 (+1) | 954 (-10%) | 3mo | $85,000 | $89 | 57 |
| 1224 Kennard St | 0.56mi | 3/2.0 (+1) | 1,092 (+3%) | 6mo | $50,000 | $46 | 56 |
| 8728 1st Ave | 0.55mi | 3/1.0 (+1) | 972 (-9%) | 9mo | $35,000 | $36 | 47 |
| 1230 Kennard St | 0.56mi | 3/2.0 (+1) | 1,209 (+14%) | 8mo | $240,000 | $199 | 36 |
| 8953 Adams Ave | 0.71mi | 3/2.0 (+1) | 1,176 (+10%) | 8mo | $90,000 | $77 | 33 |
Match score weights: distance 35% · size 25% · config 20% · recency 20%. Top-matched comps best support the ARV.
Projected returns pro-forma
-3.0% appreciation · 0.0% rent growth · sell at horizon
- IRR
- 4.6%
- Equity multiple
- 1.17×
- Total profit
- $4,329
- Equity at exit
- $13,419
- IRR
- 10.9%
- Equity multiple
- 1.72×
- Total profit
- $18,264
- Equity at exit
- $7,782
Cash invested: $25,200 (down + closing). Projections, not guarantees.
Landlord ↔ Tenant lean methodology
- Overall (STATE)
- 87 Strongly Landlord-Friendly
- State Florida
- 87 Strongly Landlord-Friendly · R+3
- County
- — inherits STATE
- City
- — inherits STATE
ZIP-level market 32208
- Home prices YoY
- -33.6%
- Rents YoY
- -1.4%
- Active inventory
- 291
- Price-to-rent
- 5.6×
Monthly cashflow live
- Estimated rent
- $1,329 high interval (Pro) →
- Mortgage (P&I)
- −$472
- Tax from tax record
- −$183 /mo · $2,200/yr
- Insurance
- −$38
- HOA
- −$0
- Vacancy / Maint / Mgmt
- −$279
- Net cashflow
- $357
Break-even live
UW: 25.0% down · 7.5% · 30yr · 1.5% tax · 5.0% vac · 8.0% maint · 8.0% mgmt
Financing live
Cash to close
- Down payment
- $22,500
- Closing costs
- $2,700
- Reserves months
- —
- Total cash needed
- —
Loan-product check · same deal, 3 products live
Conventional
25% down · 7.5% · 30yr
- Down + closing
- —
- Monthly P&I
- —
- Monthly cashflow
- —
- DSCR
- —
- Eligible?
- —
Personal DTI + credit; lowest rate.
DSCR
20% down · 8.5% · 30yr
- Down + closing
- —
- Monthly P&I
- —
- Monthly cashflow
- —
- DSCR
- —
- Eligible?
- —
No personal income docs; deal must DSCR.
Hard money
10% down · 12.0% · 12mo
- Down + closing
- —
- Monthly P&I
- —
- Monthly cashflow
- —
- DSCR
- —
- Eligible?
- —
Short-term bridge; refi at stabilization.
Rent comps 40 comps
| Address | Beds | Baths | Sqft | Rent | $/sqft | DOM | Units | Dist |
|---|---|---|---|---|---|---|---|---|
| 1021 Lake Forest Blvd Jacksonville, FL | 3.0 | 1.0 | 1393 | $1,290 | $0.93 | 2d | 1 | 0.23mi |
| 7927 Reid Ave Jacksonville, FL | 3.0 | 1.0 | 1055 | $1,500 | $1.42 | 23d | 1 | 0.27mi |
| 912 Saratoga Blvd Jacksonville, FL | 3.0 | 1.0 | 930 | $1,250 | $1.34 | 23d | 1 | 0.34mi |
| 8253 Lexington Dr Jacksonville, FL | 3.0 | 1.0 | 910 | $1,330 | $1.46 | 23d | 1 | 0.38mi |
| 8617 3rd Ave Jacksonville, FL | 3.0 | 1.0 | 1048 | $1,200 | $1.15 | 10d | 1 | 0.52mi |
| 8642 2nd Ave Jacksonville, FL | 3.0 | 2.0 | 1074 | $1,245 | $1.16 | 1d | 1 | 0.53mi |
| 7350 Linda Dr Jacksonville, FL | 1.0 | 1.0 | 954 | $795 | $0.83 | 7d | 1 | 0.62mi |
| 8721 4th Ave Jacksonville, FL | 3.0 | 1.5 | 1344 | $1,399 | $1.04 | 23d | 1 | 0.63mi |
| 8663 5th Ave Jacksonville, FL | 2.0 | 1.0 | 720 | $1,045 | $1.45 | 23d | 1 | 0.64mi |
| 8918 1st Ave Jacksonville, FL | 3.0 | 2.0 | 1435 | $1,321 | $0.92 | 16d | 1 | 0.73mi |
| 8973 4th Ave Jacksonville, FL | 3.0 | 2.0 | 1230 | $1,438 | $1.17 | 14d | 1 | 0.84mi |
| 9017 6th Ave Jacksonville, FL | 2.0 | 1.0 | 1038 | $1,098 | $1.06 | 23d | 1 | 0.92mi |
| 9124 Adams Ave Jacksonville, FL | 3.0 | 3.0 | 1207 | $1,800 | $1.49 | 23d | 1 | 0.93mi |
| 1975 Rugby Rd Jacksonville, FL | 2.0 | 1.0 | 992 | $1,100 | $1.11 | 7d | 1 | 0.93mi |
| 1000 Island Point Dr Jacksonville, FL | 1.0–3.0 | 1.0–2.0 | 949 | $1,376 | $1.45 | 2d | 9 | 0.93mi |
| 9131 Jefferson Ave Jacksonville, FL | 3.0 | 1.0 | 910 | $1,350 | $1.48 | 3d | 1 | 0.95mi |
| 9037 6th Ave Jacksonville, FL | 3.0 | 2.0 | 1156 | $1,400 | $1.21 | 23d | 1 | 0.96mi |
| 9050 7th Ave Jacksonville, FL | 3.0 | 1.0 | 896 | $1,485 | $1.66 | 23d | 1 | 1.00mi |
| 9032 8th Ave Jacksonville, FL | 3.0 | 2.0 | 1300 | $1,500 | $1.15 | 23d | 1 | 1.01mi |
| 9131 4th Ave Jacksonville, FL | 3.0 | 2.0 | 1209 | $1,496 | $1.24 | 21d | 1 | 1.01mi |
| 5903 Droad St Jacksonville, FL | 3.0 | 1.0 | 1161 | $1,400 | $1.21 | 2d | 1 | 1.05mi |
| 800 Broward Rd Jacksonville, FL | 1.0–3.0 | 1.0–2.0 | 1028 | $1,368 | $1.33 | 1d | 42 | 1.08mi |
| 2312 Palmdale St Jacksonville, FL | 3.0 | 2.0 | 972 | $1,231 | $1.27 | 23d | 1 | 1.08mi |
| 7210 Elwood Ave Jacksonville, FL | 2.0 | 1.0 | 831 | $995 | $1.20 | 21d | 1 | 1.09mi |
| 7511 N Shore Dr Jacksonville, FL | 2.0 | 1.0 | 1014 | $1,350 | $1.33 | 4d | 1 | 1.11mi |
| 9565 Carbondale Dr W Unit B Jacksonville, FL | 3.0 | 2.0 | 1400 | $2,000 | $1.43 | 23d | 1 | 1.17mi |
| 1567 Rutledge Ave Jacksonville, FL | 3.0 | 2.0 | 1050 | $1,113 | $1.06 | 23d | 1 | 1.17mi |
| 9279 6th Ave Jacksonville, FL | 3.0 | 2.0 | 1150 | $1,245 | $1.08 | 4d | 1 | 1.19mi |
| 472 W 65th St Jacksonville, FL | 3.0 | 1.0 | 1312 | $1,295 | $0.99 | 21d | 1 | 1.20mi |
| 961 Dorchester St Jacksonville, FL | 2.0 | 1.0 | 884 | $1,025 | $1.16 | 2d | 1 | 1.21mi |
| 780 Island Point Dr Jacksonville, FL | 1.0–3.0 | 1.0–2.0 | 1164 | $1,771 | $1.52 | 3d | 16 | 1.21mi |
| 9141 12th Ave Jacksonville, FL | 3.0 | 2.0 | 1209 | $1,598 | $1.32 | 20d | 1 | 1.21mi |
| 346 W 68th St Jacksonville, FL | 3.0 | 1.0 | 1114 | $1,385 | $1.24 | 4d | 1 | 1.24mi |
| 7124 Lorain St Jacksonville, FL | 3.0 | 1.0 | 864 | $1,043 | $1.21 | 2d | 1 | 1.25mi |
| 9148 13th Ave Jacksonville, FL | 3.0 | 1.0 | 1126 | $1,136 | $1.01 | 3d | 1 | 1.27mi |
| 920 Alderside St Jacksonville, FL | 3.0 | 1.0 | 1255 | $1,195 | $0.95 | 4d | 1 | 1.28mi |
| 9346 10th Ave Jacksonville, FL | 3.0 | 1.0 | 985 | $1,825 | $1.85 | 23d | 1 | 1.37mi |
| 535 W 59th St Jacksonville, FL | 3.0 | 2.0 | 816 | $1,395 | $1.71 | 7d | 1 | 1.40mi |
| 1750 Rutledge Ave Jacksonville, FL | 3.0 | 2.0 | 1250 | $1,358 | $1.09 | 14d | 1 | 1.43mi |
| 1536 W 45th St Jacksonville, FL | 2.0 | 1.0 | 800 | $1,050 | $1.31 | 23d | 1 | 1.44mi |
Listing history 11 events
-
2026-04-21status Pending
-
2026-04-08$90,000 Active
-
2022-01-25soldstatus $110,000
-
2022-01-14soldstatus $110,000 Sold 22-char remark
Show marketing remark (22 chars)
2 bed 1 bath available
-
2021-11-19historical 22-char remark
Show marketing remark (22 chars)
2 bed 1 bath available
-
2021-11-19$100,000 22-char remark
Show marketing remark (22 chars)
2 bed 1 bath available
-
2006-03-07historical 214-char remark
Show marketing remark (214 chars)
Wow what a great opportunity. This 3 bedroom 1 bath home could be a very cute mostly brick bungalow with just a little work. Newer gas heater. Detached 1 car garage. Close to I-95 and down town and the airport.
-
2006-03-03soldstatus $80,000
-
2006-02-27soldstatus $80,000 214-char remark
Show marketing remark (214 chars)
Wow what a great opportunity. This 3 bedroom 1 bath home could be a very cute mostly brick bungalow with just a little work. Newer gas heater. Detached 1 car garage. Close to I-95 and down town and the airport.
-
2006-01-29$99,000 214-char remark
Show marketing remark (214 chars)
Wow what a great opportunity. This 3 bedroom 1 bath home could be a very cute mostly brick bungalow with just a little work. Newer gas heater. Detached 1 car garage. Close to I-95 and down town and the airport.
-
1997-04-24soldstatus $47,000
ⓘ Source: listings_history table (triggers on properties + properties_extension) + one-shot
backfill from property_details.listing_events for pre-trigger history.
Tax reassessment forecast FL · Resets to sale price
- Current annual tax
- $2,200 · $183/mo
- Projected year-2 tax
- $2,200 · $183/mo
- Expected delta
- $0/yr ($0/mo · 0.0%)
ⓘ Screening estimate from a state-policy table — verify with the county assessor before closing.
Climate risk First Street
- Flood 4/10 Moderate FEMA zone X (unshaded) · 22% chance over 30 yrs
- Wildfire 1/10 Low
- Heat 9/10 Extreme 7 d/yr ≥107°F today · 20 d/yr by 30 yrs out
- Wind 9/10 Extreme 99% chance of damaging wind over 30 yrs
- Air quality 4/10 Moderate 6 unhealthy d/yr today · 6 by 30 yrs out
Nearby sold comps map
Loading sold comps map…
Walkable amenities ~0.75 mi
Loading nearby amenities…
Taxation est. · year 1
- Rental income
- $15,947
- − Mortgage interest
- −$5,041
- − Property taxes
- −$2,200
- − Insurance
- −$450
- − Repairs & maintenance
- −$1,276
- − Management
- −$1,276
- − Depreciation
- −$2,618
- Taxable income
- $3,087
- Est. tax owed @ 24.0%
- −$741
- After-tax cash flow
- $3,544/yr
For passive investors: Depreciation is non-cash, so a rental often shows a tax loss while cash-flowing — sheltering income. Rental losses are passive: they offset passive income freely, and up to $25,000/yr can offset ordinary (W-2) income if you actively participate and your MAGI is under $100k (phasing out to $0 by $150k); unused losses carry forward. On sale, claimed depreciation is recaptured at up to 25%, and gains may owe capital-gains tax (a 1031 exchange can defer both). Figures are a year-1 estimate at your 24.0% rate — not tax advice; consult a CPA.
Schools (NCES district)
- District
- Duval
- NCES district ID
- 1200480
- Math proficiency
- 46% ▼ -11.00%
- Reading proficiency
- 45% ▼ -4.00%
- Median HH income
- $48,987
- Composite
- 38.97/100
- National rank
- #4076
- State rank
- #48 of 73 in FL
Livability — Jacksonville
- Score
- 83/100
- State rank
- #50
- US rank
- #911
Category grades
Schools grade is shown separately in the Schools card above.
Census & demographics
- Census place
- Jacksonville, FL
- County
- Duval County · 1,015,274 people
- City population
- 979,034
- Metro
- Jacksonville, FL
- Population (ZIP)
- 32,699
- Household income
- $41,324
- Rent vs Own
- Severe rent burden
- 1765.0
Population outlook (Duval County) Hauer SSP2
- Today (2025)
- 1,013,010 people
- By 2030
- 1,059,228 · +4.6%
- By 2040
- 1,141,439 · +12.7%
- By 2050
- 1,205,258 · +19.0%
- By 2075
- 1,324,282 · +30.7%
- By 2100
- 1,319,620 · +30.3%
Race, ethnicity, and origin ACS 2023
- Neighborhood character
- Predominantly Black (77%)
- Race & ethnicity
- Black 77% White 16% Two or more races 4% Hispanic / Latino 3%
- Common ancestry
- Italian 1%
- Foreign-born
- 2% · Canada
- Languages at home
- 97% English-only · Spanish 2%
Political lean MEDSL · Duval
- 2024 margin
- Toss-up / Even · D 48.7% · R 50.1% · Other 1.2%
- 2008→2024 swing
- +0.4pp no change · 2008: -1.9pp · 2024: -1.5pp
- All cycles
- 2024: R+1.5 2020: D+3.8 2016: R+1.5 2012: R+3.6 2008: R+1.9
Not yet ingested
- Civics
- —
Market trends
- HPI YoY
- ▼ -110.56%
- Current HPI
- 217.9706
- Rent YoY
- ▼ -1.36%
- Metro
- Jacksonville, FL
- State GDP YoY
- ▲ 3.28%
- F500 in state
- 36
Industry mix (Fortune 500 HQ in FL)
| Industry | F500 HQs | Revenue |
|---|---|---|
| Industrial Technology | 2 | $29B |
|
||
| Insurance | 2 | $17B |
|
||
| Retail | 1 | $60B |
|
||
| Technology Distribution | 1 | $58B |
|
||
| Homebuilding | 1 | $35B |
|
||
| Technology Manufacturing | 1 | $35B |
|
||
Price history
+91.5% since first listed11 events — show timeline
- 2026-04-21 Pending — realMLS
- 2026-04-08 Listed $90,000 realMLS
- 2022-01-25 Sold (Public Records) $110,000 Public Records
- 2022-01-14 Sold (MLS) $110,000 realMLS
- 2021-11-19 Listed $100,000 realMLS
- 2021-11-19 Listing Removed — realMLS
- 2006-03-07 Listing Removed — realMLS
- 2006-03-03 Sold (Public Records) $80,000 Public Records
- 2006-02-27 Sold (MLS) $80,000 realMLS
- 2006-01-29 Listed $99,000 realMLS
- 1997-04-24 Sold (Public Records) $47,000 Public Records
Property tax history
+6.3%/yrLatest (2025): $2,200 · +11.5% YoY. Source: county tax records.
Cash-flow waterfall
monthlySold comps — $/sqft
last 12 mo · ≤1 miLoading sold comps…