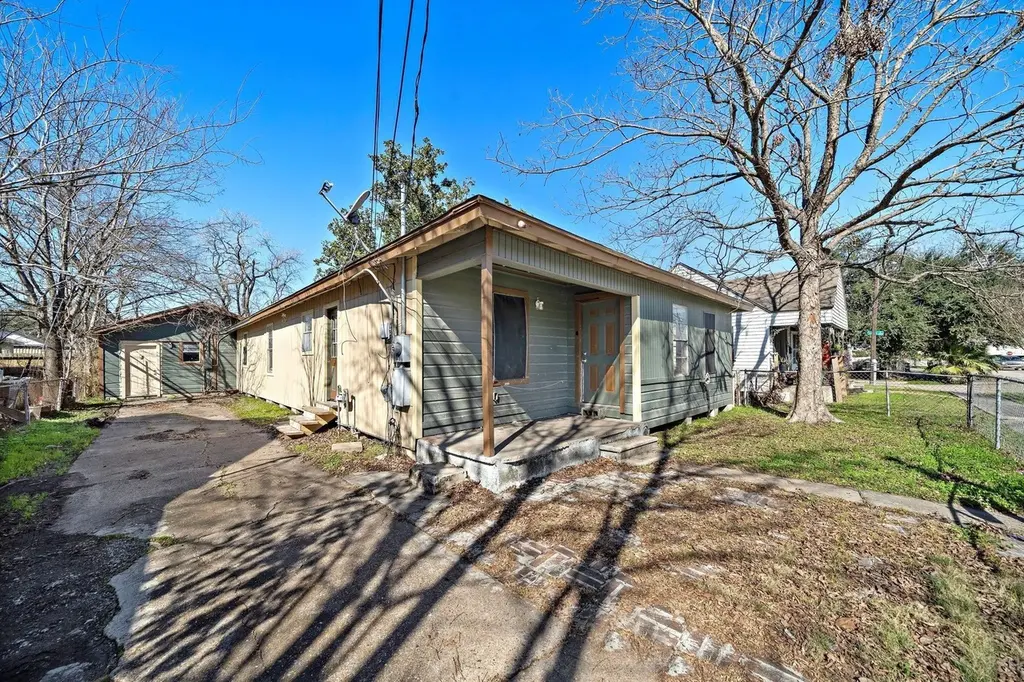
128 Kress St · Houston, TX
Flood risk 7/10 · Major
- FEMA flood zone
- X (unshaded)
- Chance of flooding over 30 yrs
- 0.96%
- Est. flood insurance / yr
- $507 – $1,088
Fire risk 1/10 · Minimal
- Est. fire insurance / yr
- $1,222 – $2,270
Heat risk 9/10 · Severe
- Hot days now (above 110°F)
- 7 days/yr
- Hot days in 30 yrs
- 22 days/yr
Wind risk 9/10 · Severe
- Chance of severe wind over 30 yrs
- 99.0%
Air-quality risk 3/10 · Minor
- Unhealthy air days now
- 2 days/yr
- Unhealthy air days in 30 yrs
- 3 days/yr
Risk factors via First Street. Map © Google.
Why this score? — see what drove the C- grade
The composite is a weighted blend of 9 inputs, each scored 0–100. Each bar is that input's sub-score; the figure is the points it added to the 100-point composite (weight × sub-score).
- Cash flow +19.4/30.0
- Appreciation +10.0/10.0
- DSCR +6.1/10.0
- 1% rule +5.2/10.0
- Livability +3.7/5.0
- Rent growth +3.6/5.0
- Schools +2.7/10.0
- Condition / age +2.5/5.0
- ARV discount +1.8/15.0
$249,999
🖨 Deal sheet 📄 Offer letter ✓ Due diligence
Listing remarks MLS
LOCATION! LOCATION! 3 Bedrooms* 1 Full Bathroom* With Studio At Back*! Dining Room Over Looking Kitchen & Living Room* Living Room Opens Up To Kitchen With Bar* Huge Primary Room With Ceiling Fan* Spacious Bathroom With Tub* Laundry Room Inside Home* Big Back Yard* EZ Access To I10, 610, 59, & 90! Won't Last Long! ¡UBICACIÓN! ¡UBICACIÓN! 3 habitaciones* 1 baño completo* ¡Con estudio en la parte trasera*! Comedor con vista a la cocina y sala de estar* La sala de estar se abre a la cocina con barra* Enorme sala principal con ventilador de techo* Amplio baño con bañera* Lavandería dentro de la casa* Gran patio trasero* ¡Fácil acceso a I10, 610, 59 y 90! ¡No durará mucho!
Key facts
- Big back yard
- 6,499 sq ft lot
- Built 1950
Tags
Neighborhood map
What this means for you Summary
Snapshot
- This is a 4-bed/1.0-bath single-family listed at $250k.
Deal economics
- At list price, monthly cash flow is $211 ($3k/yr) — positive.
- The deal already cash-flows at list — no discount required.
- Meets the 1% rule at list price ($3k rent vs $250k).
- Cap rate 7.6% vs local median 3.2% in Houston — top-decile yield for the area; either an underpriced asset or a hidden risk that comps aren't pricing in. Stress-test before assuming the spread holds.
Location & tenants
- Location reads 74/100 on livability (#184 in TX, #4,771 nationally) — a middle-class / working-renter tenant base. Strengths: amenities A+, cost of living A+, housing A+; Watch: schools D, crime F.
- Houston ISD (urban): math 27% / reading 35% proficiency, ranked #593 of 826 in TX (top 72%) — families likely to look elsewhere, expect single-tenant / working-renter base with shorter leases; 71% free/reduced lunch — lower-income household profile, screen leases tightly.
- Market conditions: Rents rising fast (+4.3%/yr); 337 active listings in the ZIP; 11 comparable units currently listed for rent nearby; rentals lingering (median 44d on market — plan ~5-8 weeks vacancy on turnover, expect pricing pressure); 55% of comp listings sitting > 30 days — soft ceiling on asking rent; 29,883 units permitted in Harris County in 2024 (8,621 in 5+ unit buildings).
- At $2,548/mo this rent would consume 61% of the median local household income ($50k/yr) (locally 969% of renters already pay >50% of income on rent) — very limited rent-growth headroom before tenants either downsize or default.
Forward outlook
- In year one you build about $27k of equity ($2k loan paydown + $25k appreciation (10.0% local appreciation)).
- Harris County population projected at +47% by 2050 — long-run rental-demand tailwind backs the buy-and-hold thesis.
- At projected returns (10.0% appreciation + 4.3% rent growth), your $70k cash investment doubles in ~3 years — after that, you're playing with house money.
- By year 2, paydown + projected appreciation supports a ~$43k cash-out refi (75% LTV) — recoverable capital for the next deal without selling this one.
Negotiation context
- Only 5 days on market — expect competitive offers; lowballing is unlikely to land.
- 10 sale attempts since 19y ago; this cycle's ask is 12720% above the opening price — seller raised mid-cycle; expect resistance to lowballs.
Risks & watch-outs
- Watch-outs: flood insurance adds $66/mo; built in 1950 — expect roof / HVAC / electrical / plumbing capex.
- Climate carrying-cost: major flood risk; severe wind risk, 99% chance of damaging wind over 30y; extreme-heat days projected 7→22/yr by 2055 (HVAC capex compounding) — expect insurance premiums to compound above CPI over the hold.
Questions for the listing agent
- Built in 1950 — when were the roof, HVAC, electrical panel, plumbing, and water heater last replaced?
- What's the actual annual flood-insurance premium (NFIP or private), and is the property in a SFHA with mandatory coverage?
- Is there a deadline driving the sale (1031 exchange, divorce, estate, relocation)? That informs how much negotiation room exists.
- Schools are D-rated, which usually means shorter tenancies and higher turnover. Who's the typical renter profile here, and what's been the actual vacancy rate?
- Crime grade is F in this area — have there been break-ins, vandalism, or insurance claims at this property in the last 3 years? What carrier currently insures it and at what premium?
- What's the average days-on-market for RENTAL listings here right now (not sales)? A rising rental-DOM trend means longer vacancies and softer asking-rent achievability than the comps imply.
- What's the recent tenant-quality profile in this submarket — average credit score on applications, eviction rate, late-payment / NSF rate, and stable-employment percentage? A property-management company in the area should have these aggregated.
- How much new for-sale + rental construction is in the pipeline within 1–3 miles? Heavy new supply typically softens prices + rents 12–24 months out; constrained supply supports both.
Investment metrics
- 1% rule
- 1.02% ✓
- Cap rate
- 7.62%
- Cash-on-cash
- 4.75%
- DSCR
- 1.21
- GRM
- 8.2
CMA / ARV
- ARV (median comp)
- $221,991
- List price
- $249,999
- Delta
- 12.62%
- Verdict
- OVERPRICED
- Comps
- 20 within 1.0 mi
Show comp detail 12 sales within ~0.75 mi
| Address | Dist | Beds/Ba | Sqft | Sold | Price | $/sf | Match |
|---|---|---|---|---|---|---|---|
| 5711 Sudan St | 0.38mi | 4/2.5 | 1,945 (+2%) | 10mo | $374,990 | $193 | 65 |
| 2501 Sakowitz St | 0.38mi | 4/2.5 | 1,945 (+2%) | 12mo | $384,900 | $198 | 64 |
| 6324 Texarkana St | 0.16mi | 4/2.0 | 1,705 (-11%) | 9mo | $190,000 | $111 | 63 |
| 5620 Lucille St | 0.41mi | 4/3.0 | 1,836 (-4%) | 6mo | $99,000 | $54 | 61 |
| 506 Hoffman St | 0.47mi | 3/2.0 (-1) | 1,884 (-2%) | 13mo | $335,000 | $178 | 56 |
| 6020 Hillsboro | 0.44mi | 3/2.5 (-1) | 1,843 (-4%) | 13mo | $349,900 | $190 | 51 |
| 5615 Perkins St Unit A | 0.60mi | 3/3.5 (-1) | 1,915 (-0%) | 9mo | $320,000 | $167 | 49 |
| 6416 Eagle Pass St | 0.22mi | 3/2.0 (-1) | 1,660 (-13%) | 12mo | $225,000 | $136 | 49 |
| 5408 Mulvey St | 0.67mi | 3/2.5 (-1) | 2,000 (+4%) | 5mo | $348,900 | $174 | 47 |
| 1913 Sakowitz St | 0.62mi | 3/2.5 (-1) | 1,858 (-3%) | 12mo | $375,890 | $202 | 45 |
| 2012 Chew St | 0.60mi | 3/3.5 (-1) | 2,016 (+5%) | 9mo | $350,000 | $174 | 40 |
| 2009 Harlem St | 0.71mi | 3/2.5 (-1) | 2,081 (+9%) | 11mo | $309,900 | $149 | 33 |
Match score weights: distance 35% · size 25% · config 20% · recency 20%. Top-matched comps best support the ARV.
Projected returns pro-forma
10.0% appreciation · 4.27% rent growth · sell at horizon
- IRR
- 27.4%
- Equity multiple
- 3.19×
- Total profit
- $152,969
- Equity at exit
- $225,219
- IRR
- 24.3%
- Equity multiple
- 7.39×
- Total profit
- $447,117
- Equity at exit
- $485,693
Cash invested: $70,000 (down + closing). Projections, not guarantees.
Landlord ↔ Tenant lean methodology
- Overall (STATE)
- 87 Strongly Landlord-Friendly
- State Texas
- 87 Strongly Landlord-Friendly · R+5
- County
- — inherits STATE
- City
- — inherits STATE
ZIP-level market 77020
- Home prices YoY
- 29.1%
- Rents YoY
- 4.3%
- Active inventory
- 337
- Price-to-rent
- 8.2×
Monthly cashflow live
- Estimated rent
- $2,548 high interval (Pro) →
- Mortgage (P&I)
- −$1,311
- Tax from tax record
- −$320 /mo · $3,841/yr
- Insurance
- −$104
- Flood insurance flood zone
- −$66 /mo · $798/yr
- HOA
- −$0
- Vacancy / Maint / Mgmt
- −$535
- Net cashflow
- $211
Break-even live
UW: 25.0% down · 7.5% · 30yr · 1.5% tax · 5.0% vac · 8.0% maint · 8.0% mgmt
Financing live
Cash to close
- Down payment
- $62,500
- Closing costs
- $7,500
- Reserves months
- —
- Total cash needed
- —
Loan-product check · same deal, 3 products live
Conventional
25% down · 7.5% · 30yr
- Down + closing
- —
- Monthly P&I
- —
- Monthly cashflow
- —
- DSCR
- —
- Eligible?
- —
Personal DTI + credit; lowest rate.
DSCR
20% down · 8.5% · 30yr
- Down + closing
- —
- Monthly P&I
- —
- Monthly cashflow
- —
- DSCR
- —
- Eligible?
- —
No personal income docs; deal must DSCR.
Hard money
10% down · 12.0% · 12mo
- Down + closing
- —
- Monthly P&I
- —
- Monthly cashflow
- —
- DSCR
- —
- Eligible?
- —
Short-term bridge; refi at stabilization.
Rent comps 11 comps
| Address | Beds | Baths | Sqft | Rent | $/sqft | DOM | Units | Dist |
|---|---|---|---|---|---|---|---|---|
| 5605 Mulvey St Unit 1019610P Houston, TX | 3.0 | 2.5 | 1410 | $4,237 | $3.00 | 3d | 1 | 0.55mi |
| 2105 Sam Wilson St Houston, TX | 3.0 | 2.5 | 1416 | $6,750 | $4.77 | 44d | 1 | 0.55mi |
| 5217 Noble St Houston, TX | 3.0 | 2.5 | 1897 | $2,750 | $1.45 | 44d | 1 | 0.69mi |
| 3503 Wyrick St Houston, TX | 3.0 | 2.5 | 1746 | $2,850 | $1.63 | 44d | 1 | 0.80mi |
| 4712 Rawley St Unit a Houston, TX | 3.0 | 2.0 | 1501 | $2,070 | $1.38 | 21d | 1 | 0.99mi |
| 4712 Rawley St Unit B Houston, TX | 3.0 | 2.5 | 1501 | $2,045 | $1.36 | 21d | 1 | 0.99mi |
| 4509 Courtney St Houston, TX | 4.0 | 1.0 | 1456 | $1,150 | $0.79 | 22d | 1 | 0.99mi |
| 4706 Hershe St Houston, TX | 3.0 | 2.5 | 2283 | $3,300 | $1.45 | 44d | 1 | 1.05mi |
| 1023 Hahlo St Houston, TX | 4.0 | 2.0 | 1434 | $1,775 | $1.24 | 5d | 1 | 1.09mi |
| 4300 Lyons Ave Unit 304 Houston, TX | 4.0 | 2.0 | 1393 | $1,460 | $1.05 | 44d | 1 | 1.34mi |
| 1222 Upton St Houston, TX | 3.0 | 4.0 | 2055 | $2,600 | $1.27 | 44d | 1 | 1.38mi |
Listing history 37 events
-
2026-06-18days on market $249,999 Active 5 DOM
-
2026-06-17days on market $249,999 Active 4 DOM
-
2026-06-16days on market $249,999 Active 3 DOM
-
2026-06-15days on market $249,999 Active 2 DOM
-
2026-06-13days on market $249,999 Active 1 DOM
-
2026-06-10days on market $249,999 Active 92 DOM
-
2026-06-08days on market $249,999 Active 91 DOM
-
2026-06-07days on market $249,999 Active 90 DOM
-
2026-06-04days on market $249,999 Active 87 DOM
-
2026-06-01days on market $249,999 Active 84 DOM
-
2026-05-31days on market $249,999 Active 83 DOM
-
2026-03-10$1,950
-
2026-03-09historical $1,950
Show marketing remark (770 chars)
LOCATION! LOCATION! 3 Bedrooms* 1 Full Bathroom* With Studio At Back*! Dining Room Over Looking Kitchen & Living Room* Living Room Opens Up To Kitchen With Bar* Huge Primary Room With Ceiling Fan* Spacious Bathroom With Tub* Laundry Room Inside Home* Big Back Yard* EZ Access To I10, 610, 59, & 90! Won't Last Long! ¡UBICACIÓN! ¡UBICACIÓN! 3 habitaciones* 1 baño completo* ¡Con estudio en la parte trasera*! Comedor con vista a la cocina y sala de estar* La sala de estar se abre a la cocina con barra* Enorme sala principal con ventilador de techo* Amplio baño con bañera* Lavandería dentro de la casa* Gran patio trasero* ¡Fácil acceso a I10, 610, 59 y 90! ¡No durará mucho!
-
2026-03-09$249,999 Active 770-char remark
Show marketing remark (770 chars)
LOCATION! LOCATION! 3 Bedrooms* 1 Full Bathroom* With Studio At Back*! Dining Room Over Looking Kitchen & Living Room* Living Room Opens Up To Kitchen With Bar* Huge Primary Room With Ceiling Fan* Spacious Bathroom With Tub* Laundry Room Inside Home* Big Back Yard* EZ Access To I10, 610, 59, & 90! Won't Last Long! ¡UBICACIÓN! ¡UBICACIÓN! 3 habitaciones* 1 baño completo* ¡Con estudio en la parte trasera*! Comedor con vista a la cocina y sala de estar* La sala de estar se abre a la cocina con barra* Enorme sala principal con ventilador de techo* Amplio baño con bañera* Lavandería dentro de la casa* Gran patio trasero* ¡Fácil acceso a I10, 610, 59 y 90! ¡No durará mucho!
-
2026-03-08historical
-
2026-02-21price $1,950
-
2025-12-01$2,100
-
2025-09-18status Active
-
2025-08-25status Pending
-
2025-04-11price $249,999
-
2025-01-27$260,000 Active
-
2013-12-19soldstatus Sold
-
2013-11-26status Pending, Continue to Show
-
2013-11-18$57,000 Active
-
2012-11-28historical
-
2012-08-27$92,000
-
2011-03-15soldstatus
-
2011-03-11soldstatus
-
2011-02-15historical
-
2010-10-05$84,500
-
2010-05-08historical
-
2009-11-07$94,900
-
2007-08-16historical
-
2007-02-07$61,900
-
2004-09-08soldstatus
-
2004-02-12soldstatus
-
1988-01-02soldstatus
ⓘ Source: listings_history table (triggers on properties + properties_extension) + one-shot
backfill from property_details.listing_events for pre-trigger history.
Tax reassessment forecast TX · Resets to sale price
- Current annual tax
- $3,841 · $320/mo
- Projected year-2 tax
- $4,575 · $381/mo
- Expected delta
- +$734/yr (+$61/mo · 19.1%)
ⓘ Screening estimate from a state-policy table — verify with the county assessor before closing.
Climate risk First Street
- Flood 7/10 Severe FEMA zone X (unshaded) · 96% chance over 30 yrs
- Wildfire 1/10 Low
- Heat 9/10 Extreme 7 d/yr ≥110°F today · 22 d/yr by 30 yrs out
- Wind 9/10 Extreme 99% chance of damaging wind over 30 yrs
- Air quality 3/10 Moderate 2 unhealthy d/yr today · 3 by 30 yrs out
Nearby sold comps map
Loading sold comps map…
Walkable amenities ~0.75 mi
Loading nearby amenities…
Taxation est. · year 1
- Rental income
- $30,572
- − Mortgage interest
- −$14,004
- − Property taxes
- −$3,841
- − Insurance
- −$2,047
- − Repairs & maintenance
- −$2,446
- − Management
- −$2,446
- − Depreciation
- −$7,273
- Taxable loss
- −$1,485
- Est. tax savings @ 24.0%
- +$356
- After-tax cash flow
- $2,887/yr
For passive investors: Depreciation is non-cash, so a rental often shows a tax loss while cash-flowing — sheltering income. Rental losses are passive: they offset passive income freely, and up to $25,000/yr can offset ordinary (W-2) income if you actively participate and your MAGI is under $100k (phasing out to $0 by $150k); unused losses carry forward. On sale, claimed depreciation is recaptured at up to 25%, and gains may owe capital-gains tax (a 1031 exchange can defer both). Figures are a year-1 estimate at your 24.0% rate — not tax advice; consult a CPA.
Schools (NCES district)
- District
- Houston ISD
- NCES district ID
- 4823640
- Math proficiency
- 27% ▼ -18.00%
- Reading proficiency
- 35% ▼ -6.00%
- Median HH income
- $46,054
- Composite
- 26.63/100
- National rank
- #7173
- State rank
- #593 of 826 in TX
Livability — Houston
- Score
- 74/100
- State rank
- #184
- US rank
- #4771
Category grades
Schools grade is shown separately in the Schools card above.
Census & demographics
- Census place
- Houston, TX
- County
- Harris County · 4,702,590 people
- City population
- 3,226,434
- Metro
- Houston-The Woodlands-Sugar Land, TX
- Population (ZIP)
- 23,686
- Household income
- $50,119
- Rent vs Own
- Severe rent burden
- 969.0
Population outlook (Harris County) Hauer SSP2
- Today (2025)
- 5,571,493 people
- By 2030
- 6,089,821 · +9.3%
- By 2040
- 7,142,806 · +28.2%
- By 2050
- 8,185,864 · +46.9%
- By 2075
- 10,574,329 · +89.8%
- By 2100
- 12,109,958 · +117.4%
Race, ethnicity, and origin ACS 2023
- Neighborhood character
- Predominantly Hispanic (69%)
- Race & ethnicity
- Hispanic / Latino 69% Black 24% Two or more races 22% White 5% Asian 1%
- Hispanic origin (detail)
- Mexican 60%
- Common ancestry
- Swiss 1%
- Foreign-born
- 23% · Canada
- Languages at home
- 39% English-only · Spanish 59% Other Indo-European 1%
Political lean MEDSL · Harris
- 2024 margin
- Lean D (+5.5) · D 52.0% · R 46.4% · Other 1.6%
- 2008→2024 swing
- +3.9pp toward D · 2008: 1.6pp · 2024: 5.5pp
- All cycles
- 2024: D+5.5 2020: D+13.3 2016: D+12.4 2012: D+0.1 2008: D+1.6
Not yet ingested
- Civics
- —
Market trends
- HPI YoY
- ▲ 55.64%
- Current HPI
- 246.5578
- Rent YoY
- ▲ 4.27%
- Metro
- Houston-The Woodlands-Sugar Land, TX
- State GDP YoY
- ▲ 3.95%
- F500 in state
- 110
Industry mix (Fortune 500 HQ in TX)
| Industry | F500 HQs | Revenue |
|---|---|---|
| Energy | 16 | $1,198B |
|
||
| Technology | 5 | $198B |
|
||
| Engineering / Construction | 4 | $72B |
|
||
| Energy Services | 3 | $60B |
|
||
| Utilities | 3 | $41B |
|
||
| Healthcare | 2 | $330B |
|
||
Price history
-96.8% since first listed26 events — show timeline
- 2026-03-10 Listed for Rent $1,950 HARMLS
- 2026-03-09 Rental Removed $1,950 HARMLS
- 2026-03-09 Listed $249,999 HARMLS
- 2026-03-08 Listing Removed — HARMLS
- 2026-02-21 Price Changed $1,950 HARMLS
- 2025-12-01 Listed for Rent $2,100 HARMLS
- 2025-09-18 Relisted — HARMLS
- 2025-08-25 Pending — HARMLS
- 2025-04-11 Price Changed $249,999 HARMLS
- 2025-01-27 Listed $260,000 HARMLS
- 2013-12-19 Sold (MLS) — HARMLS
- 2013-11-26 Pending — HARMLS
- 2013-11-18 Listed $57,000 HARMLS
- 2012-11-28 Listing Removed — HARMLS
- 2012-08-27 Listed $92,000 HARMLS
- 2011-03-15 Sold (Public Records) — Public Records
- 2011-03-11 Sold (MLS) — HARMLS
- 2011-02-15 Listing Removed — HARMLS
- 2010-10-05 Listed $84,500 HARMLS
- 2010-05-08 Listing Removed — HARMLS
- 2009-11-07 Listed $94,900 HARMLS
- 2007-08-16 Listing Removed — HARMLS
- 2007-02-07 Listed $61,900 HARMLS
- 2004-09-08 Sold (Public Records) — Public Records
- 2004-02-12 Sold (Public Records) — Public Records
- 1988-01-02 Sold (Public Records) — Public Records
Property tax history
+5.1%/yrLatest (2025): $3,841 · +1.6% YoY. Source: county tax records.
Cash-flow waterfall
monthlySold comps — $/sqft
last 12 mo · ≤1 miLoading sold comps…