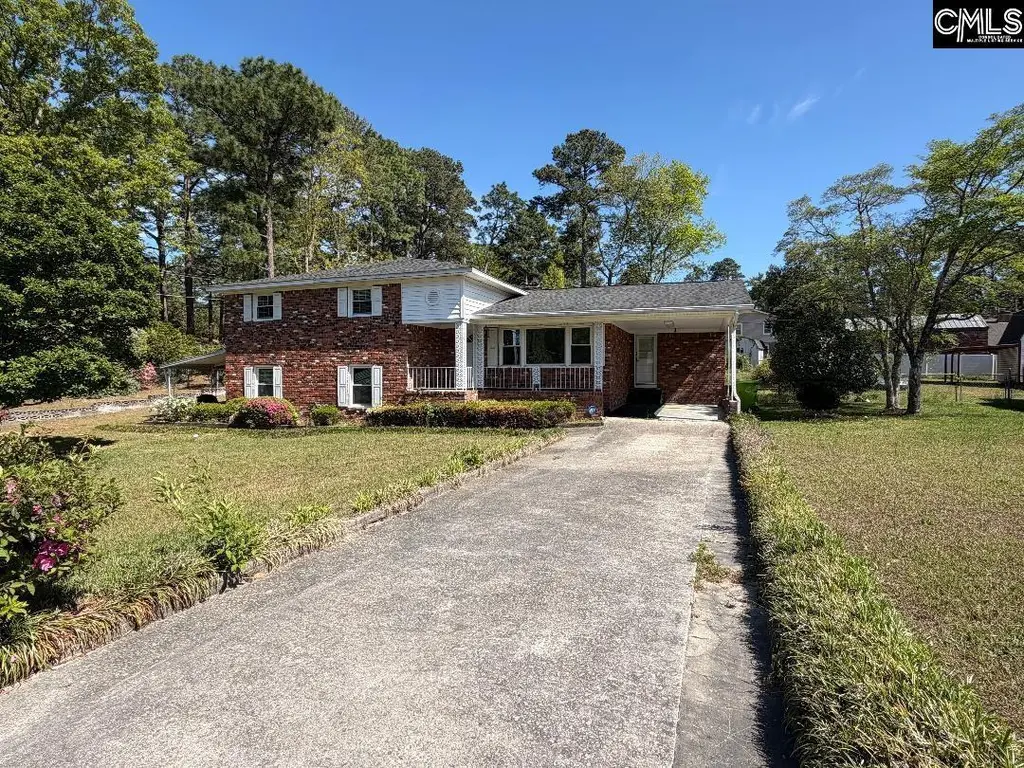
1960 Drexel Lk · Woodfield, SC
Flood risk 1/10 · Minimal
- FEMA flood zone
- X
- Chance of flooding over 30 yrs
- 0.0%
- Est. flood insurance / yr
- $435 – $905
Fire risk 2/10 · Minimal
- Est. fire insurance / yr
- $783 – $1,453
Heat risk 6/10 · Moderate
- Hot days now (above threshold)
- 7 days/yr
- Hot days in 30 yrs
- 16 days/yr
Wind risk No data
- Chance of severe wind over 30 yrs
- —
Air-quality risk No data
- Unhealthy air days now
- —
- Unhealthy air days in 30 yrs
- —
Risk factors via First Street. Map © Google.
Why this score? — see what drove the D grade
The composite is a weighted blend of 9 inputs, each scored 0–100. Each bar is that input's sub-score; the figure is the points it added to the 100-point composite (weight × sub-score).
- Cash flow +12.7/30.0
- ARV discount +7.5/15.0
- Appreciation +5.0/10.0
- DSCR +3.8/10.0
- Schools +3.6/10.0
- Livability +3.2/5.0
- 1% rule +2.6/10.0
- Rent growth +2.5/5.0
- Condition / age +2.5/5.0
$260,000
🖨 Deal sheet (PDF) 📄 Offer letter ✓ Due diligence
Listing remarks
Spacious 4 bedroom, 3-bath tri-level home offering incredible potential for investors or buyers looking to customize their dream property. This home features a versatile floor plan with multiple living areas, generously sized bedrooms, and ample storage throughout. While the property does require updates and repairs, it presents a fantastic opportunity to add value and build equity. Ideal for renovation or rental investment, this home has solid bones and a layout that lends itself well to modern improvements. Situated on a desirable lot, the property offers plenty of outdoor space for entertaining, landscaping, or future enhancements. Conveniently located near shopping, dining, and major ro
Key facts
- 0.5 acre lot
- Garage
- Built 1962
Property features AI
Finance
- Other: Directions: From I-77 take Exit 76 to Alpine Rd. Turn right onto Faraway Rd. Turn left onto Larchmont Dr. Turn left onto Cheltenham Lane. Turn right onto Drexel Lake Dr. House is the first one on the left
- HOA & community: Property is part of an association
Exterior
- Parking: Attached carport; One garage/carport space
- Utilities: Public water; Public sewer
- Home design: Single-family property (detached)
- Construction: Crawlspace foundation
- Exterior features: Brick exterior above foundation; Paved road access; Half-acre lot
Interior
- Bedrooms: Master bedroom located on the lower level
- Bathrooms: Two full bathrooms; One additional full bathroom on the lower level; One half bathroom
- Heating & cooling: Central heating; Central air conditioning
- Interior features: One fireplace; Lower-level master bedroom
Neighborhood map
What this means for you Summary
Snapshot
- This is a 4-bed/3.0-bath single-family listed at $260k.
Deal economics
- At list price, monthly cash flow is $-27 ($-325/yr) — negative.
- To cash-flow at today's rent, offer at most $255k (1.8% below list).
- To meet the 1% rule (rent ≥ 1% of price), the offer needs to be $198k (23.8% below list).
- Recommended offer: $198k (23.8% below list) — sets the bar for 1% rule.
Location & tenants
- Location reads 63/100 on livability (#165 in SC) — a middle-class / working-renter tenant base. Strengths: cost of living A+, housing A+; Watch: employment D+, crime D-, amenities F.
- Richland 02 (suburban): math 35% / reading 47% proficiency, ranked #29 of 80 in SC (top 36%) — families likely to look elsewhere, expect single-tenant / working-renter base with shorter leases.
- Zoned schools: Windsor Elementary (math 21% / reading 23%, grade F, #475 of 597 statewide, top 81%, 537 students, 100% FRL); Richland Northeast High (math 42% / reading 82%, grade B-, #99 of 196 statewide, top 53%, 1,359 students, 70% FRL) — zoned schools average 85% FRL vs 38% district-wide (47 pts higher); higher-poverty schools than district average — tighter screening recommended.
- Market conditions: 1 active listings in the ZIP; 1 comparable units currently listed for rent nearby; 3,472 units permitted in Richland County in 2024 (1,096 in 5+ unit buildings).
Forward outlook
- In year one you build about $10k of equity ($2k loan paydown + $8k appreciation (3.0% local appreciation)).
- Richland County population projected at +30% by 2050 — long-run rental-demand tailwind backs the buy-and-hold thesis.
- At projected returns (3.0% appreciation + 3.0% rent growth), your $73k cash investment doubles in ~7 years — after that, you're playing with house money.
- By year 4, paydown + projected appreciation supports a ~$33k cash-out refi (75% LTV) — recoverable capital for the next deal without selling this one.
Negotiation context
- It's been on market 73 days — a 6% lower offer ($244k) is reasonable based on typical stale-listing flexibility.
- Current owner paid $71k; list at $260k implies a 266% gain — meaningful room to come down on a strong offer.
Risks & watch-outs
- Climate carrying-cost: extreme-heat days projected 7→16/yr by 2055 (HVAC capex compounding) — expect insurance premiums to compound above CPI over the hold.
Questions for the listing agent
- What do current leases actually rent for vs. the listed asking? Can we see a recent rent roll and the last 12 months of T-12 income?
- It's been on market 73 days. Have you received any prior offers? Is the seller open to a 24% concession, seller financing, or rate buy-down credit?
- Built in 1962 — when were the roof, HVAC, electrical panel, plumbing, and water heater last replaced?
- What does the HOA fee cover, when was the last increase, and are there any pending special assessments or reserve-fund shortfalls?
- Why hasn't it sold? Are there any deal-killer items the seller is aware of (foundation, flood, title, zoning, code violations)?
- Is there a deadline driving the sale (1031 exchange, divorce, estate, relocation)? That informs how much negotiation room exists.
- Schools are D-rated, which usually means shorter tenancies and higher turnover. Who's the typical renter profile here, and what's been the actual vacancy rate?
- Crime grade is D in this area — have there been break-ins, vandalism, or insurance claims at this property in the last 3 years? What carrier currently insures it and at what premium?
- The area grade is low — what's the realistic commute time and amenity access for the typical tenant pool here? Any planned neighborhood developments (good or bad) we should know about?
- What's the average days-on-market for RENTAL listings here right now (not sales)? A rising rental-DOM trend means longer vacancies and softer asking-rent achievability than the comps imply.
- What's the recent tenant-quality profile in this submarket — average credit score on applications, eviction rate, late-payment / NSF rate, and stable-employment percentage? A property-management company in the area should have these aggregated.
- How much new for-sale + rental construction is in the pipeline within 1–3 miles? Heavy new supply typically softens prices + rents 12–24 months out; constrained supply supports both.
Investment metrics
- 1% rule
- 0.76% ✗
- Cap rate
- 6.17%
- Cash-on-cash
- -0.45%
- DSCR
- 0.98
- GRM
- 10.9
CMA / ARV
- ARV (on-the-fly)
- $259,816
- Comps found
- 1
Show comp detail 1 sale within ~0.75 mi
| Address | Dist | Beds/Ba | Sqft | Sold | Price | $/sf | Match |
|---|---|---|---|---|---|---|---|
| 1915 Cheltenham Ln | 0.23mi | 4/2.5 | 2,804 (+1%) | 5mo | $262,500 | $94 | 81 |
Match score weights: distance 35% · size 25% · config 20% · recency 20%. Top-matched comps best support the ARV.
Projected returns pro-forma
3.0% appreciation · 3.0% rent growth · sell at horizon
- IRR
- 7.1%
- Equity multiple
- 1.41×
- Total profit
- $29,501
- Equity at exit
- $116,907
- IRR
- 9.8%
- Equity multiple
- 2.47×
- Total profit
- $107,346
- Equity at exit
- $180,168
Cash invested: $72,800 (down + closing). Projections, not guarantees.
Landlord ↔ Tenant lean methodology
- Overall (STATE)
- 90 Strongly Landlord-Friendly
- State South Carolina
- 90 Strongly Landlord-Friendly · R+6
- County
- — inherits STATE
- City
- — inherits STATE
ZIP-level market 29223-3922
- Active inventory
- 1
- Price-to-rent
- 10.9×
Monthly cashflow live
- Estimated rent
- $1,981 medium interval (Pro) →
- Mortgage (P&I)
- −$1,363
- Tax from tax record
- −$116 /mo · $1,395/yr
- Insurance
- −$108
- HOA
- −$4
- Vacancy / Maint / Mgmt
- −$416
- Net cashflow
- $-27
Break-even live
Sensitivity live
| Price | -10% $120 | -5% $47 | +0% $-27 | +5% $-101 | +10% $-174 |
|---|---|---|---|---|---|
| Rent | -10% $-184 | -5% $-105 | +0% $-27 | +5% $51 | +10% $129 |
| Rate | -1.0pp $104 | -0.5pp $39 | base $-27 | +0.5pp $-94 | +1.0pp $-163 |
UW: 25.0% down · 7.5% · 30yr · 1.5% tax · 5.0% vac · 8.0% maint · 8.0% mgmt
Financing live
Cash to close
- Down payment
- $65,000
- Closing costs
- $7,800
- Reserves months
- —
- Total cash needed
- —
Loan-product check · same deal, 3 products live
Conventional
25% down · 7.5% · 30yr
- Down + closing
- —
- Monthly P&I
- —
- Monthly cashflow
- —
- DSCR
- —
- Eligible?
- —
Personal DTI + credit; lowest rate.
DSCR
20% down · 8.5% · 30yr
- Down + closing
- —
- Monthly P&I
- —
- Monthly cashflow
- —
- DSCR
- —
- Eligible?
- —
No personal income docs; deal must DSCR.
Hard money
10% down · 12.0% · 12mo
- Down + closing
- —
- Monthly P&I
- —
- Monthly cashflow
- —
- DSCR
- —
- Eligible?
- —
Short-term bridge; refi at stabilization.
Rent comps 1 comps
| Address | Beds | Baths | Sqft | Rent | $/sqft | DOM | Units | Dist |
|---|---|---|---|---|---|---|---|---|
| 117 Greenfield Rd Columbia, SC | 3.0 | 2.0 | 2055 | $1,981 | $0.96 | 25d | 1 | 1.38mi |
HOA detail
- Monthly dues
- $4 · $48/yr
- Likely covers
- landscaping
Listing history 19 events
-
2026-06-22days on market $260,000 Active 73 DOM
-
2026-06-18days on market $260,000 Active 70 DOM
-
2026-06-17days on market $260,000 Active 69 DOM
-
2026-06-16days on market $260,000 Active 68 DOM
-
2026-06-15days on market $260,000 Active 67 DOM
-
2026-06-14days on market $260,000 Active 65 DOM
-
2026-06-13days on market $260,000 Active 64 DOM
-
2026-06-10days on market $260,000 Active 62 DOM
-
2026-06-09days on market $260,000 Active 61 DOM
-
2026-06-08days on market $260,000 Active 60 DOM
-
2026-06-07days on market $260,000 Active 59 DOM
-
2026-06-05days on market $260,000 Active 56 DOM
-
2026-06-03days on market $260,000 Active 55 DOM
-
2026-06-03days on market $260,000 Active 54 DOM
-
2026-06-01days on market $260,000 Active 53 DOM
-
2026-05-31days on market $260,000 Active 52 DOM
-
2026-04-29price $260,000
-
2026-04-09$275,000 Active
-
1982-06-01soldstatus $71,000
ⓘ Source: listings_history table (triggers on properties + properties_extension) + one-shot
backfill from property_details.listing_events for pre-trigger history.
Tax reassessment forecast SC · Resets to sale price
- Current annual tax
- $1,395 · $116/mo
- Projected year-2 tax
- $1,482 · $124/mo
- Expected delta
- +$87/yr (+$7/mo · 6.2%)
ⓘ Screening estimate from a state-policy table — verify with the county assessor before closing.
Climate risk First Street
- Flood 1/10 Low FEMA zone X · 0% chance over 30 yrs
- Wildfire 2/10 Low
- Heat 6/10 Major
Nearby sold comps map
Loading sold comps map…
Walkable amenities ~0.75 mi
Loading nearby amenities…
Taxation est. · year 1
- Rental income
- $23,772
- − Mortgage interest
- −$14,564
- − Property taxes
- −$1,395
- − Insurance
- −$1,300
- − Repairs & maintenance
- −$1,902
- − Management
- −$1,902
- − HOA
- −$48
- − Depreciation
- −$7,564
- Taxable loss
- −$4,902
- Est. tax savings @ 24.0%
- +$1,177
- After-tax cash flow
- $852/yr
For passive investors: Depreciation is non-cash, so a rental often shows a tax loss while cash-flowing — sheltering income. Rental losses are passive: they offset passive income freely, and up to $25,000/yr can offset ordinary (W-2) income if you actively participate and your MAGI is under $100k (phasing out to $0 by $150k); unused losses carry forward. On sale, claimed depreciation is recaptured at up to 25%, and gains may owe capital-gains tax (a 1031 exchange can defer both). Figures are a year-1 estimate at your 24.0% rate — not tax advice; consult a CPA.
Schools (NCES district)
- District
- Richland 02
- NCES district ID
- 4503390
- Math proficiency
- 35% ▼ -15.00%
- Reading proficiency
- 47% ▼ -5.00%
- Median HH income
- $59,684
- Composite
- 36.2/100
- National rank
- #4730
- State rank
- #29 of 80 in SC
Livability — Woodfield
- Score
- 63/100
- State rank
- #165
- US rank
- #15019
Category grades
Schools grade is shown separately in the Schools card above.
Census & demographics
- Census place
- Woodfield, SC
Population outlook (Richland County) Hauer SSP2
- Today (2025)
- 459,667 people
- By 2030
- 487,524 · +6.1%
- By 2040
- 542,035 · +17.9%
- By 2050
- 595,371 · +29.5%
- By 2075
- 732,998 · +59.5%
- By 2100
- 820,415 · +78.5%
Not yet ingested
- Political lean
- —
- Race & ethnicity
- —
- Common origin
- —
- Civics
- —
Market trends
- HPI YoY
- —
- Current HPI
- —
- Rent YoY
- —
- Metro
- —
- State GDP YoY
- ▲ 4.51%
- F500 in state
- 2
Industry mix (Fortune 500 HQ in SC)
| Industry | F500 HQs | Revenue |
|---|---|---|
| Packaging | 1 | $7B |
|
||
Price history
+266.2% since first listed3 events — show timeline
- 2026-04-29 Price Changed $260,000 Consolidated MLS
- 2026-04-09 Listed $275,000 Consolidated MLS
- 1982-06-01 Sold (Public Records) $71,000 Public Records
Property tax history
+2.5%/yrLatest (2025): $1,395 · +2.9% YoY. Source: county tax records.
Cash-flow waterfall
monthlySold comps — $/sqft
last 12 mo · ≤1 miLoading sold comps…