 Duplex
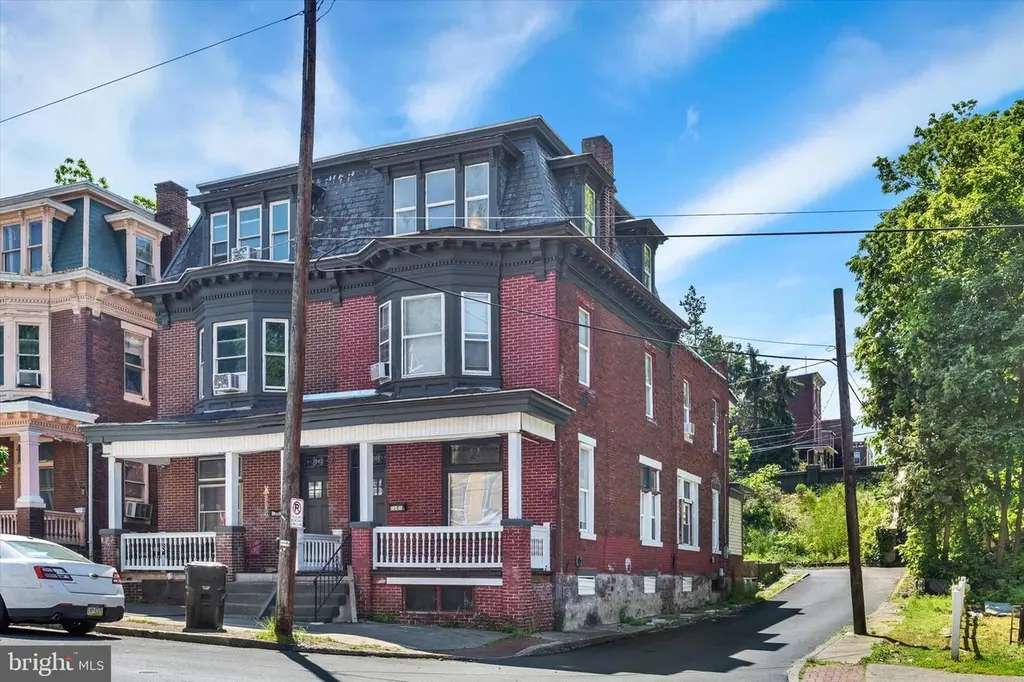
1201-1203 Market St · Harrisburg, PA
Flood risk 9/10 · Severe
- FEMA flood zone
- X (unshaded)
- Chance of flooding over 30 yrs
- 0.99%
- Est. flood insurance / yr
- $473 – $860
Fire risk 1/10 · Minimal
- Est. fire insurance / yr
- $511 – $949
Heat risk 5/10 · Moderate
- Hot days now (above 100°F)
- 7 days/yr
- Hot days in 30 yrs
- 15 days/yr
Wind risk 3/10 · Minor
- Chance of severe wind over 30 yrs
- 6.0%
Air-quality risk 2/10 · Minimal
- Unhealthy air days now
- 1 days/yr
- Unhealthy air days in 30 yrs
- 3 days/yr
Risk factors via First Street. Map © Google.
Why this score? — see what drove the C+ grade
The composite is a weighted blend of 9 inputs, each scored 0–100. Each bar is that input's sub-score; the figure is the points it added to the 100-point composite (weight × sub-score).
- Cash flow +26.3/30.0
- DSCR +8.9/10.0
- ARV discount +7.5/15.0
- 1% rule +7.1/10.0
- Rent growth +4.8/5.0
- Livability +4.2/5.0
- Condition / age +2.5/5.0
- Schools +0.8/10.0
- Appreciation +0.0/10.0
$330,000
🖨 Deal sheet 📄 Offer letter ✓ Due diligence
Multi-family units
County records classify this as Multi-Family (5+ Unit). Listing-text estimate: 2 units. estimate disagrees with records
5+ unit building — per-unit beds/baths from public records are typically unavailable; the breakdown below (if shown) is an estimate from the listing text.
Listing remarks MLS
IN EXCELLENT CONDITION. 5 BEDROOMS, ALL BRICK -FENCED IN YARD WITH PARKING IN REAR. NEWER ROOF! YWCA BEHIND THE PROPERTY. FRONT PORCH WITH AWNING. Both units offered in as is condition. $2,500 in closing cost help on full price.
Key facts
- Updated floorings
- Renovated
- Updated baths
Tags
Property features AI
Finance
- Financial info: Assessed improvement value listed; Assessed land value listed
Exterior
- Parking: Off-street parking
- Utilities: Public water; Public sewer; 110-volt electric service; Electric hot water
- Home design: Semi-detached property; Fee simple ownership; Two residential units
- Construction: Brick construction; Brick/mortar foundation; Composite and rubber roofing; Built year per assessor
- Exterior features: Front porch(es)
Interior
- Bedrooms: Unit 1; Unit 2
- Heating & cooling: Baseboard hot water heating (electric); Ceiling fan cooling
- Interior features: Full basement
Neighborhood map
What this means for you Summary
Snapshot
- This is a 2 × 5-bed/1-bath units multifamily listed at $330k.
Deal economics
- At list price, monthly cash flow is $794 ($10k/yr) — positive. Per door: $397/mo.
- The deal already cash-flows at list — no discount required.
- Meets the 1% rule at list price ($4k rent vs $330k).
- Recommended offer: $325k (1.5% below list) — sets the bar for market timing.
- Cap rate 9.4% vs local median 6.6% in Harrisburg — top-decile yield for the area; either an underpriced asset or a hidden risk that comps aren't pricing in. Stress-test before assuming the spread holds.
Location & tenants
- Location reads 84/100 on livability (#107 in PA, #826 nationally) — a professional / high-income tenant draw. Strengths: amenities A+, commute A+, cost of living A+; Watch: employment D, crime F.
- Harrisburg City SD (urban): math 6% / reading 13% proficiency, ranked #535 of 539 in PA (top 99%) — low school quality limits family demand, transient renter base, plan for 1-2y turnover; 82% free/reduced lunch — lower-income household profile, screen leases tightly.
- Zoned schools: Harrisburg Hs (math 24% / reading 10%, grade F, #399 of 437 statewide, top 92%, 1,230 students, 100% FRL) — zoned schools average 100% FRL vs 82% district-wide (18 pts higher); higher-poverty schools than district average — tighter screening recommended.
- Market conditions: Rents rising fast (+9.1%/yr); 66 active listings in the ZIP; 15 comparable units currently listed for rent nearby; rentals at typical pace (median 24d on market — plan ~3-4 weeks tenant-placement turnaround); lower-income renter base — watch delinquency; 540 units permitted in Dauphin County in 2024 (194 in 5+ unit buildings).
- At $3,990/mo this rent would consume 120% of the median local household income ($40k/yr) (locally 1014% of renters already pay >50% of income on rent) — very limited rent-growth headroom before tenants either downsize or default.
Forward outlook
- Local home prices are declining (-3.0%/yr); year-one equity from $2k of loan paydown is wiped out by about $10k of value loss. Plan a longer hold.
- At projected returns (-3.0% appreciation + 8.0% rent growth), your $92k cash investment doubles in ~8 years — after that, you're playing with house money.
Negotiation context
- It's been on market 17 days — a 2% lower offer ($325k) is reasonable based on typical stale-listing flexibility.
- 2 sale attempts since 24y ago with the ask held roughly flat each time — persistent listings suggest the price (not the market) is what's stuck; bring a comps-based counter.
- Current owner paid $85k; list at $330k implies a 288% gain — meaningful room to come down on a strong offer.
Risks & watch-outs
- Watch-outs: flood insurance adds $56/mo; built in 1915 — expect roof / HVAC / electrical / plumbing capex.
- Climate carrying-cost: severe flood risk; extreme-heat days projected 7→15/yr by 2055 (HVAC capex compounding) — expect insurance premiums to compound above CPI over the hold.
Questions for the listing agent
- Can we see the unit-by-unit rent roll, current vacancy, and any below-market leases? What's the average tenancy length?
- What capital expenditures (roof, boiler, parking lot, exteriors) have been made in the last 5 years, and what's planned in the next 2?
- Built in 1915 — when were the roof, HVAC, electrical panel, plumbing, and water heater last replaced?
- What's the actual annual flood-insurance premium (NFIP or private), and is the property in a SFHA with mandatory coverage?
- Is there a deadline driving the sale (1031 exchange, divorce, estate, relocation)? That informs how much negotiation room exists.
- Crime grade is F in this area — have there been break-ins, vandalism, or insurance claims at this property in the last 3 years? What carrier currently insures it and at what premium?
- What's the average days-on-market for RENTAL listings here right now (not sales)? A rising rental-DOM trend means longer vacancies and softer asking-rent achievability than the comps imply.
- What's the recent tenant-quality profile in this submarket — average credit score on applications, eviction rate, late-payment / NSF rate, and stable-employment percentage? A property-management company in the area should have these aggregated.
- How much new apartment / multifamily construction is in the pipeline within 1–3 miles? Heavy new supply (>2% of stock underway) typically softens rents 12–24 months out; light construction supports rent growth.
Investment metrics
- 1% rule
- 1.21% ✓
- Cap rate
- 9.38%
- Cash-on-cash
- 11.04%
- DSCR
- 1.49
- GRM
- 6.9
CMA / ARV
- ARV (on-the-fly)
- $193,596
- Comps found
- 12
Show comp detail 12 sales within ~0.75 mi
| Address | Dist | Beds/Ba | Sqft | Sold | Price | $/sf | Match |
|---|---|---|---|---|---|---|---|
| 1254 Derry St | 0.17mi | 5/— | 2,756 (+4%) | 2mo | $200,900 | $73 | 84 |
| 1252 Derry St | 0.17mi | 5/— | 2,800 (+6%) | 4mo | $200,900 | $72 | 79 |
| 60 Balm St | 0.14mi | 6/— (+1) | 2,890 (+9%) | 17mo | $175,000 | $61 | 59 |
| 1426 State St | 0.40mi | 5/— | 2,390 (-10%) | 8mo | $165,000 | $69 | 58 |
| 129 N 13th St | 0.24mi | 4/— (-1) | 2,322 (-12%) | 12mo | $158,000 | $68 | 53 |
| 109 Washington St | 0.67mi | 4/— (-1) | 2,548 (-4%) | 6mo | $439,000 | $172 | 52 |
| 1414 State St | 0.38mi | 5/— | 2,354 (-11%) | 15mo | $224,900 | $96 | 51 |
| 119 Locust St | 0.74mi | 4/— (-1) | 2,513 (-5%) | 8mo | $300,000 | $119 | 45 |
| 512 S 13th St | 0.52mi | 6/— (+1) | 2,280 (-14%) | 5mo | $130,000 | $57 | 43 |
| 1730 State St | 0.57mi | 4/— (-1) | 2,320 (-12%) | 10mo | $157,900 | $68 | 39 |
| 1508 Boas St | 0.65mi | 4/— (-1) | 2,970 (+12%) | 16mo | $250,000 | $84 | 32 |
| 1500-1506 Boas St | 0.64mi | 4/4.0 (-1) | 2,970 (+12%) | 18mo | $290,000 | $98 | 18 |
Match score weights: distance 35% · size 25% · config 20% · recency 20%. Top-matched comps best support the ARV.
Projected returns pro-forma
-3.0% appreciation · 8.0% rent growth · sell at horizon
- IRR
- 4.8%
- Equity multiple
- 1.20×
- Total profit
- $18,316
- Equity at exit
- $49,204
- IRR
- 18.6%
- Equity multiple
- 2.92×
- Total profit
- $177,509
- Equity at exit
- $28,532
Cash invested: $92,400 (down + closing). Projections, not guarantees.
Landlord ↔ Tenant lean methodology
- Overall (STATE)
- 62 Landlord-Friendly
- State Pennsylvania
- 62 Landlord-Friendly · EVEN
- County
- — inherits STATE
- City
- — inherits STATE
ZIP-level market 17103
- Rents YoY
- 9.1%
- Active inventory
- 66
- Price-to-rent
- 13.8×
Monthly cashflow live
- Estimated rent
- $3,990 high interval (Pro) →
- Mortgage (P&I)
- −$1,731
- Tax from tax record
- −$434 /mo · $5,209/yr
- Insurance
- −$138
- Flood insurance flood zone
- −$56 /mo · $666/yr
- HOA
- −$0
- Vacancy / Maint / Mgmt
- −$838
- Net cashflow
- $794
Break-even live
2-unit breakdown (identical units grouped — click to expand)
| Units | Beds | Baths | Est. rent |
|---|---|---|---|
| 2× units | 5 | 1 | $3,990 |
| #1 | 5 | 1 | $1,995 |
| #2 | 5 | 1 | $1,995 |
| Total (2 units) | $3,990 | ||
UW: 25.0% down · 7.5% · 30yr · 1.5% tax · 5.0% vac · 8.0% maint · 8.0% mgmt
Financing live
Cash to close
- Down payment
- $82,500
- Closing costs
- $9,900
- Reserves months
- —
- Total cash needed
- —
Loan-product check · same deal, 3 products live
Conventional
25% down · 7.5% · 30yr
- Down + closing
- —
- Monthly P&I
- —
- Monthly cashflow
- —
- DSCR
- —
- Eligible?
- —
Personal DTI + credit; lowest rate.
DSCR
20% down · 8.5% · 30yr
- Down + closing
- —
- Monthly P&I
- —
- Monthly cashflow
- —
- DSCR
- —
- Eligible?
- —
No personal income docs; deal must DSCR.
Hard money
10% down · 12.0% · 12mo
- Down + closing
- —
- Monthly P&I
- —
- Monthly cashflow
- —
- DSCR
- —
- Eligible?
- —
Short-term bridge; refi at stabilization.
Rent comps 15 comps
| Address | Beds | Baths | Sqft | Rent | $/sqft | DOM | Units | Dist |
|---|---|---|---|---|---|---|---|---|
| 227 Hummel St Harrisburg, PA | 5.0 | 2.0 | 2696 | $1,600 | $0.59 | 43d | 1 | 0.24mi |
| 14 S 17th St Harrisburg, PA | 5.0 | 2.0 | 2136 | $1,695 | $0.79 | 14d | 1 | 0.40mi |
| 66 N 17th St Harrisburg, PA | 5.0 | 2.0 | 1845 | $2,195 | $1.19 | 43d | 1 | 0.43mi |
| 301 Chestnut St Harrisburg, PA | 4.0 | 1.0–2.5 | 1437 | $3,000 | $2.09 | 14d | 10 | 0.50mi |
| 301 Chestnut St Harrisburg, PA | 1.0–4.0 | 1.0–2.5 | 1437 | $2,600 | $1.81 | 43d | 1 | 0.50mi |
| 111 N 17th St Harrisburg, PA | 5.0 | 1.0 | 1800 | $1,850 | $1.03 | 14d | 1 | 0.50mi |
| 1414 Berryhill St Harrisburg, PA | 5.0 | 2.0 | 1786 | $1,700 | $0.95 | 23d | 1 | 0.51mi |
| 1708 State St Harrisburg, PA | 5.0 | 1.5 | 2320 | $1,745 | $0.75 | 21d | 1 | 0.55mi |
| 1610 Hunter St Harrisburg, PA | 4.0 | 1.0 | 1776 | $1,450 | $0.82 | 23d | 1 | 0.56mi |
| 1330 Susquehanna St Harrisburg, PA | 4.0 | 1.5 | 2280 | $1,895 | $0.83 | 23d | 1 | 1.03mi |
| 2315 Magnolia Dr Harrisburg, PA | 4.0 | 3.5 | 3300 | $3,000 | $0.91 | 14d | 1 | 1.15mi |
| 1716 N 6th St Harrisburg, PA | 4.0 | 3.5 | 2400 | $2,200 | $0.92 | 43d | 1 | 1.16mi |
| 1716 N 6th St Unit NA Harrisburg, PA | 4.0 | 4.0 | 2400 | $2,000 | $0.83 | 23d | 1 | 1.16mi |
| 2368 Canby St Harrisburg, PA | 6.0 | 2.0 | 2142 | $2,300 | $1.07 | 21d | 1 | 1.38mi |
| 1834 Green St Harrisburg, PA | 4.0 | 1.0 | 1792 | $1,495 | $0.83 | 23d | 1 | 1.43mi |
Listing history 14 events
-
2026-06-09status $330,000 Pending 17 DOM
-
2026-06-08days on market $330,000 Active 17 DOM
-
2026-06-07days on market $330,000 Active 16 DOM
-
2026-06-03days on market $330,000 Active 12 DOM
-
2026-06-02days on market $330,000 Active 11 DOM
-
2026-06-01days on market $330,000 Active 10 DOM
-
2026-05-31days on market $330,000 Active 9 DOM
-
2026-05-31days on market $330,000 Active 8 DOM
-
2026-05-22$330,000 Active
-
2021-12-30soldstatus $85,000
-
2005-12-13soldstatus $72,000
-
2003-07-30soldstatus $40,000 228-char remark
Show marketing remark (228 chars)
IN EXCELLENT CONDITION. 5 BEDROOMS, ALL BRICK -FENCED IN YARD WITH PARKING IN REAR. NEWER ROOF! YWCA BEHIND THE PROPERTY. FRONT PORCH WITH AWNING. Both units offered in as is condition. $2,500 in closing cost help on full price.
-
2002-11-29$40,000 228-char remark
Show marketing remark (228 chars)
IN EXCELLENT CONDITION. 5 BEDROOMS, ALL BRICK -FENCED IN YARD WITH PARKING IN REAR. NEWER ROOF! YWCA BEHIND THE PROPERTY. FRONT PORCH WITH AWNING. Both units offered in as is condition. $2,500 in closing cost help on full price.
-
2002-11-29historical 228-char remark
Show marketing remark (228 chars)
IN EXCELLENT CONDITION. 5 BEDROOMS, ALL BRICK -FENCED IN YARD WITH PARKING IN REAR. NEWER ROOF! YWCA BEHIND THE PROPERTY. FRONT PORCH WITH AWNING. Both units offered in as is condition. $2,500 in closing cost help on full price.
ⓘ Source: listings_history table (triggers on properties + properties_extension) + one-shot
backfill from property_details.listing_events for pre-trigger history.
Tax reassessment forecast PA · Partial reset (capped growth)
- Current annual tax
- $5,209 · $434/mo
- Projected year-2 tax
- $5,212 · $434/mo
- Expected delta
- +$2/yr ($0/mo · 0.0%)
ⓘ Screening estimate from a state-policy table — verify with the county assessor before closing.
Climate risk First Street
- Flood 9/10 Extreme FEMA zone X (unshaded) · 99% chance over 30 yrs
- Wildfire 1/10 Low
- Heat 5/10 Major 7 d/yr ≥100°F today · 15 d/yr by 30 yrs out
- Wind 3/10 Moderate 6% chance of damaging wind over 30 yrs
- Air quality 2/10 Low 1 unhealthy d/yr today · 3 by 30 yrs out
Nearby sold comps map
Loading sold comps map…
Walkable amenities ~0.75 mi
Loading nearby amenities…
Taxation est. · year 1
- Rental income
- $47,880
- − Mortgage interest
- −$18,485
- − Property taxes
- −$5,209
- − Insurance
- −$2,316
- − Repairs & maintenance
- −$3,830
- − Management
- −$3,830
- − Depreciation
- −$9,600
- Taxable income
- $4,608
- Est. tax owed @ 24.0%
- −$1,106
- After-tax cash flow
- $8,427/yr
For passive investors: Depreciation is non-cash, so a rental often shows a tax loss while cash-flowing — sheltering income. Rental losses are passive: they offset passive income freely, and up to $25,000/yr can offset ordinary (W-2) income if you actively participate and your MAGI is under $100k (phasing out to $0 by $150k); unused losses carry forward. On sale, claimed depreciation is recaptured at up to 25%, and gains may owe capital-gains tax (a 1031 exchange can defer both). Figures are a year-1 estimate at your 24.0% rate — not tax advice; consult a CPA.
Schools (NCES district)
- District
- Harrisburg City SD
- NCES district ID
- 4211580
- Math proficiency
- 6% ▼ -6.00%
- Reading proficiency
- 13% ▼ -10.00%
- Median HH income
- $33,432
- Composite
- 7.6/100
- National rank
- #9945
- State rank
- #535 of 539 in PA
Livability — Harrisburg
- Score
- 84/100
- State rank
- #107
- US rank
- #826
Category grades
Schools grade is shown separately in the Schools card above.
Census & demographics
- Census place
- Harrisburg, PA
- County
- Dauphin County · 247,857 people
- City population
- 184,296
- Metro
- Harrisburg-Carlisle, PA
- Population (ZIP)
- 13,115
- Household income
- $39,825
- Rent vs Own
- Severe rent burden
- 1014.0
Population outlook (Dauphin County) Hauer SSP2
- Today (2025)
- 281,628 people
- By 2030
- 283,549 · +0.7%
- By 2040
- 285,385 · +1.3%
- By 2050
- 286,188 · +1.6%
- By 2075
- 291,053 · +3.3%
- By 2100
- 282,374 · +0.3%
Race, ethnicity, and origin ACS 2023
- Neighborhood character
- Diverse neighborhood (Simpson 0.66)
- Race & ethnicity
- Black 47% Hispanic / Latino 31% White 18% Two or more races 10%
- Hispanic origin (detail)
- Mexican 4% Puerto Rican 18% Dominican 5%
- Common ancestry
- Hispanic 1% Romanian 1% Italian 1%
- Foreign-born
- 9% · Canada
- Languages at home
- 83% English-only · Spanish 11% French/Haitian/Cajun 2% Tagalog/Filipino 1%
Political lean MEDSL · Dauphin
- 2024 margin
- Lean D (+5.9) · D 52.4% · R 46.5% · Other 1.1%
- 2008→2024 swing
- -3.1pp toward R · 2008: 9.1pp · 2024: 5.9pp
- All cycles
- 2024: D+5.9 2020: D+8.5 2016: D+2.8 2012: D+6.0 2008: D+9.1
Not yet ingested
- Civics
- —
Market trends
- HPI YoY
- ▼ -119.52%
- Current HPI
- 211.455
- Rent YoY
- ▲ 9.09%
- Metro
- Harrisburg-Carlisle, PA
- State GDP YoY
- ▲ 1.68%
- F500 in state
- 34
Industry mix (Fortune 500 HQ in PA)
| Industry | F500 HQs | Revenue |
|---|---|---|
| Healthcare | 2 | $309B |
|
||
| Insurance | 2 | $27B |
|
||
| Telecommunications / Media | 1 | $124B |
|
||
| Industrial Distribution | 1 | $22B |
|
||
| Financial Services | 1 | $20B |
|
||
| Chemicals / Materials | 1 | $18B |
|
||
Price history
+725.0% since first listed6 events — show timeline
- 2026-05-22 Listed $330,000 BRIGHT MLS
- 2021-12-30 Sold (Public Records) $85,000 Public Records
- 2005-12-13 Sold (Public Records) $72,000 Public Records
- 2003-07-30 Sold (MLS) $40,000 BRIGHT MLS
- 2002-11-29 Listing Removed — BRIGHT MLS
- 2002-11-29 Listed $40,000 BRIGHT MLS
Property tax history
+1.0%/yrLatest (2026): $5,209 · +1.6% YoY. Source: county tax records.
Cash-flow waterfall
monthlySold comps — $/sqft
last 12 mo · ≤1 miLoading sold comps…