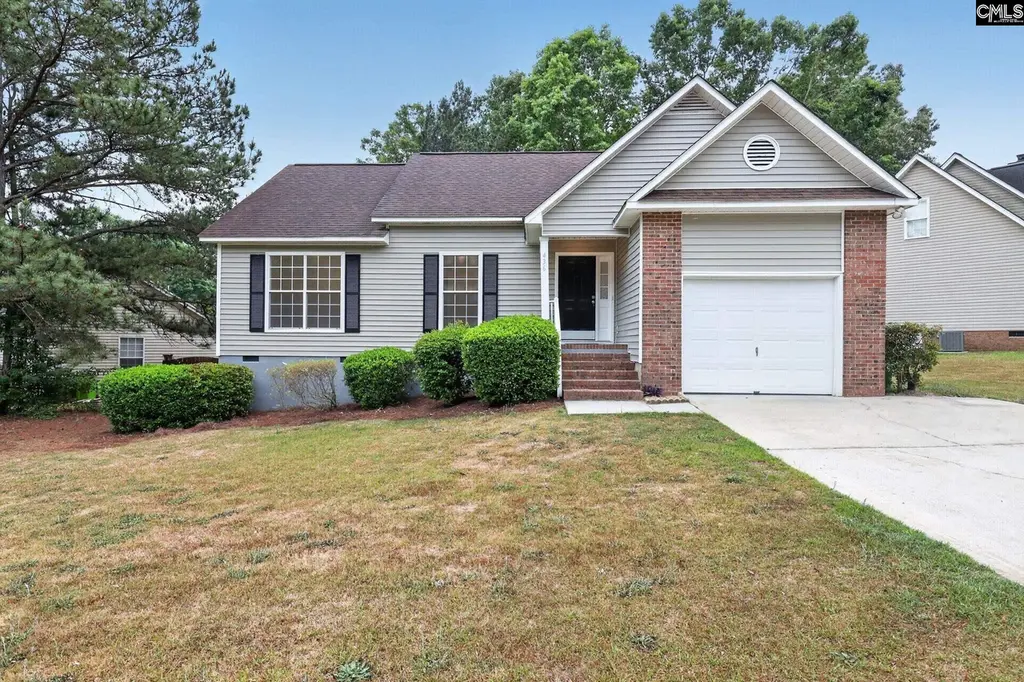
436 Caddis Creek Rd · Columbia, SC
Flood risk 1/10 · Minimal
- FEMA flood zone
- X
- Chance of flooding over 30 yrs
- 0.0%
- Est. flood insurance / yr
- $435 – $905
Fire risk 2/10 · Minimal
- Est. fire insurance / yr
- $783 – $1,453
Heat risk 6/10 · Moderate
- Hot days now (above threshold)
- 7 days/yr
- Hot days in 30 yrs
- 16 days/yr
Wind risk No data
- Chance of severe wind over 30 yrs
- —
Air-quality risk No data
- Unhealthy air days now
- —
- Unhealthy air days in 30 yrs
- —
Risk factors via First Street. Map © Google.
Why this score? — see what drove the D+ grade
The composite is a weighted blend of 9 inputs, each scored 0–100. Each bar is that input's sub-score; the figure is the points it added to the 100-point composite (weight × sub-score).
- Cash flow +18.1/30.0
- ARV discount +7.3/15.0
- DSCR +5.7/10.0
- Schools +4.5/10.0
- 1% rule +4.0/10.0
- Livability +3.9/5.0
- Rent growth +2.7/5.0
- Condition / age +2.5/5.0
- Appreciation +0.0/10.0
$224,900
🖨 Deal sheet 📄 Offer letter ✓ Due diligence
Listing remarks
Thoughtfully updated and move-in ready, this 3 bedroom, 2 bath home offers a bright, open feel with modern finishes throughout. Fresh interior paint, new LVP flooring, and new carpet create a clean, cohesive look, while new light fixtures add a stylish touch. The kitchen is equipped with a full suite of new appliances including a range, microwave, and dishwasher, and flows easily into the main living areas—ideal for everyday living and entertaining. Both bathrooms have been refreshed for a polished, updated feel, and the home’s layout provides comfortable, functional space throughout. A well-appointed home with upgrades that enhance both style and livability. Disclaimer: CMLS h
Key facts
- New carpet
- New appliances
- Refreshed bathrooms
Tags
Property features AI
Finance
- HOA & community: Property is part of an association
Exterior
- Parking: Attached garage (1 car); One parking space
- Utilities: Public water; Public sewer
- Home design: Single-story home
- Construction: Crawlspace foundation
- Exterior features: Partial brick above foundation and vinyl siding; Deck; Partial gutters; Full wood privacy fence; Paved road access
Interior
- Kitchen: Kitchen island; Painted cabinets; Vinyl flooring in kitchen; Dishwasher; Built-in microwave; Free-standing range
- Bedrooms: Master bedroom on the main level
- Flooring: Vinyl flooring in living areas indicated
- Bathrooms: Two full bathrooms
- Heating & cooling: Central air conditioning; Heat pump on the first level
- Interior features: Ceiling fan; Vaulted ceilings
- Laundry & utility: Laundry in a closet off the kitchen
Neighborhood map
What this means for you Summary
Snapshot
- This is a 3-bed/2.0-bath single-family listed at $225k.
Deal economics
- At list price, monthly cash flow is $196 ($2k/yr) — positive.
- The deal already cash-flows at list — no discount required.
- To meet the 1% rule (rent ≥ 1% of price), the offer needs to be $202k (10.0% below list).
- Recommended offer: $202k (10.0% below list) — sets the bar for 1% rule.
- Cap rate 7.3% vs local median 5.0% in Columbia — top-decile yield for the area; either an underpriced asset or a hidden risk that comps aren't pricing in. Stress-test before assuming the spread holds.
Location & tenants
- Location reads 78/100 on livability (#18 in SC, #2,436 nationally) — a middle-class / working-renter tenant base. Strengths: amenities A+, commute A+, cost of living A+; Watch: employment D, crime F.
- Lexington 05 (suburban): math 47% / reading 55% proficiency, ranked #5 of 80 in SC (top 6%) — acceptable for families but not a draw, mixed tenant base, ~2y average lease.
- Zoned schools: Dutch Fork Elementary (math 32% / reading 37%, grade F, #344 of 597 statewide, top 60%, 475 students, 82% FRL); Dutch Fork High (math 54% / reading 86%, grade B+, #58 of 196 statewide, top 30%, 1,726 students, 52% FRL) — zoned schools average 67% FRL vs 27% district-wide (40 pts higher); higher-poverty schools than district average — tighter screening recommended.
- Market conditions: Rents flat; 315 active listings in the ZIP; 37 comparable units currently listed for rent nearby; rentals leasing fast (median 3d on market — plan ~1-2 weeks tenant-placement turnaround); solid renter incomes; 3,472 units permitted in Richland County in 2024 (1,096 in 5+ unit buildings).
Forward outlook
- Local home prices are declining (-3.0%/yr); year-one equity from $2k of loan paydown is wiped out by about $7k of value loss. Plan a longer hold.
- Richland County population projected at +30% by 2050 — long-run rental-demand tailwind backs the buy-and-hold thesis.
Negotiation context
- Only 4 days on market — expect competitive offers; lowballing is unlikely to land.
- Current owner paid $177k; 27% above their basis — modest negotiation headroom, anchor on the comps not their cost.
Risks & watch-outs
- Climate carrying-cost: extreme-heat days projected 7→16/yr by 2055 (HVAC capex compounding) — expect insurance premiums to compound above CPI over the hold.
Questions for the listing agent
- What does the HOA fee cover, when was the last increase, and are there any pending special assessments or reserve-fund shortfalls?
- Is there a deadline driving the sale (1031 exchange, divorce, estate, relocation)? That informs how much negotiation room exists.
- Schools are D-rated, which usually means shorter tenancies and higher turnover. Who's the typical renter profile here, and what's been the actual vacancy rate?
- Crime grade is F in this area — have there been break-ins, vandalism, or insurance claims at this property in the last 3 years? What carrier currently insures it and at what premium?
- The area grade is low — what's the realistic commute time and amenity access for the typical tenant pool here? Any planned neighborhood developments (good or bad) we should know about?
- What's the average days-on-market for RENTAL listings here right now (not sales)? A rising rental-DOM trend means longer vacancies and softer asking-rent achievability than the comps imply.
- What's the recent tenant-quality profile in this submarket — average credit score on applications, eviction rate, late-payment / NSF rate, and stable-employment percentage? A property-management company in the area should have these aggregated.
- How much new for-sale + rental construction is in the pipeline within 1–3 miles? Heavy new supply typically softens prices + rents 12–24 months out; constrained supply supports both.
Investment metrics
- 1% rule
- 0.90% ✗
- Cap rate
- 7.34%
- Cash-on-cash
- 3.74%
- DSCR
- 1.17
- GRM
- 9.3
CMA / ARV
- ARV (on-the-fly)
- $223,860
- Comps found
- 1
Show comp detail 1 sale within ~0.75 mi
| Address | Dist | Beds/Ba | Sqft | Sold | Price | $/sf | Match |
|---|---|---|---|---|---|---|---|
| 1003 Riverwalk Way | 0.30mi | 3/2.0 | 1,318 (+7%) | 15mo | $239,900 | $182 | 61 |
Match score weights: distance 35% · size 25% · config 20% · recency 20%. Top-matched comps best support the ARV.
Projected returns pro-forma
-3.0% appreciation · 0.78% rent growth · sell at horizon
- IRR
- -12.8%
- Equity multiple
- 0.55×
- Total profit
- $-28,419
- Equity at exit
- $33,533
- IRR
- -7.2%
- Equity multiple
- 0.58×
- Total profit
- $-26,248
- Equity at exit
- $19,445
Cash invested: $62,972 (down + closing). Projections, not guarantees.
Landlord ↔ Tenant lean methodology
- Overall (STATE)
- 90 Strongly Landlord-Friendly
- State South Carolina
- 90 Strongly Landlord-Friendly · R+6
- County
- — inherits STATE
- City
- — inherits STATE
ZIP-level market 29063
- Rents YoY
- 0.8%
- Active inventory
- 315
- Price-to-rent
- 9.3×
Monthly cashflow live
- Estimated rent
- $2,023 high interval (Pro) →
- Mortgage (P&I)
- −$1,179
- Tax from tax record
- −$116 /mo · $1,391/yr
- Insurance
- −$94
- HOA
- −$13
- Vacancy / Maint / Mgmt
- −$425
- Net cashflow
- $196
Break-even live
UW: 25.0% down · 7.5% · 30yr · 1.5% tax · 5.0% vac · 8.0% maint · 8.0% mgmt
Financing live
Cash to close
- Down payment
- $56,225
- Closing costs
- $6,747
- Reserves months
- —
- Total cash needed
- —
Loan-product check · same deal, 3 products live
Conventional
25% down · 7.5% · 30yr
- Down + closing
- —
- Monthly P&I
- —
- Monthly cashflow
- —
- DSCR
- —
- Eligible?
- —
Personal DTI + credit; lowest rate.
DSCR
20% down · 8.5% · 30yr
- Down + closing
- —
- Monthly P&I
- —
- Monthly cashflow
- —
- DSCR
- —
- Eligible?
- —
No personal income docs; deal must DSCR.
Hard money
10% down · 12.0% · 12mo
- Down + closing
- —
- Monthly P&I
- —
- Monthly cashflow
- —
- DSCR
- —
- Eligible?
- —
Short-term bridge; refi at stabilization.
Rent comps 37 comps
| Address | Beds | Baths | Sqft | Rent | $/sqft | DOM | Units | Dist |
|---|---|---|---|---|---|---|---|---|
| 316 Stamport Cir Irmo, SC | 3.0 | 2.5 | 1500 | $1,575 | $1.05 | 3d | 1 | 0.17mi |
| 101 Riverwalk Way Irmo, SC | 3.0 | 2.0 | 1300 | $1,750 | $1.35 | 14d | 1 | 1.18mi |
| 174 Winding Chestnut Dr Columbia, SC | 3.0 | 2.5 | 1335 | $1,875 | $1.40 | 23d | 1 | 1.26mi |
| 185 Winding Chestnut Dr Columbia, SC | 3.0 | 2.5 | 1335 | $1,975 | $1.48 | 23d | 1 | 1.35mi |
| 193 Winding Chestnut Dr Columbia, SC | 3.0 | 2.5 | 1335 | $1,975 | $1.48 | 23d | 1 | 1.36mi |
| 197 Winding Chestnut Dr Columbia, SC | 3.0 | 2.5 | 1335 | $1,875 | $1.40 | 23d | 1 | 1.37mi |
| 201 Winding Chestnut Dr Columbia, SC | 3.0 | 2.5 | 1335 | $1,975 | $1.48 | 23d | 1 | 1.38mi |
| 200 Winding Chestnut Dr Columbia, SC | 3.0 | 2.5 | 1335 | $1,975 | $1.48 | 23d | 1 | 1.39mi |
| 204 Winding Chestnut Dr Columbia, SC | 3.0 | 2.5 | 1335 | $1,875 | $1.40 | 23d | 1 | 1.39mi |
| 209 Winding Chestnut Dr Columbia, SC | 3.0 | 2.5 | 1335 | $2,125 | $1.59 | 3d | 1 | 1.40mi |
| 208 Winding Chestnut Dr Columbia, SC | 3.0 | 2.5 | 1335 | $2,125 | $1.59 | 3d | 1 | 1.40mi |
| 211 Winding Chestnut Dr Columbia, SC | 3.0 | 2.5 | 1335 | $2,025 | $1.52 | 3d | 1 | 1.40mi |
| 210 Winding Chestnut Dr Columbia, SC | 3.0 | 2.5 | 1335 | $2,025 | $1.52 | 3d | 1 | 1.41mi |
| 213 Winding Chestnut Dr Columbia, SC | 3.0 | 2.5 | 1335 | $2,025 | $1.52 | 3d | 1 | 1.41mi |
| 215 Winding Chestnut Dr Columbia, SC | 3.0 | 2.5 | 1335 | $2,125 | $1.59 | 3d | 1 | 1.41mi |
| 212 Winding Chestnut Dr Columbia, SC | 3.0 | 2.5 | 1335 | $2,025 | $1.52 | 3d | 1 | 1.41mi |
| 214 Winding Chestnut Dr Columbia, SC | 3.0 | 2.5 | 1335 | $2,125 | $1.59 | 3d | 1 | 1.42mi |
| 217 Winding Chestnut Dr Columbia, SC | 3.0 | 2.5 | 1335 | $2,125 | $1.59 | 3d | 1 | 1.42mi |
| 219 Winding Chestnut Dr Columbia, SC | 3.0 | 2.5 | 1335 | $2,025 | $1.52 | 3d | 1 | 1.42mi |
| 220 Winding Chestnut Dr Columbia, SC | 3.0 | 2.5 | 1335 | $2,125 | $1.59 | 3d | 1 | 1.42mi |
| 221 Winding Chestnut Dr Columbia, SC | 3.0 | 2.5 | 1335 | $2,025 | $1.52 | 3d | 1 | 1.43mi |
| 222 Winding Chestnut Dr Columbia, SC | 3.0 | 2.5 | 1335 | $2,025 | $1.52 | 3d | 1 | 1.43mi |
| 223 Winding Chestnut Dr Columbia, SC | 3.0 | 2.5 | 1335 | $2,125 | $1.59 | 3d | 1 | 1.43mi |
| 224 Winding Chestnut Dr Columbia, SC | 3.0 | 2.5 | 1335 | $2,025 | $1.52 | 3d | 1 | 1.43mi |
| 225 Winding Chestnut Dr Columbia, SC | 3.0 | 2.5 | 1335 | $2,125 | $1.59 | 3d | 1 | 1.44mi |
| 226 Winding Chestnut Dr Columbia, SC | 3.0 | 2.5 | 1335 | $2,125 | $1.59 | 3d | 1 | 1.44mi |
| 227 Winding Chestnut Dr Columbia, SC | 3.0 | 2.5 | 1335 | $2,025 | $1.52 | 3d | 1 | 1.44mi |
| 228 Winding Chestnut Dr Columbia, SC | 3.0 | 2.5 | 1335 | $2,125 | $1.59 | 3d | 1 | 1.44mi |
| 229 Winding Chestnut Dr Columbia, SC | 3.0 | 2.5 | 1335 | $2,025 | $1.52 | 3d | 1 | 1.44mi |
| 230 Winding Chestnut Dr Columbia, SC | 3.0 | 2.5 | 1335 | $2,025 | $1.52 | 3d | 1 | 1.45mi |
| 231 Winding Chestnut Dr Columbia, SC | 3.0 | 2.5 | 1335 | $2,125 | $1.59 | 3d | 1 | 1.45mi |
| 232 Winding Chestnut Dr Columbia, SC | 3.0 | 2.5 | 1335 | $2,025 | $1.52 | 3d | 1 | 1.45mi |
| 233 Winding Chestnut Dr Columbia, SC | 3.0 | 2.5 | 1335 | $2,125 | $1.59 | 3d | 1 | 1.45mi |
| 234 Winding Chestnut Dr Columbia, SC | 3.0 | 2.5 | 1335 | $2,125 | $1.59 | 3d | 1 | 1.46mi |
| 235 Winding Chestnut Dr Columbia, SC | 3.0 | 2.5 | 1335 | $2,025 | $1.52 | 3d | 1 | 1.46mi |
| 237 Winding Chestnut Dr Columbia, SC | 3.0 | 2.5 | 1335 | $2,125 | $1.59 | 3d | 1 | 1.46mi |
| 356 Lake Murray Blvd Irmo, SC | 1.0–3.0 | 1.0–2.0 | 1020 | $2,537 | $2.49 | 3d | 23 | 1.46mi |
HOA detail
- Monthly dues
- $13 · $156/yr
Listing history 4 events
-
2026-05-04status Pending
-
2026-04-30$224,900 Active
-
2026-03-27soldstatus $177,000
-
1999-03-03soldstatus $17,000
ⓘ Source: listings_history table (triggers on properties + properties_extension) + one-shot
backfill from property_details.listing_events for pre-trigger history.
Tax reassessment forecast SC · Resets to sale price
- Current annual tax
- $1,391 · $116/mo
- Projected year-2 tax
- $1,391 · $116/mo
- Expected delta
- $0/yr ($0/mo · 0.0%)
ⓘ Screening estimate from a state-policy table — verify with the county assessor before closing.
Climate risk First Street
- Flood 1/10 Low FEMA zone X · 0% chance over 30 yrs
- Wildfire 2/10 Low
- Heat 6/10 Major
Nearby sold comps map
Loading sold comps map…
Walkable amenities ~0.75 mi
Loading nearby amenities…
Taxation est. · year 1
- Rental income
- $24,280
- − Mortgage interest
- −$12,598
- − Property taxes
- −$1,391
- − Insurance
- −$1,124
- − Repairs & maintenance
- −$1,942
- − Management
- −$1,942
- − HOA
- −$156
- − Depreciation
- −$6,543
- Taxable loss
- −$1,417
- Est. tax savings @ 24.0%
- +$340
- After-tax cash flow
- $2,697/yr
For passive investors: Depreciation is non-cash, so a rental often shows a tax loss while cash-flowing — sheltering income. Rental losses are passive: they offset passive income freely, and up to $25,000/yr can offset ordinary (W-2) income if you actively participate and your MAGI is under $100k (phasing out to $0 by $150k); unused losses carry forward. On sale, claimed depreciation is recaptured at up to 25%, and gains may owe capital-gains tax (a 1031 exchange can defer both). Figures are a year-1 estimate at your 24.0% rate — not tax advice; consult a CPA.
Schools (NCES district)
- District
- Lexington 05
- NCES district ID
- 4502820
- Math proficiency
- 47% ▼ -7.00%
- Reading proficiency
- 55% ▼ -4.00%
- Median HH income
- $67,732
- Composite
- 45.28/100
- National rank
- #2656
- State rank
- #5 of 80 in SC
Livability — Columbia
- Score
- 78/100
- State rank
- #18
- US rank
- #2436
Category grades
Schools grade is shown separately in the Schools card above.
Census & demographics
- County
- Richland County · 389,530 people
- City population
- 335,994
- Metro
- Columbia, SC
- Population (ZIP)
- 38,201
- Household income
- $91,973
- Rent vs Own
- Severe rent burden
- 962.0
Population outlook (Richland County) Hauer SSP2
- Today (2025)
- 459,667 people
- By 2030
- 487,524 · +6.1%
- By 2040
- 542,035 · +17.9%
- By 2050
- 595,371 · +29.5%
- By 2075
- 732,998 · +59.5%
- By 2100
- 820,415 · +78.5%
Race, ethnicity, and origin ACS 2023
- Neighborhood character
- Majority White (65%)
- Race & ethnicity
- White 65% Black 26% Two or more races 5% Hispanic / Latino 3% Asian 2%
- Common ancestry
- Romanian 4% Slovak 4% Serbian 3%
- Foreign-born
- 4% · Canada
- Languages at home
- 95% English-only · Spanish 2% Russian/Polish/Slavic 1% Other Indo-European 1%
Political lean MEDSL · Richland
- 2024 margin
- Solid D (+34.6) · D 66.4% · R 31.8% · Other 1.8%
- 2008→2024 swing
- +5.7pp toward D · 2008: 28.9pp · 2024: 34.6pp
- All cycles
- 2024: D+34.6 2020: D+38.3 2016: D+32.9 2012: D+33.3 2008: D+28.9
Not yet ingested
- Civics
- —
Market trends
- HPI YoY
- ▼ -130.57%
- Current HPI
- 204.0147
- Rent YoY
- ▲ 0.78%
- Metro
- Columbia, SC
- State GDP YoY
- ▲ 4.51%
- F500 in state
- 2
Industry mix (Fortune 500 HQ in SC)
| Industry | F500 HQs | Revenue |
|---|---|---|
| Packaging | 1 | $7B |
|
||
Price history
+1222.9% since first listed4 events — show timeline
- 2026-05-04 Pending — Consolidated MLS
- 2026-04-30 Listed $224,900 Consolidated MLS
- 2026-03-27 Sold (Public Records) $177,000 Public Records
- 1999-03-03 Sold (Public Records) $17,000 Public Records
Property tax history
+3.3%/yrLatest (2025): $1,391 · +4.0% YoY. Source: county tax records.
Cash-flow waterfall
monthlySold comps — $/sqft
last 12 mo · ≤1 miLoading sold comps…