141 High St · McDowell, KY
Flood risk 1/10 · Minimal
- FEMA flood zone
- X (unshaded)
- Chance of flooding over 30 yrs
- 0.0%
- Est. flood insurance / yr
- $473 – $860
Fire risk 6/10 · Moderate
- Est. fire insurance / yr
- $839 – $1,559
Heat risk 4/10 · Minor
- Hot days now (above 101°F)
- 7 days/yr
- Hot days in 30 yrs
- 21 days/yr
Wind risk 2/10 · Minimal
- Chance of severe wind over 30 yrs
- 2.0%
Air-quality risk 1/10 · Minimal
- Unhealthy air days now
- 0 days/yr
- Unhealthy air days in 30 yrs
- 0 days/yr
Risk factors via First Street. Map © Google.
Why this score? — see what drove the B grade
The composite is a weighted blend of 9 inputs, each scored 0–100. Each bar is that input's sub-score; the figure is the points it added to the 100-point composite (weight × sub-score).
- Cash flow +30.0/30.0
- 1% rule +10.0/10.0
- DSCR +10.0/10.0
- ARV discount +7.5/15.0
- Appreciation +4.1/10.0
- Livability +2.9/5.0
- Rent growth +2.5/5.0
- Condition / age +2.5/5.0
- Schools +1.8/10.0
$30,000
🖨 Deal sheet (PDF) 📄 Offer letter ✓ Due diligence
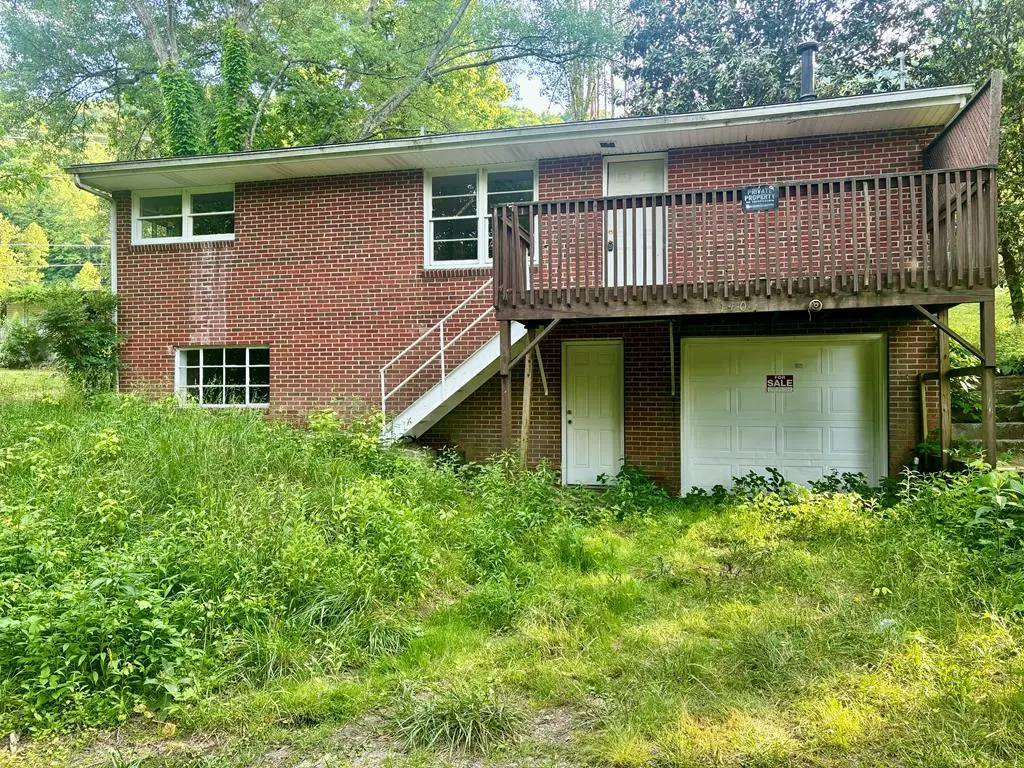
Listing remarks
Affordable fixer upper with tons of potential. This home features 3 bedrooms, 1.5 bathrooms, rear patio and a 1 car garage. Located about a mile from KY-680. This property is being sold AS-IS Where IS. Call today for an appointment to see it for yourself.
Key facts
- 6,970 sq ft lot
- Garage
- Built 1942
Property features AI
Exterior
- Parking: 1-car garage
- Utilities: Public water; Septic tank sewer
- Home design: Single-family residence; Residential property
- Construction: Brick construction; Shingle roof
- Exterior features: Porch (covered); Patio (covered)
Interior
- Kitchen: Refrigerator; Cooktop
- Bedrooms: 8 total rooms (includes bedrooms and living spaces)
- Flooring: Laminate flooring
- Heating & cooling: Central air conditioning
- Interior features: Basement; Garden
Neighborhood map
What this means for you Summary
Snapshot
- This is a 2-bed/1.0-bath single-family listed at $30k.
Deal economics
- At list price, monthly cash flow is $644 ($8k/yr) — positive.
- The deal already cash-flows at list — no discount required.
- Meets the 1% rule at list price ($1k rent vs $30k).
Location & tenants
- Location reads 58/100 on livability (#438 in KY) — a working-class tenant base; expect higher turnover. Strengths: cost of living A+, housing A+; Watch: amenities F, commute F, employment F.
- Floyd County (rural): math 13% / reading 32% proficiency, ranked #157 of 165 in KY (top 95%) — low school quality limits family demand, transient renter base, plan for 1-2y turnover; 63% free/reduced lunch — lower-income household profile, screen leases tightly.
- Zoned schools: Floyd Central High School (math 17% / reading 37%, grade F, #158 of 254 statewide, top 68%, 552 students, 72% FRL).
- Market conditions: 2 active listings in the ZIP; 5 units permitted in Floyd County in 2024 (0 in 5+ unit buildings).
Forward outlook
- Local home prices are declining (-1.9%/yr); year-one equity from $207 of loan paydown is wiped out by about $558 of value loss. Plan a longer hold.
- Floyd County population projected at -36% by 2050 — secular population decline; favor cash flow + early exit over multi-decade hold.
- At projected returns (-1.9% appreciation + 3.0% rent growth), your $8k cash investment doubles in ~2 years — after that, you're playing with house money.
Negotiation context
- Only 5 days on market — expect competitive offers; lowballing is unlikely to land.
- 4 sale attempts since 9y ago with the ask held roughly flat each time — persistent listings suggest the price (not the market) is what's stuck; bring a comps-based counter.
Risks & watch-outs
- Watch-outs: built in 1942 — expect roof / HVAC / electrical / plumbing capex.
- Climate carrying-cost: major wildfire risk — expect insurance premiums to compound above CPI over the hold.
Questions for the listing agent
- Built in 1942 — when were the roof, HVAC, electrical panel, plumbing, and water heater last replaced?
- Is there a deadline driving the sale (1031 exchange, divorce, estate, relocation)? That informs how much negotiation room exists.
- Schools are F-rated, which usually means shorter tenancies and higher turnover. Who's the typical renter profile here, and what's been the actual vacancy rate?
- What's the average days-on-market for RENTAL listings here right now (not sales)? A rising rental-DOM trend means longer vacancies and softer asking-rent achievability than the comps imply.
- What's the recent tenant-quality profile in this submarket — average credit score on applications, eviction rate, late-payment / NSF rate, and stable-employment percentage? A property-management company in the area should have these aggregated.
- How much new for-sale + rental construction is in the pipeline within 1–3 miles? Heavy new supply typically softens prices + rents 12–24 months out; constrained supply supports both.
Investment metrics
- 1% rule
- 3.67% ✓
- Cap rate
- 32.06%
- Cash-on-cash
- 92.02%
- DSCR
- 5.09
- GRM
- 2.3
CMA / ARV
- ARV (on-the-fly)
- $94,400
- Comps found
- 1
Show comp detail 1 sale within ~0.75 mi
| Address | Dist | Beds/Ba | Sqft | Sold | Price | $/sf | Match |
|---|---|---|---|---|---|---|---|
| 7947 Ky Rt. 122 | 0.52mi | 3/1.0 (+1) | 1,452 (-9%) | 22mo | $85,000 | $59 | 38 |
Match score weights: distance 35% · size 25% · config 20% · recency 20%. Top-matched comps best support the ARV.
Projected returns pro-forma
-1.86% appreciation · 3.0% rent growth · sell at horizon
- IRR
- 93.4%
- Equity multiple
- 5.48×
- Total profit
- $37,651
- Equity at exit
- $6,024
- IRR
- 95.7%
- Equity multiple
- 11.36×
- Total profit
- $87,035
- Equity at exit
- $5,337
Cash invested: $8,400 (down + closing). Projections, not guarantees.
Landlord ↔ Tenant lean methodology
- Overall (STATE)
- 83 Strongly Landlord-Friendly
- State Kentucky
- 83 Strongly Landlord-Friendly · R+16
- County
- — inherits STATE
- City
- — inherits STATE
ZIP-level market 41619
- Home prices YoY
- -1.7%
- Active inventory
- 2
- Price-to-rent
- 2.3×
Monthly cashflow live
- Estimated rent
- $1,100 medium interval (Pro) →
- Mortgage (P&I)
- −$157
- Tax from tax record
- −$55 /mo · $660/yr
- Insurance
- −$12
- HOA
- −$0
- Vacancy / Maint / Mgmt
- −$231
- Net cashflow
- $644
Break-even live
Sensitivity live
| Price | -10% $661 | -5% $653 | +0% $644 | +5% $636 | +10% $627 |
|---|---|---|---|---|---|
| Rent | -10% $557 | -5% $601 | +0% $644 | +5% $688 | +10% $731 |
| Rate | -1.0pp $659 | -0.5pp $652 | base $644 | +0.5pp $636 | +1.0pp $628 |
UW: 25.0% down · 7.5% · 30yr · 1.5% tax · 5.0% vac · 8.0% maint · 8.0% mgmt
Financing live
Cash to close
- Down payment
- $7,500
- Closing costs
- $900
- Reserves months
- —
- Total cash needed
- —
Loan-product check · same deal, 3 products live
Conventional
25% down · 7.5% · 30yr
- Down + closing
- —
- Monthly P&I
- —
- Monthly cashflow
- —
- DSCR
- —
- Eligible?
- —
Personal DTI + credit; lowest rate.
DSCR
20% down · 8.5% · 30yr
- Down + closing
- —
- Monthly P&I
- —
- Monthly cashflow
- —
- DSCR
- —
- Eligible?
- —
No personal income docs; deal must DSCR.
Hard money
10% down · 12.0% · 12mo
- Down + closing
- —
- Monthly P&I
- —
- Monthly cashflow
- —
- DSCR
- —
- Eligible?
- —
Short-term bridge; refi at stabilization.
Listing history 17 events
-
2026-06-01status $30,000 Pending 5 DOM
-
2026-06-01days on market $30,000 Active 5 DOM
-
2026-05-31days on market $30,000 Active 4 DOM
-
2026-05-31days on market $30,000 Active 3 DOM
-
2026-05-27$30,000 Active
-
2026-05-08status Pending
-
2026-05-01historical
-
2026-04-25status Active
-
2026-04-14status Pending
-
2026-04-10price $25,000
-
2026-03-24price $30,000
-
2026-03-16price $32,000
-
2026-03-02price $34,900
-
2026-02-13$44,900 Active
-
2017-07-06historical
-
2017-05-27$44,900
-
2007-08-31soldstatus $98,500
ⓘ Source: listings_history table (triggers on properties + properties_extension) + one-shot
backfill from property_details.listing_events for pre-trigger history.
Tax reassessment forecast KY · Resets to sale price
- Current annual tax
- $660 · $55/mo
- Projected year-2 tax
- $660 · $55/mo
- Expected delta
- $0/yr ($0/mo · 0.0%)
ⓘ Screening estimate from a state-policy table — verify with the county assessor before closing.
Climate risk First Street
- Flood 1/10 Low FEMA zone X (unshaded) · 0% chance over 30 yrs
- Wildfire 6/10 Major
- Heat 4/10 Moderate 7 d/yr ≥101°F today · 21 d/yr by 30 yrs out
- Wind 2/10 Low 2% chance of damaging wind over 30 yrs
- Air quality 1/10 Low 0 unhealthy d/yr today · 0 by 30 yrs out
Nearby sold comps map
Loading sold comps map…
Walkable amenities ~0.75 mi
Loading nearby amenities…
Taxation est. · year 1
- Rental income
- $13,200
- − Mortgage interest
- −$1,680
- − Property taxes
- −$660
- − Insurance
- −$150
- − Repairs & maintenance
- −$1,056
- − Management
- −$1,056
- − Depreciation
- −$873
- Taxable income
- $7,725
- Est. tax owed @ 24.0%
- −$1,854
- After-tax cash flow
- $5,876/yr
For passive investors: Depreciation is non-cash, so a rental often shows a tax loss while cash-flowing — sheltering income. Rental losses are passive: they offset passive income freely, and up to $25,000/yr can offset ordinary (W-2) income if you actively participate and your MAGI is under $100k (phasing out to $0 by $150k); unused losses carry forward. On sale, claimed depreciation is recaptured at up to 25%, and gains may owe capital-gains tax (a 1031 exchange can defer both). Figures are a year-1 estimate at your 24.0% rate — not tax advice; consult a CPA.
Schools (NCES district)
- District
- Floyd County
- NCES district ID
- 2101950
- Math proficiency
- 13% ▼ -24.00%
- Reading proficiency
- 32% ▼ -25.00%
- Median HH income
- $29,638
- Composite
- 17.97/100
- National rank
- #8988
- State rank
- #157 of 165 in KY
Livability — McDowell
- Score
- 58/100
- State rank
- #438
- US rank
- #21540
Category grades
Schools grade is shown separately in the Schools card above.
Census & demographics
- City population
- 196
- Population (ZIP)
- 314
Population outlook (Floyd County) Hauer SSP2
- Today (2025)
- 33,016 people
- By 2030
- 30,683 · -7.1%
- By 2040
- 25,378 · -23.1%
- By 2050
- 21,013 · -36.4%
- By 2075
- 14,361 · -56.5%
- By 2100
- 10,464 · -68.3%
Race, ethnicity, and origin ACS 2023
- Neighborhood character
- Predominantly White (83%)
- Race & ethnicity
- White 83% Asian 17%
- Common ancestry
- Serbian 3% Slovak 2%
- Foreign-born
- 17%
- Languages at home
- 83% English-only · Other Indo-European 17%
Political lean MEDSL · Floyd
- 2024 margin
- Solid R (+59.2) · D 19.6% · R 78.8% · Other 1.7%
- 2008→2024 swing
- -57.9pp toward R · 2008: -1.3pp · 2024: -59.2pp
- All cycles
- 2024: R+59.2 2020: R+51.2 2016: R+48.3 2012: R+33.9 2008: R+1.3
Not yet ingested
- Civics
- —
Market trends
- HPI YoY
- ▼ -1.86%
- Current HPI
- 105.6902
- Rent YoY
- —
- Metro
- —
- State GDP YoY
- ▲ 1.81%
- F500 in state
- 4
Industry mix (Fortune 500 HQ in KY)
| Industry | F500 HQs | Revenue |
|---|---|---|
| Healthcare | 1 | $118B |
|
||
| Food / Beverage | 1 | $7B |
|
||
Price history
-69.5% since first listed13 events — show timeline
- 2026-05-27 Listed $30,000 EKAR
- 2026-05-08 Pending — ImagineMLS
- 2026-05-01 Listing Removed — ImagineMLS
- 2026-04-25 Relisted — ImagineMLS
- 2026-04-14 Pending — ImagineMLS
- 2026-04-10 Price Changed $25,000 ImagineMLS
- 2026-03-24 Price Changed $30,000 ImagineMLS
- 2026-03-16 Price Changed $32,000 ImagineMLS
- 2026-03-02 Price Changed $34,900 ImagineMLS
- 2026-02-13 Listed $44,900 ImagineMLS
- 2017-07-06 Listing Removed — ImagineMLS
- 2017-05-27 Listed $44,900 ImagineMLS
- 2007-08-31 Sold (Public Records) $98,500 Public Records
Property tax history
-3.0%/yrLatest (2025): $660 · -0.2% YoY. Source: county tax records.
Cash-flow waterfall
monthlySold comps — $/sqft
last 12 mo · ≤1 miLoading sold comps…