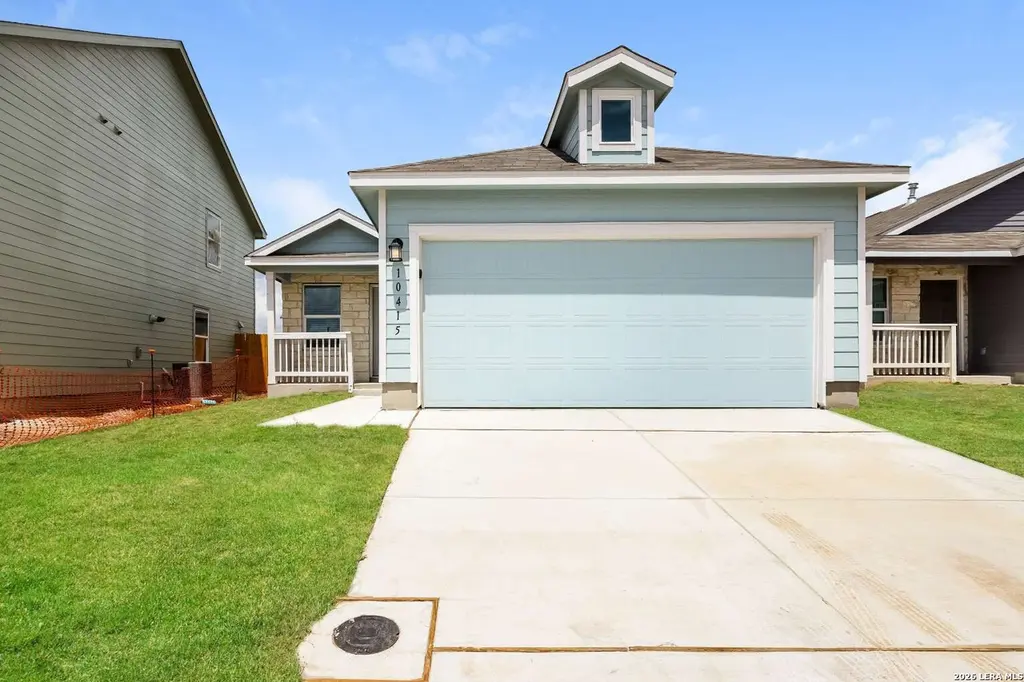
10415 Mcclintock · San Antonio, TX
Flood risk 1/10 · Minimal
- FEMA flood zone
- X (unshaded)
- Chance of flooding over 30 yrs
- 0.0%
- Est. flood insurance / yr
- $507 – $1,088
Fire risk 2/10 · Minimal
- Est. fire insurance / yr
- $1,222 – $2,270
Heat risk 8/10 · Major
- Hot days now (above 108°F)
- 7 days/yr
- Hot days in 30 yrs
- 23 days/yr
Wind risk 8/10 · Major
- Chance of severe wind over 30 yrs
- 80.0%
Air-quality risk 1/10 · Minimal
- Unhealthy air days now
- 0 days/yr
- Unhealthy air days in 30 yrs
- 0 days/yr
Risk factors via First Street. Map © Google.
Why this score? — see what drove the D grade
The composite is a weighted blend of 9 inputs, each scored 0–100. Each bar is that input's sub-score; the figure is the points it added to the 100-point composite (weight × sub-score).
- ARV discount +15.0/15.0
- Cash flow +9.2/30.0
- 1% rule +4.2/10.0
- Livability +4.0/5.0
- Condition / age +4.0/5.0
- DSCR +2.6/10.0
- Rent growth +2.2/5.0
- Schools +1.9/10.0
- Appreciation +0.0/10.0
$184,900
🖨 Deal sheet (PDF) 📄 Offer letter ✓ Due diligence
Listing remarks MLS
Motivated Seller! One or more photos have been virtually staged. This home features thoughtfully designed finishes and a functional layout suited for modern living. The spacious kitchen is equipped with stainless steel appliances and flows seamlessly into the living and dining areas-perfect for both everyday living and entertaining. The primary bedroom provides a comfortable retreat with an ensuite bathroom and a walk-in closet. A dedicated laundry area with washer and dryer hookups adds convenience, while ceiling fans throughout enhance overall comfort. Durable LVP flooring extends across the home, offering both style and easy maintenance. Step outside to a fully fenced backyard, providing privacy and plenty of space for outdoor activities or pets. The attached two-car garage offers ample parking and additional storage. Seller is willing to offer concessions to the buyer at closing.
Key facts
- Walk-in closet
- Ceiling fans
- Ensuite bathroom
Tags
Neighborhood map
What this means for you Summary
Snapshot
- This is a 3-bed/2.0-bath single-family listed at $185k. Condition is rated good.
Deal economics
- At list price, monthly cash flow is $-139 ($-2k/yr) — negative.
- To cash-flow at today's rent, offer at most $160k (13.3% below list).
- To meet the 1% rule (rent ≥ 1% of price), the offer needs to be $171k (7.6% below list).
- Recommended offer: $160k (13.3% below list) — sets the bar for cash-flow.
- Cap rate 5.4% vs local median 3.8% in San Antonio — top-decile yield for the area; either an underpriced asset or a hidden risk that comps aren't pricing in. Stress-test before assuming the spread holds.
Location & tenants
- Location reads 80/100 on livability (#31 in TX, #1,616 nationally) — a professional / high-income tenant draw. Strengths: amenities A+, commute A+, cost of living A+; Watch: crime F.
- East Central ISD (rural): math 16% / reading 25% proficiency, ranked #758 of 826 in TX (top 92%) — low school quality limits family demand, transient renter base, plan for 1-2y turnover; 61% free/reduced lunch — lower-income household profile, screen leases tightly.
- Zoned schools: East Central Heritage Middle (math 11% / reading 26%, grade F, #1,478 of 1,662 statewide, top 90%, 1,120 students, 44% FRL); East Central H S (math 21% / reading 28%, grade F, #1,264 of 1,632 statewide, top 82%, 3,252 students, 52% FRL).
- Market conditions: Rents soft (-1.1%/yr); 1207 active listings in the ZIP; 40 comparable units currently listed for rent nearby; rentals at typical pace (median 24d on market — plan ~3-4 weeks tenant-placement turnaround); solid renter incomes; 8,308 units permitted in Bexar County in 2024 (2,506 in 5+ unit buildings).
Forward outlook
- Local home prices are declining (-3.0%/yr); year-one equity from $1k of loan paydown is wiped out by about $6k of value loss. Plan a longer hold.
- Bexar County population projected at +50% by 2050 — long-run rental-demand tailwind backs the buy-and-hold thesis.
Negotiation context
- It's been on market 75 days — a 6% lower offer ($174k) is reasonable based on typical stale-listing flexibility.
- 3 sale attempts; this cycle's ask has dropped $15k (8%) from the opening price — seller is motivated, your offer sets the floor, not the list.
Risks & watch-outs
- Watch-outs: property tax is 2.8% of price.
- Climate carrying-cost: severe wind risk, 80% chance of damaging wind over 30y; extreme-heat days projected 7→23/yr by 2055 (HVAC capex compounding) — expect insurance premiums to compound above CPI over the hold.
Questions for the listing agent
- What do current leases actually rent for vs. the listed asking? Can we see a recent rent roll and the last 12 months of T-12 income?
- It's been on market 75 days. Have you received any prior offers? Is the seller open to a 13% concession, seller financing, or rate buy-down credit?
- Property tax is high relative to price — has the assessment been appealed recently, and will the sale trigger a re-assessment?
- What does the HOA fee cover, when was the last increase, and are there any pending special assessments or reserve-fund shortfalls?
- Why hasn't it sold? Are there any deal-killer items the seller is aware of (foundation, flood, title, zoning, code violations)?
- Is there a deadline driving the sale (1031 exchange, divorce, estate, relocation)? That informs how much negotiation room exists.
- Crime grade is F in this area — have there been break-ins, vandalism, or insurance claims at this property in the last 3 years? What carrier currently insures it and at what premium?
- The area grade is low — what's the realistic commute time and amenity access for the typical tenant pool here? Any planned neighborhood developments (good or bad) we should know about?
- What's the average days-on-market for RENTAL listings here right now (not sales)? A rising rental-DOM trend means longer vacancies and softer asking-rent achievability than the comps imply.
- What's the recent tenant-quality profile in this submarket — average credit score on applications, eviction rate, late-payment / NSF rate, and stable-employment percentage? A property-management company in the area should have these aggregated.
- How much new for-sale + rental construction is in the pipeline within 1–3 miles? Heavy new supply typically softens prices + rents 12–24 months out; constrained supply supports both.
Investment metrics
- 1% rule
- 0.92% ✗
- Cap rate
- 5.39%
- Cash-on-cash
- -3.23%
- DSCR
- 0.86
- GRM
- 9.0
CMA / ARV
- ARV (median comp)
- $236,653
- List price
- $184,900
- Delta
- -21.87%
- Verdict
- UNDERPRICED
- Comps
- 20 within 1.0 mi
Show comp detail 12 sales within ~0.75 mi
| Address | Dist | Beds/Ba | Sqft | Sold | Price | $/sf | Match |
|---|---|---|---|---|---|---|---|
| 10415 Mcclintock | 0.00mi | 3/2.0 | 1,450 (0%) | 1mo | $184,900 | $128 | 100 |
| 10839 Monterey | 0.49mi | 3/2.5 | 1,428 (-2%) | 1mo | $215,000 | $151 | 72 |
| 10334 Goodison Dr | 0.50mi | 3/2.0 | 1,530 (+6%) | 1mo | $304,990 | $199 | 66 |
| 10418 White Hart Ln | 0.44mi | 3/2.0 | 1,337 (-8%) | 1mo | $253,990 | $190 | 66 |
| 10310 Goodison Dr | 0.56mi | 3/2.0 | 1,530 (+6%) | 1mo | $294,990 | $193 | 64 |
| 10423 Francisco Way | 0.49mi | 3/2.0 | 1,636 (+13%) | 0mo | $225,000 | $138 | 56 |
| 10041 Jagger Ave | 0.69mi | 3/2.0 | 1,549 (+7%) | 3mo | $254,520 | $164 | 54 |
| 10411 Francisco | 0.51mi | 3/2.0 | 1,636 (+13%) | 1mo | $249,900 | $153 | 54 |
| 10742 Fairchild Way | 0.61mi | 4/2.0 (+1) | 1,585 (+9%) | 2mo | $278,900 | $176 | 50 |
| 3210 Gilbert Gdn | 0.65mi | 3/2.0 | 1,260 (-13%) | 1mo | $206,999 | $164 | 47 |
| 10027 Jagger Ave | 0.71mi | 4/2.0 (+1) | 1,605 (+11%) | 2mo | $268,211 | $167 | 42 |
| 3203 Gilbert Gdn | 0.62mi | 4/2.0 (+1) | 1,667 (+15%) | 2mo | $225,950 | $136 | 39 |
Match score weights: distance 35% · size 25% · config 20% · recency 20%. Top-matched comps best support the ARV.
Projected returns pro-forma
-3.0% appreciation · 0.0% rent growth · sell at horizon
- IRR
- -25.7%
- Equity multiple
- 0.16×
- Total profit
- $-43,695
- Equity at exit
- $27,569
- IRR
- -39.4%
- Equity multiple
- -0.32×
- Total profit
- $-68,208
- Equity at exit
- $15,987
Cash invested: $51,772 (down + closing). Projections, not guarantees.
Landlord ↔ Tenant lean methodology
- Overall (STATE)
- 87 Strongly Landlord-Friendly
- State Texas
- 87 Strongly Landlord-Friendly · R+5
- County
- — inherits STATE
- City
- — inherits STATE
ZIP-level market 78109
- Home prices YoY
- -17.8%
- Rents YoY
- -1.1%
- Active inventory
- 1207
- Price-to-rent
- 9.0×
Monthly cashflow live
- Estimated rent
- $1,709 high interval (Pro) →
- Mortgage (P&I)
- −$970
- Tax from tax record
- −$428 /mo · $5,136/yr
- Insurance
- −$77
- HOA
- −$15
- Vacancy / Maint / Mgmt
- −$359
- Net cashflow
- $-139
Break-even live
Sensitivity live
| Price | -10% $-35 | -5% $-87 | +0% $-139 | +5% $-192 | +10% $-244 |
|---|---|---|---|---|---|
| Rent | -10% $-274 | -5% $-207 | +0% $-139 | +5% $-72 | +10% $-4 |
| Rate | -1.0pp $-46 | -0.5pp $-92 | base $-139 | +0.5pp $-187 | +1.0pp $-236 |
UW: 25.0% down · 7.5% · 30yr · 1.5% tax · 5.0% vac · 8.0% maint · 8.0% mgmt
Financing live
Cash to close
- Down payment
- $46,225
- Closing costs
- $5,547
- Reserves months
- —
- Total cash needed
- —
Loan-product check · same deal, 3 products live
Conventional
25% down · 7.5% · 30yr
- Down + closing
- —
- Monthly P&I
- —
- Monthly cashflow
- —
- DSCR
- —
- Eligible?
- —
Personal DTI + credit; lowest rate.
DSCR
20% down · 8.5% · 30yr
- Down + closing
- —
- Monthly P&I
- —
- Monthly cashflow
- —
- DSCR
- —
- Eligible?
- —
No personal income docs; deal must DSCR.
Hard money
10% down · 12.0% · 12mo
- Down + closing
- —
- Monthly P&I
- —
- Monthly cashflow
- —
- DSCR
- —
- Eligible?
- —
Short-term bridge; refi at stabilization.
Rent comps 40 comps
| Address | Beds | Baths | Sqft | Rent | $/sqft | DOM | Units | Dist |
|---|---|---|---|---|---|---|---|---|
| 10714 Giacconi Dr Converse, TX | 4.0 | 2.0 | 1627 | $1,550 | $0.95 | 16d | 1 | 0.04mi |
| 10707 Giacconi Dr Converse, TX | 3.0 | 2.0 | 1266 | $1,686 | $1.33 | 45d | 1 | 0.07mi |
| 10754 Prusiner Dr Converse, TX | 3.0 | 2.0 | 1266 | $1,450 | $1.15 | 25d | 1 | 0.11mi |
| 10606 Varmus Dr Converse, TX | 3.0 | 2.0 | 1440 | $1,546 | $1.07 | 0d | 1 | 0.13mi |
| 10755 Prusiner Dr Converse, TX | 3.0 | 2.0 | 1266 | $1,536 | $1.21 | 23d | 1 | 0.14mi |
| 2906 Millikan Dr Converse, TX | 4.0 | 2.0 | 1627 | $1,525 | $0.94 | 14d | 1 | 0.15mi |
| 2819 Gustavo Dr Converse, TX | 3.0 | 2.0 | 1450 | $1,500 | $1.03 | 45d | 1 | 0.16mi |
| 2811 Gustavo Dr Converse, TX | 3.0 | 2.0 | 1450 | $1,750 | $1.21 | 45d | 1 | 0.17mi |
| 2815 Charpak Dr Converse, TX | 4.0 | 2.0 | 1627 | $1,695 | $1.04 | 5d | 1 | 0.18mi |
| 2822 Millikan Dr Converse, TX | 3.0 | 2.0 | 1440 | $1,650 | $1.15 | 25d | 1 | 0.18mi |
| 2822 Millikan Dr Converse, TX | 3.0 | 2.0 | 1450 | $1,500 | $1.03 | 14d | 1 | 0.18mi |
| 10803 Prusiner Dr Converse, TX | 3.0 | 2.0 | 1440 | $1,476 | $1.02 | 23d | 1 | 0.20mi |
| 10803 Prusiner Dr Converse, TX | 3.0 | 2.0 | 1450 | $1,410 | $0.97 | 25d | 1 | 0.20mi |
| 3318 Carducci Dr Converse, TX | 3.0 | 2.0 | 1276 | $1,800 | $1.41 | 45d | 1 | 0.21mi |
| 2802 Stigler Dr Converse, TX | 4.0 | 2.0 | 1627 | $1,495 | $0.92 | 6d | 1 | 0.24mi |
| 4398 W Vasquez Cir Unit 710 Converse, TX | 2.0 | 2.0 | 1060 | $1,380 | $1.30 | 0d | 1 | 0.32mi |
| 2815 Armaan WAY Converse, TX | 3.0 | 2.5 | 1401 | $1,495 | $1.07 | 0d | 1 | 0.32mi |
| 3055 Jackson Smt Converse, TX | 3.0 | 2.0 | 1525 | $1,595 | $1.05 | 45d | 1 | 0.39mi |
| 10606 Pablo Way Converse, TX | 4.0 | 2.0 | 1667 | $1,631 | $0.98 | 0d | 1 | 0.41mi |
| 2939 Gastonian Ml Converse, TX | 3.0 | 2.0 | 1525 | $1,495 | $0.98 | 45d | 1 | 0.44mi |
| 10690 Pablo Way Converse, TX | 3.0 | 2.0 | 1207 | $1,650 | $1.37 | 45d | 1 | 0.44mi |
| 3130 Jackson Smt Converse, TX | 3.0 | 2.5 | 1428 | $1,885 | $1.32 | 6d | 1 | 0.47mi |
| 10627 Erinita Way Converse, TX | 3.0 | 2.0 | 1474 | $1,466 | $0.99 | 25d | 1 | 0.49mi |
| 11026 Yonder Flts Converse, TX | 3.0 | 2.0 | 1525 | $1,645 | $1.08 | 5d | 1 | 0.52mi |
| 11030 Yonder Flts Converse, TX | 3.0 | 2.5 | 1428 | $1,500 | $1.05 | 6d | 1 | 0.53mi |
| 10922 Chatham Ct Converse, TX | 3.0 | 2.0 | 1525 | $1,645 | $1.08 | 25d | 1 | 0.54mi |
| 10723 Vinateros Dr Converse, TX | 4.0 | 2.0 | 1667 | $1,776 | $1.07 | 45d | 1 | 0.56mi |
| 2822 Praline Fry Converse, TX | 3.0 | 2.0 | 1525 | $1,645 | $1.08 | 4d | 1 | 0.58mi |
| 4351 W Vasquez Cir Converse, TX | 3.0 | 2.0 | 1652 | $1,850 | $1.12 | 21d | 1 | 0.62mi |
| 11019 Chatham Ct Converse, TX | 3.0 | 2.5 | 1428 | $1,425 | $1.00 | 45d | 1 | 0.63mi |
| 11046 Eyelet Hbr Converse, TX | 3.0 | 2.0 | 1525 | $1,750 | $1.15 | 25d | 1 | 0.63mi |
| 3035 Selhurst St Converse, TX | 3.0 | 2.0 | 1557 | $1,800 | $1.16 | 25d | 1 | 0.66mi |
| 3106 Drayton Ests Converse, TX | 2.0–5.0 | 2.0–3.5 | 1733 | $2,102 | $1.21 | 0d | 1 | 0.68mi |
| 4150 Admirals Bnd Converse, TX | 4.0 | 2.0 | 1602 | $1,750 | $1.09 | 6d | 1 | 0.71mi |
| 2187 Schuwirth Rd Converse, TX | 1.0–4.0 | 1.0–2.0 | 962 | $1,667 | $1.73 | 0d | 1 | 0.80mi |
| 10818 Fox Trot Converse, TX | 3.0 | 2.0 | 1465 | $1,850 | $1.26 | 6d | 1 | 0.80mi |
| 10827 Fox Trot Converse, TX | 3.0 | 2.0 | 1650 | $1,645 | $1.00 | 21d | 1 | 0.83mi |
| 11130 Hollinger Cir Converse, TX | 3.0 | 2.5 | 1709 | $1,950 | $1.14 | 23d | 1 | 0.84mi |
| 11130 Hollinger Cir Converse, TX | 3.0 | 2.5 | 1689 | $1,950 | $1.15 | 4d | 1 | 0.84mi |
| 4250 Admirals Bnd Converse, TX | 4.0 | 2.0 | 1602 | $1,699 | $1.06 | 25d | 1 | 0.85mi |
HOA detail
- Monthly dues
- $15 · $180/yr
Listing history 10 events
-
2026-05-11status Pending 896-char remark
Show marketing remark (896 chars)
Motivated Seller! One or more photos have been virtually staged. This home features thoughtfully designed finishes and a functional layout suited for modern living. The spacious kitchen is equipped with stainless steel appliances and flows seamlessly into the living and dining areas-perfect for both everyday living and entertaining. The primary bedroom provides a comfortable retreat with an ensuite bathroom and a walk-in closet. A dedicated laundry area with washer and dryer hookups adds convenience, while ceiling fans throughout enhance overall comfort. Durable LVP flooring extends across the home, offering both style and easy maintenance. Step outside to a fully fenced backyard, providing privacy and plenty of space for outdoor activities or pets. The attached two-car garage offers ample parking and additional storage. Seller is willing to offer concessions to the buyer at closing.
-
2026-04-07price $184,900 896-char remark
Show marketing remark (896 chars)
Motivated Seller! One or more photos have been virtually staged. This home features thoughtfully designed finishes and a functional layout suited for modern living. The spacious kitchen is equipped with stainless steel appliances and flows seamlessly into the living and dining areas-perfect for both everyday living and entertaining. The primary bedroom provides a comfortable retreat with an ensuite bathroom and a walk-in closet. A dedicated laundry area with washer and dryer hookups adds convenience, while ceiling fans throughout enhance overall comfort. Durable LVP flooring extends across the home, offering both style and easy maintenance. Step outside to a fully fenced backyard, providing privacy and plenty of space for outdoor activities or pets. The attached two-car garage offers ample parking and additional storage. Seller is willing to offer concessions to the buyer at closing.
-
2026-02-25$199,900 New 896-char remark
Show marketing remark (896 chars)
Motivated Seller! One or more photos have been virtually staged. This home features thoughtfully designed finishes and a functional layout suited for modern living. The spacious kitchen is equipped with stainless steel appliances and flows seamlessly into the living and dining areas-perfect for both everyday living and entertaining. The primary bedroom provides a comfortable retreat with an ensuite bathroom and a walk-in closet. A dedicated laundry area with washer and dryer hookups adds convenience, while ceiling fans throughout enhance overall comfort. Durable LVP flooring extends across the home, offering both style and easy maintenance. Step outside to a fully fenced backyard, providing privacy and plenty of space for outdoor activities or pets. The attached two-car garage offers ample parking and additional storage. Seller is willing to offer concessions to the buyer at closing.
-
2026-01-27historical
-
2026-01-08$214,900 New
-
2025-12-12historical
-
2025-10-25price $244,000
-
2025-09-19price $254,000
-
2025-07-10$259,000 New
-
2022-07-14soldstatus
ⓘ Source: listings_history table (triggers on properties + properties_extension) + one-shot
backfill from property_details.listing_events for pre-trigger history.
Tax reassessment forecast TX · Resets to sale price
- Current annual tax
- $5,136 · $428/mo
- Projected year-2 tax
- $5,136 · $428/mo
- Expected delta
- $0/yr ($0/mo · 0.0%)
ⓘ Screening estimate from a state-policy table — verify with the county assessor before closing.
Climate risk First Street
- Flood 1/10 Low FEMA zone X (unshaded) · 0% chance over 30 yrs
- Wildfire 2/10 Low
- Heat 8/10 Severe 7 d/yr ≥108°F today · 23 d/yr by 30 yrs out
- Wind 8/10 Severe 80% chance of damaging wind over 30 yrs
- Air quality 1/10 Low 0 unhealthy d/yr today · 0 by 30 yrs out
Nearby sold comps map
Loading sold comps map…
Walkable amenities ~0.75 mi
Loading nearby amenities…
Taxation est. · year 1
- Rental income
- $20,510
- − Mortgage interest
- −$10,357
- − Property taxes
- −$5,136
- − Insurance
- −$924
- − Repairs & maintenance
- −$1,641
- − Management
- −$1,641
- − HOA
- −$180
- − Depreciation
- −$5,379
- Taxable loss
- −$4,748
- Est. tax savings @ 24.0%
- +$1,140
- After-tax cash flow
- $-534/yr
For passive investors: Depreciation is non-cash, so a rental often shows a tax loss while cash-flowing — sheltering income. Rental losses are passive: they offset passive income freely, and up to $25,000/yr can offset ordinary (W-2) income if you actively participate and your MAGI is under $100k (phasing out to $0 by $150k); unused losses carry forward. On sale, claimed depreciation is recaptured at up to 25%, and gains may owe capital-gains tax (a 1031 exchange can defer both). Figures are a year-1 estimate at your 24.0% rate — not tax advice; consult a CPA.
Condition & rehab AI · 12 photos
This home is in good condition with modern finishes and a functional layout, making it a great investment opportunity for both resale and rental.
Value-add opportunities
- Both Staging the home to showcase its features — Staging can attract more buyers and renters.
- Both Adding smart home features — Smart home features can increase both resale and rental value.
- Resale Upgrading the flooring in the bathrooms — Upgrading the flooring can enhance the aesthetic appeal and perceived value of the home.
- Rental Adding a smart thermostat — A smart thermostat can help reduce energy costs and attract renters who value energy efficiency.
Renovation cost estimate screening
Value-add ROI direction
- Both Staging the home to showcase its features — Staging can attract more buyers and renters. ↑
- Both Adding smart home features — Smart home features can increase both resale and rental value. ↑
- Resale Upgrading the flooring in the bathrooms — Upgrading the flooring can enhance the aesthetic appeal and perceived value of the home. ↑
- Rental Adding a smart thermostat — A smart thermostat can help reduce energy costs and attract renters who value energy efficiency. ↑
ⓘ Cost ranges are severity-bucket heuristics (US national rule-of-thumb). Get contractor quotes + a written scope before underwriting a rehab budget.
Schools (NCES district)
- District
- East Central ISD
- NCES district ID
- 4817850
- Math proficiency
- 16% ▼ -12.00%
- Reading proficiency
- 25% ▼ -6.00%
- Median HH income
- $53,941
- Composite
- 18.67/100
- National rank
- #8887
- State rank
- #758 of 826 in TX
Livability — San Antonio
- Score
- 80/100
- State rank
- #31
- US rank
- #1616
Category grades
Schools grade is shown separately in the Schools card above.
Census & demographics
- Census place
- San Antonio, TX
- County
- Bexar County · 1,990,555 people
- City population
- 1,806,925
- Metro
- San Antonio-New Braunfels, TX
- Population (ZIP)
- 63,067
- Household income
- $91,320
- Rent vs Own
- Severe rent burden
- 1732.0
Population outlook (Bexar County) Hauer SSP2
- Today (2025)
- 2,336,851 people
- By 2030
- 2,560,728 · +9.6%
- By 2040
- 3,020,569 · +29.3%
- By 2050
- 3,493,522 · +49.5%
- By 2075
- 4,668,459 · +99.8%
- By 2100
- 5,533,242 · +136.8%
Race, ethnicity, and origin ACS 2023
- Neighborhood character
- Diverse neighborhood (Simpson 0.69)
- Race & ethnicity
- Hispanic / Latino 44% White 27% Two or more races 21% Black 21% Asian 3%
- Hispanic origin (detail)
- Mexican 29% Puerto Rican 4%
- Common ancestry
- Lithuanian 1% Romanian 1% Italian 1%
- Foreign-born
- 11% · Canada, Vietnam, South Korea
- Languages at home
- 71% English-only · Spanish 23% Tagalog/Filipino 1% Other Asian/Pacific 1%
Political lean MEDSL · Bexar
- 2024 margin
- Lean D (+9.8) · D 54.3% · R 44.6% · Other 1.1%
- 2008→2024 swing
- +4.2pp toward D · 2008: 5.6pp · 2024: 9.8pp
- All cycles
- 2024: D+9.8 2020: D+18.2 2016: D+13.5 2012: D+4.6 2008: D+5.6
Not yet ingested
- Civics
- —
Market trends
- HPI YoY
- ▼ -51.02%
- Current HPI
- 236.4923
- Rent YoY
- ▼ -1.08%
- Metro
- San Antonio-New Braunfels, TX
- State GDP YoY
- ▲ 3.95%
- F500 in state
- 110
Industry mix (Fortune 500 HQ in TX)
| Industry | F500 HQs | Revenue |
|---|---|---|
| Energy | 16 | $1,198B |
|
||
| Technology | 5 | $198B |
|
||
| Engineering / Construction | 4 | $72B |
|
||
| Energy Services | 3 | $60B |
|
||
| Utilities | 3 | $41B |
|
||
| Healthcare | 2 | $330B |
|
||
Price history
-28.6% since first listed10 events — show timeline
- 2026-05-11 Pending — LERA
- 2026-04-07 Price Changed $184,900 LERA
- 2026-02-25 Listed $199,900 LERA
- 2026-01-27 Listing Removed — LERA
- 2026-01-08 Listed $214,900 LERA
- 2025-12-12 Listing Removed — LERA
- 2025-10-25 Price Changed $244,000 LERA
- 2025-09-19 Price Changed $254,000 LERA
- 2025-07-10 Listed $259,000 LERA
- 2022-07-14 Sold (Public Records) — Public Records
Property tax history
+58.2%/yrLatest (2025): $5,136 · +1.1% YoY. Source: county tax records.
Cash-flow waterfall
monthlySold comps — $/sqft
last 12 mo · ≤1 miLoading sold comps…