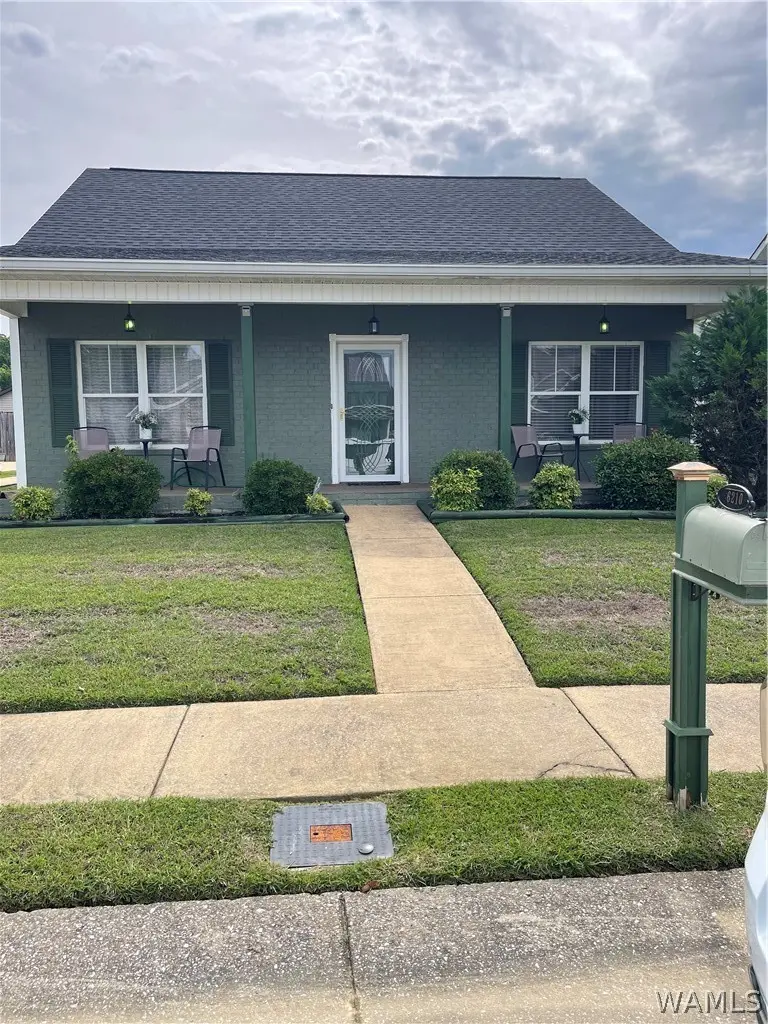
6210 Mimosa Gardens Cir · Tuscaloosa, AL
Flood risk 1/10 · Minimal
- FEMA flood zone
- X (unshaded)
- Chance of flooding over 30 yrs
- 0.0%
- Est. flood insurance / yr
- $507 – $1,088
Fire risk 3/10 · Minor
- Est. fire insurance / yr
- $916 – $1,700
Heat risk 8/10 · Major
- Hot days now (above 109°F)
- 7 days/yr
- Hot days in 30 yrs
- 22 days/yr
Wind risk 6/10 · Moderate
- Chance of severe wind over 30 yrs
- 56.0%
Air-quality risk 1/10 · Minimal
- Unhealthy air days now
- 0 days/yr
- Unhealthy air days in 30 yrs
- 0 days/yr
Risk factors via First Street. Map © Google.
Why this score? — see what drove the D grade
The composite is a weighted blend of 9 inputs, each scored 0–100. Each bar is that input's sub-score; the figure is the points it added to the 100-point composite (weight × sub-score).
- Cash flow +12.1/30.0
- ARV discount +8.3/15.0
- Rent growth +3.9/5.0
- Livability +3.9/5.0
- DSCR +3.6/10.0
- 1% rule +3.5/10.0
- Schools +2.9/10.0
- Condition / age +2.5/5.0
- Appreciation +0.0/10.0
$224,900
🖨 Deal sheet (PDF) 📄 Offer letter ✓ Due diligence
Listing remarks MLS
JUST LIKE NEW!! YOU WILL LOVE THIS BEAUTIFUL THREE BEDROOM TWO BATH HOME THAT'S MOVE-IN READY!! NEW PAINT, NEW FLOORING; ALL APPLIANCES REMAIN!! SCHEDULE YOUR SHOWING TODAY. . WON'T LAST LONG!!
Key facts
- 5,227 sq ft lot
- Built 2008
- Listed 7 days
Property features AI
Exterior
- Parking: Concrete driveway
- Utilities: Public water
- Home design: Single-family residence; One story
- Construction: Brick veneer and other exterior materials; Composition/shingle roof
- Exterior features: Paved road access
Interior
- Bathrooms: 2 full bathrooms
- Heating & cooling: Electric heating; Electric cooling
- Interior features: Electric water heater; No fireplace listed
- Laundry & utility: Laundry located in the kitchen
Neighborhood map
What this means for you Summary
Snapshot
- This is a 3-bed/2.0-bath single-family listed at $225k.
Deal economics
- At list price, monthly cash flow is $-48 ($-578/yr) — negative.
- To cash-flow at today's rent, offer at most $218k (3.1% below list).
- To meet the 1% rule (rent ≥ 1% of price), the offer needs to be $191k (15.2% below list).
- Recommended offer: $191k (15.2% below list) — sets the bar for 1% rule.
- Cap rate 6.0% vs local median 3.4% in Tuscaloosa — top-decile yield for the area; either an underpriced asset or a hidden risk that comps aren't pricing in. Stress-test before assuming the spread holds.
Location & tenants
- Location reads 77/100 on livability (#9 in AL, #2,909 nationally) — a middle-class / working-renter tenant base. Strengths: amenities A+, health & safety A+, cost of living A; Watch: crime F, employment D-.
- Tuscaloosa County (suburban): math 21% / reading 45% proficiency, ranked #47 of 129 in AL (top 36%) — families likely to look elsewhere, expect single-tenant / working-renter base with shorter leases.
- Zoned schools: Englewood Elementary School (math 19% / reading 48%, grade F, #318 of 627 statewide, top 51%, 512 students, 74% FRL); Hillcrest High School (math 18% / reading 26%, grade F, #142 of 305 statewide, top 51%, 1,356 students, 65% FRL) — zoned schools average 69% FRL vs 45% district-wide (24 pts higher); higher-poverty schools than district average — tighter screening recommended.
- Market conditions: Rents rising fast (+5.4%/yr); 462 active listings in the ZIP; 11 comparable units currently listed for rent nearby; rentals lingering (median 46d on market — plan ~5-8 weeks vacancy on turnover, expect pricing pressure); 73% of comp listings sitting > 30 days — soft ceiling on asking rent; 622 units permitted in Tuscaloosa County in 2024 (69 in 5+ unit buildings).
- This rent runs 37% of the median local income ($62k/yr) — at the standard rent-burdened threshold; future hikes will face affordability resistance.
Forward outlook
- Local home prices are declining (-3.0%/yr); year-one equity from $2k of loan paydown is wiped out by about $7k of value loss. Plan a longer hold.
- Tuscaloosa County population projected at +26% by 2050 — long-run rental-demand tailwind backs the buy-and-hold thesis.
Negotiation context
- Only 7 days on market — expect competitive offers; lowballing is unlikely to land.
- 2 sale attempts since 7y ago with the ask held roughly flat each time — persistent listings suggest the price (not the market) is what's stuck; bring a comps-based counter.
- Current owner paid $160k; 41% above their basis — modest negotiation headroom, anchor on the comps not their cost.
Risks & watch-outs
- Climate carrying-cost: major wind risk, 56% chance of damaging wind over 30y; extreme-heat days projected 7→22/yr by 2055 (HVAC capex compounding) — expect insurance premiums to compound above CPI over the hold.
Questions for the listing agent
- What do current leases actually rent for vs. the listed asking? Can we see a recent rent roll and the last 12 months of T-12 income?
- Is there a deadline driving the sale (1031 exchange, divorce, estate, relocation)? That informs how much negotiation room exists.
- Crime grade is F in this area — have there been break-ins, vandalism, or insurance claims at this property in the last 3 years? What carrier currently insures it and at what premium?
- The area grade is low — what's the realistic commute time and amenity access for the typical tenant pool here? Any planned neighborhood developments (good or bad) we should know about?
- What's the average days-on-market for RENTAL listings here right now (not sales)? A rising rental-DOM trend means longer vacancies and softer asking-rent achievability than the comps imply.
- What's the recent tenant-quality profile in this submarket — average credit score on applications, eviction rate, late-payment / NSF rate, and stable-employment percentage? A property-management company in the area should have these aggregated.
- How much new for-sale + rental construction is in the pipeline within 1–3 miles? Heavy new supply typically softens prices + rents 12–24 months out; constrained supply supports both.
Investment metrics
- 1% rule
- 0.85% ✗
- Cap rate
- 6.04%
- Cash-on-cash
- -0.92%
- DSCR
- 0.96
- GRM
- 9.8
CMA / ARV
- ARV (median comp)
- $228,831
- List price
- $224,900
- Delta
- -1.72%
- Verdict
- FAIR
- Comps
- 20 within 1.0 mi
Show comp detail 11 sales within ~0.75 mi
| Address | Dist | Beds/Ba | Sqft | Sold | Price | $/sf | Match |
|---|---|---|---|---|---|---|---|
| 6225 Mimosa Gardens Cir | 0.04mi | 3/2.0 | 1,322 (-1%) | 2mo | $230,000 | $174 | 96 |
| 6222 Mimosa Gardens Cir | 0.03mi | 3/2.0 | 1,246 (-6%) | 2mo | $220,000 | $177 | 86 |
| 6298 Mimosa Gardens Cir | 0.03mi | 3/2.0 | 1,360 (+2%) | 12mo | $224,900 | $165 | 85 |
| 6204 Mimosa Gardens Cir | 0.02mi | 4/2.0 (+1) | 1,418 (+6%) | 13mo | $220,000 | $155 | 73 |
| 6290 Mimosa Gardens Cir | 0.02mi | 3/2.0 | 1,212 (-9%) | 14mo | $224,900 | $186 | 72 |
| 1010 61st St | 0.43mi | 3/2.0 | 1,474 (+11%) | 2mo | $200,000 | $136 | 61 |
| 850 Walnut Dr | 0.68mi | 3/2.0 | 1,320 (-1%) | 11mo | $275,000 | $208 | 58 |
| 1775 Crabtree Cir | 0.73mi | 3/2.0 | 1,320 (-1%) | 12mo | $242,000 | $183 | 55 |
| 1322 Gingerwood Lane Ln | 0.42mi | 3/2.0 | 1,531 (+15%) | 1mo | $250,000 | $163 | 55 |
| 922 66th St | 0.55mi | 3/2.0 | 1,396 (+5%) | 20mo | $205,000 | $147 | 49 |
| 1406 Plantation Rd | 0.40mi | 3/2.0 | 1,526 (+15%) | 11mo | $209,900 | $138 | 48 |
Match score weights: distance 35% · size 25% · config 20% · recency 20%. Top-matched comps best support the ARV.
Projected returns pro-forma
-3.0% appreciation · 5.42% rent growth · sell at horizon
- IRR
- -15.1%
- Equity multiple
- 0.45×
- Total profit
- $-34,727
- Equity at exit
- $33,533
- IRR
- -2.9%
- Equity multiple
- 0.78×
- Total profit
- $-13,570
- Equity at exit
- $19,445
Cash invested: $62,972 (down + closing). Projections, not guarantees.
Landlord ↔ Tenant lean methodology
- Overall (STATE)
- 90 Strongly Landlord-Friendly
- State Alabama
- 90 Strongly Landlord-Friendly · R+15
- County
- — inherits STATE
- City
- — inherits STATE
ZIP-level market 35405
- Home prices YoY
- -26.9%
- Rents YoY
- 5.4%
- Active inventory
- 462
- Price-to-rent
- 9.8×
Monthly cashflow live
- Estimated rent
- $1,906 high interval (Pro) →
- Mortgage (P&I)
- −$1,179
- Tax est. 1.5%
- −$281 /mo · $3,374/yr
- Insurance
- −$94
- HOA
- −$0
- Vacancy / Maint / Mgmt
- −$400
- Net cashflow
- $-48
Break-even live
Sensitivity live
| Price | -10% $107 | -5% $30 | +0% $-48 | +5% $-126 | +10% $-204 |
|---|---|---|---|---|---|
| Rent | -10% $-199 | -5% $-123 | +0% $-48 | +5% $27 | +10% $102 |
| Rate | -1.0pp $65 | -0.5pp $9 | base $-48 | +0.5pp $-106 | +1.0pp $-166 |
UW: 25.0% down · 7.5% · 30yr · 1.5% tax · 5.0% vac · 8.0% maint · 8.0% mgmt
Financing live
Cash to close
- Down payment
- $56,225
- Closing costs
- $6,747
- Reserves months
- —
- Total cash needed
- —
Loan-product check · same deal, 3 products live
Conventional
25% down · 7.5% · 30yr
- Down + closing
- —
- Monthly P&I
- —
- Monthly cashflow
- —
- DSCR
- —
- Eligible?
- —
Personal DTI + credit; lowest rate.
DSCR
20% down · 8.5% · 30yr
- Down + closing
- —
- Monthly P&I
- —
- Monthly cashflow
- —
- DSCR
- —
- Eligible?
- —
No personal income docs; deal must DSCR.
Hard money
10% down · 12.0% · 12mo
- Down + closing
- —
- Monthly P&I
- —
- Monthly cashflow
- —
- DSCR
- —
- Eligible?
- —
Short-term bridge; refi at stabilization.
Rent comps 11 comps
| Address | Beds | Baths | Sqft | Rent | $/sqft | DOM | Units | Dist |
|---|---|---|---|---|---|---|---|---|
| 1800 Links Blvd Tuscaloosa, AL | 1.0–2.0 | 1.0–2.0 | 818 | $1,095 | $1.34 | 45d | 1 | 0.21mi |
| 7501 Links Blvd Tuscaloosa, AL | 1.0–2.0 | 1.0–2.0 | 818 | $2,170 | $2.65 | 45d | 1 | 0.41mi |
| 1092 Stonebrook Ln Tuscaloosa, AL | 3.0 | 2.5 | 1745 | $2,450 | $1.40 | 45d | 1 | 0.75mi |
| 984 Stonebrook Ln Tuscaloosa, AL | 3.0 | 2.5 | 1745 | $2,450 | $1.40 | 45d | 1 | 0.80mi |
| 1009 Stonebrook Ln Tuscaloosa, AL | 3.0 | 2.5 | 1745 | $2,450 | $1.40 | 45d | 1 | 0.82mi |
| 820 Stonebrook Ln Tuscaloosa, AL | 3.0 | 2.5 | 1745 | $2,450 | $1.40 | 45d | 1 | 0.84mi |
| 815 Stonebrook Cir Tuscaloosa, AL | 3.0 | 2.5 | 1745 | $2,450 | $1.40 | 45d | 1 | 0.88mi |
| 801 Stonebrook Cir Tuscaloosa, AL | 2.0–3.0 | 2.0–2.5 | 1397 | $2,500 | $1.79 | 23d | 11 | 0.89mi |
| 8002 Shadesbrook Dr Tuscaloosa, AL | 3.0 | 2.0 | 1620 | $1,510 | $0.93 | 23d | 1 | 1.31mi |
| 8005 Shadesbrook Dr Tuscaloosa, AL | 4.0 | 2.0 | 1620 | $1,995 | $1.23 | 15d | 1 | 1.33mi |
| 3809 Millcreek Ln Tuscaloosa, AL | 3.0 | 1.5 | 1289 | $1,395 | $1.08 | 45d | 1 | 1.47mi |
Listing history 5 events
-
2026-05-16status Pending 677-char remark
-
2026-05-08$224,900 Active 677-char remark
-
2019-06-07soldstatus $159,900
-
2019-06-04soldstatus $159,900 193-char remark
Show marketing remark (193 chars)
JUST LIKE NEW!! YOU WILL LOVE THIS BEAUTIFUL THREE BEDROOM TWO BATH HOME THAT'S MOVE-IN READY!! NEW PAINT, NEW FLOORING; ALL APPLIANCES REMAIN!! SCHEDULE YOUR SHOWING TODAY. . WON'T LAST LONG!!
-
2019-04-04$159,500 193-char remark
Show marketing remark (193 chars)
JUST LIKE NEW!! YOU WILL LOVE THIS BEAUTIFUL THREE BEDROOM TWO BATH HOME THAT'S MOVE-IN READY!! NEW PAINT, NEW FLOORING; ALL APPLIANCES REMAIN!! SCHEDULE YOUR SHOWING TODAY. . WON'T LAST LONG!!
ⓘ Source: listings_history table (triggers on properties + properties_extension) + one-shot
backfill from property_details.listing_events for pre-trigger history.
Climate risk First Street
- Flood 1/10 Low FEMA zone X (unshaded) · 0% chance over 30 yrs
- Wildfire 3/10 Moderate
- Heat 8/10 Severe 7 d/yr ≥109°F today · 22 d/yr by 30 yrs out
- Wind 6/10 Major 56% chance of damaging wind over 30 yrs
- Air quality 1/10 Low 0 unhealthy d/yr today · 0 by 30 yrs out
Nearby sold comps map
Loading sold comps map…
Walkable amenities ~0.75 mi
Loading nearby amenities…
Taxation est. · year 1
- Rental income
- $22,877
- − Mortgage interest
- −$12,598
- − Property taxes
- −$3,374
- − Insurance
- −$1,124
- − Repairs & maintenance
- −$1,830
- − Management
- −$1,830
- − Depreciation
- −$6,543
- Taxable loss
- −$4,421
- Est. tax savings @ 24.0%
- +$1,061
- After-tax cash flow
- $483/yr
For passive investors: Depreciation is non-cash, so a rental often shows a tax loss while cash-flowing — sheltering income. Rental losses are passive: they offset passive income freely, and up to $25,000/yr can offset ordinary (W-2) income if you actively participate and your MAGI is under $100k (phasing out to $0 by $150k); unused losses carry forward. On sale, claimed depreciation is recaptured at up to 25%, and gains may owe capital-gains tax (a 1031 exchange can defer both). Figures are a year-1 estimate at your 24.0% rate — not tax advice; consult a CPA.
Schools (NCES district)
- District
- Tuscaloosa County
- NCES district ID
- 0103390
- Math proficiency
- 21% ▼ -24.00%
- Reading proficiency
- 45% ▲ 2.00%
- Median HH income
- $53,000
- Composite
- 28.88/100
- National rank
- #6641
- State rank
- #47 of 129 in AL
Livability — Tuscaloosa
- Score
- 77/100
- State rank
- #9
- US rank
- #2909
Category grades
Schools grade is shown separately in the Schools card above.
Census & demographics
- County
- Tuscaloosa County · 206,491 people
- City population
- 134,228
- Metro
- Tuscaloosa, AL
- Population (ZIP)
- 49,420
- Household income
- $62,301
- Rent vs Own
- Severe rent burden
- 1963.0
Population outlook (Tuscaloosa County) Hauer SSP2
- Today (2025)
- 228,293 people
- By 2030
- 240,551 · +5.4%
- By 2040
- 263,856 · +15.6%
- By 2050
- 286,491 · +25.5%
- By 2075
- 335,783 · +47.1%
- By 2100
- 370,520 · +62.3%
Race, ethnicity, and origin ACS 2023
- Neighborhood character
- Diverse neighborhood (Simpson 0.56)
- Race & ethnicity
- Black 56% White 35% Hispanic / Latino 5% Two or more races 3% Asian 2%
- Hispanic origin (detail)
- Mexican 2%
- Common ancestry
- Italian 1% Lithuanian 1% Slovak 1%
- Foreign-born
- 5% · Canada, China
- Languages at home
- 94% English-only · Spanish 4% Other Indo-European 1% Chinese 1%
Political lean MEDSL · Tuscaloosa
- 2024 margin
- Strong R (+20.4) · D 39.4% · R 59.8%
- 2008→2024 swing
- -4.4pp toward R · 2008: -16.0pp · 2024: -20.4pp
- All cycles
- 2024: R+20.4 2020: R+14.8 2016: R+19.5 2012: R+17.4 2008: R+16.0
Not yet ingested
- Civics
- —
Market trends
- HPI YoY
- ▼ -71.25%
- Current HPI
- 193.1929
- Rent YoY
- ▲ 5.42%
- Metro
- Tuscaloosa, AL
- State GDP YoY
- ▲ 2.94%
- F500 in state
- 4
Industry mix (Fortune 500 HQ in AL)
| Industry | F500 HQs | Revenue |
|---|---|---|
| Financial Services | 1 | $8B |
|
||
| Healthcare | 1 | $5B |
|
||
Price history
+41.0% since first listed5 events — show timeline
- 2026-05-16 Pending — WAMLS
- 2026-05-08 Listed $224,900 WAMLS
- 2019-06-07 Sold (Public Records) $159,900 Public Records
- 2019-06-04 Sold (MLS) $159,900 WAMLS
- 2019-04-04 Listed $159,500 WAMLS
Property tax history
+3.9%/yrLatest (2019): $368 · +0.0% YoY. Source: county tax records.
Cash-flow waterfall
monthlySold comps — $/sqft
last 12 mo · ≤1 miLoading sold comps…