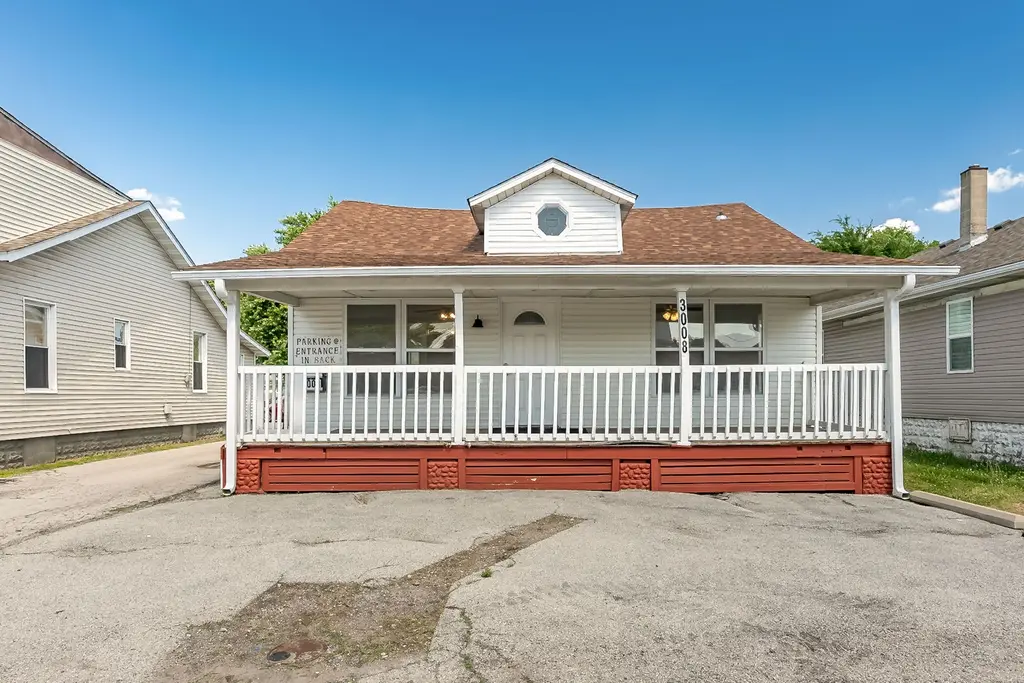
3008 Nameoki Rd · Granite City, IL
Flood risk No data
- FEMA flood zone
- —
- Chance of flooding over 30 yrs
- —
- Est. flood insurance / yr
- —
Fire risk No data
- Est. fire insurance / yr
- —
Heat risk No data
- Hot days now (above threshold)
- —
- Hot days in 30 yrs
- —
Wind risk No data
- Chance of severe wind over 30 yrs
- —
Air-quality risk No data
- Unhealthy air days now
- —
- Unhealthy air days in 30 yrs
- —
Risk factors via First Street. Map © Google.
Why this score? — see what drove the B- grade
The composite is a weighted blend of 9 inputs, each scored 0–100. Each bar is that input's sub-score; the figure is the points it added to the 100-point composite (weight × sub-score).
- Cash flow +30.0/30.0
- DSCR +10.0/10.0
- 1% rule +8.9/10.0
- ARV discount +7.5/15.0
- Livability +3.2/5.0
- Rent growth +2.9/5.0
- Condition / age +2.8/5.0
- Schools +0.9/10.0
- Appreciation +0.0/10.0
$89,000
🖨 Deal sheet 📄 Offer letter ✓ Due diligence
Listing remarks
Unlock the possibilities at 3008 Nameoki Dr, Granite City! Positioned along a highly visible corridor, this versatile property offers a rare opportunity for homeowners, entrepreneurs, investors, or professionals seeking a space that can adapt to their vision. Whether you're looking for a comfortable residence, a home-based business location, professional office space, or a live/work setup, this property provides the flexibility to make it happen. The functional layout offers multiple rooms that can easily serve as private offices, client meeting areas, creative workspaces, or traditional living spaces. Excellent exposure and accessibility create potential for a variety of professional uses,
Key facts
- schools
- Accessibility
- Excellent exposure
Tags
Property features AI
Exterior
- Parking: Parking for 8 vehicles
- Utilities: Public water; Public sewer; Electric service by Ameren
- Home design: Single-family residence; Private ownership; One-and-a-half story
- Construction: Vinyl siding; Architectural shingle roof; Built with a concrete foundation
- Exterior features: Panel doors; Level lot; Asphalt road frontage; Underground utilities
Interior
- Kitchen: Range; Range hood; Refrigerator
- Bedrooms: 2 bedrooms on the main level
- Bathrooms: 1 full bathroom (main level)
- Heating & cooling: Forced air heating; Central air; Ceiling fan(s); Window air unit(s)
- Interior features: Accessible entrance; Concrete unfinished basement
Neighborhood map
What this means for you Summary
Snapshot
- This is a 2-bed/1.0-bath single-family listed at $89k. Condition is rated average.
Deal economics
- At list price, monthly cash flow is $359 ($4k/yr) — positive.
- The deal already cash-flows at list — no discount required.
- Meets the 1% rule at list price ($1k rent vs $89k).
- Cap rate 11.1% vs local median 7.0% in Granite City — top-decile yield for the area; either an underpriced asset or a hidden risk that comps aren't pricing in. Stress-test before assuming the spread holds.
Location & tenants
- Location reads 65/100 on livability (#623 in IL) — a middle-class / working-renter tenant base. Strengths: cost of living A+, housing A+; Watch: crime F, amenities F, commute F.
- Granite City CUSD 9 (suburban): math 9% / reading 11% proficiency, ranked #570 of 620 in IL (top 92%) — low school quality limits family demand, transient renter base, plan for 1-2y turnover.
- Zoned schools: Granite City High School (math 10% / reading 12%, grade F, #522 of 693 statewide, top 76%, 1,805 students, 0% FRL) — zoned schools average 0% FRL vs 59% district-wide (59 pts lower); this property's tenant base skews higher-income than the district average.
- Market conditions: Rents rising (+1.7%/yr); 194 active listings in the ZIP; 1 comparable units currently listed for rent nearby; 336 units permitted in Madison County in 2024 (0 in 5+ unit buildings).
Forward outlook
- Local home prices are declining (-3.0%/yr); year-one equity from $615 of loan paydown is wiped out by about $3k of value loss. Plan a longer hold.
- Madison County population projected at -18% by 2050 — secular population decline; favor cash flow + early exit over multi-decade hold.
- At projected returns (-3.0% appreciation + 1.7% rent growth), your $25k cash investment doubles in ~8 years — after that, you're playing with house money.
Negotiation context
- Only 13 days on market — expect competitive offers; lowballing is unlikely to land.
Risks & watch-outs
- Watch-outs: built in 1940 — expect roof / HVAC / electrical / plumbing capex.
Questions for the listing agent
- Built in 1940 — when were the roof, HVAC, electrical panel, plumbing, and water heater last replaced?
- Is there a deadline driving the sale (1031 exchange, divorce, estate, relocation)? That informs how much negotiation room exists.
- Schools are F-rated, which usually means shorter tenancies and higher turnover. Who's the typical renter profile here, and what's been the actual vacancy rate?
- Crime grade is F in this area — have there been break-ins, vandalism, or insurance claims at this property in the last 3 years? What carrier currently insures it and at what premium?
- What's the average days-on-market for RENTAL listings here right now (not sales)? A rising rental-DOM trend means longer vacancies and softer asking-rent achievability than the comps imply.
- What's the recent tenant-quality profile in this submarket — average credit score on applications, eviction rate, late-payment / NSF rate, and stable-employment percentage? A property-management company in the area should have these aggregated.
- How much new for-sale + rental construction is in the pipeline within 1–3 miles? Heavy new supply typically softens prices + rents 12–24 months out; constrained supply supports both.
Investment metrics
- 1% rule
- 1.39% ✓
- Cap rate
- 11.13%
- Cash-on-cash
- 17.29%
- DSCR
- 1.77
- GRM
- 6.0
CMA / ARV
- ARV (on-the-fly)
- $210,924
- Comps found
- 6
Show comp detail 6 sales within ~0.75 mi
| Address | Dist | Beds/Ba | Sqft | Sold | Price | $/sf | Match |
|---|---|---|---|---|---|---|---|
| 3229 Princeton Dr | 0.55mi | 3/2.0 (+1) | 2,478 (-5%) | 9mo | $199,900 | $81 | 50 |
| 2912 State St | 0.33mi | 3/1.5 (+1) | 2,214 (-15%) | 10mo | $175,000 | $79 | 44 |
| 2844 State St | 0.41mi | 3/2.0 (+1) | 2,832 (+9%) | 18mo | $197,500 | $70 | 42 |
| 3127 Colgate Pl | 0.50mi | 3/1.5 (+1) | 2,396 (-8%) | 19mo | $179,000 | $75 | 40 |
| 3123 Colgate Pl | 0.51mi | 3/3.0 (+1) | 2,214 (-15%) | 15mo | $235,000 | $106 | 26 |
| 3137 Yale Dr | 0.71mi | 3/2.5 (+1) | 2,343 (-10%) | 21mo | $230,000 | $98 | 22 |
Match score weights: distance 35% · size 25% · config 20% · recency 20%. Top-matched comps best support the ARV.
Projected returns pro-forma
-3.0% appreciation · 1.67% rent growth · sell at horizon
- IRR
- 7.1%
- Equity multiple
- 1.27×
- Total profit
- $6,833
- Equity at exit
- $13,270
- IRR
- 15.3%
- Equity multiple
- 2.16×
- Total profit
- $28,962
- Equity at exit
- $7,695
Cash invested: $24,920 (down + closing). Projections, not guarantees.
Landlord ↔ Tenant lean methodology
- Overall (STATE)
- 43 Moderately Tenant-Leaning
- State Illinois
- 43 Moderately Tenant-Leaning · D+7
- County
- — inherits STATE
- City
- — inherits STATE
ZIP-level market 62040
- Home prices YoY
- -21.8%
- Rents YoY
- 1.7%
- Active inventory
- 194
- Price-to-rent
- 6.0×
Monthly cashflow live
- Estimated rent
- $1,233 medium interval (Pro) →
- Mortgage (P&I)
- −$467
- Tax est. 1.5%
- −$111 /mo · $1,335/yr
- Insurance
- −$37
- HOA
- −$0
- Vacancy / Maint / Mgmt
- −$259
- Net cashflow
- $359
Break-even live
UW: 25.0% down · 7.5% · 30yr · 1.5% tax · 5.0% vac · 8.0% maint · 8.0% mgmt
Financing live
Cash to close
- Down payment
- $22,250
- Closing costs
- $2,670
- Reserves months
- —
- Total cash needed
- —
Loan-product check · same deal, 3 products live
Conventional
25% down · 7.5% · 30yr
- Down + closing
- —
- Monthly P&I
- —
- Monthly cashflow
- —
- DSCR
- —
- Eligible?
- —
Personal DTI + credit; lowest rate.
DSCR
20% down · 8.5% · 30yr
- Down + closing
- —
- Monthly P&I
- —
- Monthly cashflow
- —
- DSCR
- —
- Eligible?
- —
No personal income docs; deal must DSCR.
Hard money
10% down · 12.0% · 12mo
- Down + closing
- —
- Monthly P&I
- —
- Monthly cashflow
- —
- DSCR
- —
- Eligible?
- —
Short-term bridge; refi at stabilization.
Rent comps 1 comps
| Address | Beds | Baths | Sqft | Rent | $/sqft | DOM | Units | Dist |
|---|---|---|---|---|---|---|---|---|
| 5 William John Ct Granite City, IL | 3.0 | 1.0 | 1998 | $1,495 | $0.75 | 23d | 1 | 1.36mi |
Listing history 10 events
-
2026-06-18days on market $89,000 Active 13 DOM
-
2026-06-17days on market $89,000 Active 12 DOM
-
2026-06-16days on market $89,000 Active 11 DOM
-
2026-06-15days on market $89,000 Active 10 DOM
-
2026-06-13days on market $89,000 Active 8 DOM
-
2026-06-13days on market $89,000 Active 7 DOM
-
2026-06-09days on market $89,000 Active 4 DOM
-
2026-06-08days on market $89,000 Active 3 DOM
-
2026-06-07remarks 699-char remark
-
2026-06-07$89,000 Active 2 DOM
ⓘ Source: listings_history table (triggers on properties + properties_extension) + one-shot
backfill from property_details.listing_events for pre-trigger history.
Nearby sold comps map
Loading sold comps map…
Walkable amenities ~0.75 mi
Loading nearby amenities…
Taxation est. · year 1
- Rental income
- $14,796
- − Mortgage interest
- −$4,985
- − Property taxes
- −$1,335
- − Insurance
- −$445
- − Repairs & maintenance
- −$1,184
- − Management
- −$1,184
- − Depreciation
- −$2,589
- Taxable income
- $3,074
- Est. tax owed @ 24.0%
- −$738
- After-tax cash flow
- $3,570/yr
For passive investors: Depreciation is non-cash, so a rental often shows a tax loss while cash-flowing — sheltering income. Rental losses are passive: they offset passive income freely, and up to $25,000/yr can offset ordinary (W-2) income if you actively participate and your MAGI is under $100k (phasing out to $0 by $150k); unused losses carry forward. On sale, claimed depreciation is recaptured at up to 25%, and gains may owe capital-gains tax (a 1031 exchange can defer both). Figures are a year-1 estimate at your 24.0% rate — not tax advice; consult a CPA.
Condition & rehab AI · 13 photos
The home is in average condition with some minor repairs and maintenance needed. Painting and flooring updates can significantly increase its resale and rental value.
Repairs flagged
- Minor Paint — Paint appears to be in good condition, with no visible damage or peeling.
- Minor Flooring — Hardwood flooring in fair condition, with some visible wear.
Value-add opportunities
- Both Paint — Painting the exterior and interior can improve the home's curb appeal and overall appearance, making it more attractive to potential buyers or renters.
- Both Flooring — Replacing or refinishing the hardwood flooring can improve the home's overall appearance and increase its value, making it more attractive to potential buyers or renters.
Renovation cost estimate screening
| Repair item | Severity | Est. cost |
|---|---|---|
| Paint · Paint appears to be in good condition, with no visible damage or peeling. | Minor | $500–3,000 |
| Flooring · Hardwood flooring in fair condition, with some visible wear. | Minor | $500–3,000 |
| Total estimated repair cost · 2 items | $1,000–6,000 |
Value-add ROI direction
- Both Paint — Painting the exterior and interior can improve the home's curb appeal and overall appearance, making it more attractive to potential buyers or renters. ↑
- Both Flooring — Replacing or refinishing the hardwood flooring can improve the home's overall appearance and increase its value, making it more attractive to potential buyers or renters. ↑
ⓘ Cost ranges are severity-bucket heuristics (US national rule-of-thumb). Get contractor quotes + a written scope before underwriting a rehab budget.
Schools (NCES district)
- District
- Granite City CUSD 9
- NCES district ID
- 1717280
- Math proficiency
- 9% ▼ -4.00%
- Reading proficiency
- 11% ▼ -7.00%
- Median HH income
- $45,082
- Composite
- 9.15/100
- National rank
- #9864
- State rank
- #570 of 620 in IL
Livability — Granite City
- Score
- 65/100
- State rank
- #623
- US rank
- #12751
Category grades
Schools grade is shown separately in the Schools card above.
Census & demographics
- Census place
- Granite City, IL
- County
- Madison County · 189,064 people
- City population
- 40,404
- Metro
- St. Louis, MO-IL
- Population (ZIP)
- 40,404
- Household income
- $60,031
- Rent vs Own
- Severe rent burden
- 923.0
Population outlook (Madison County) Hauer SSP2
- Today (2025)
- 258,371 people
- By 2030
- 251,523 · -2.7%
- By 2040
- 233,640 · -9.6%
- By 2050
- 213,042 · -17.5%
- By 2075
- 165,255 · -36.0%
- By 2100
- 123,953 · -52.0%
Race, ethnicity, and origin ACS 2023
- Neighborhood character
- Predominantly White (76%)
- Race & ethnicity
- White 76% Hispanic / Latino 9% Black 9% Two or more races 7% Asian 1%
- Hispanic origin (detail)
- Mexican 7%
- Common ancestry
- Romanian 2% Lithuanian 2% Serbian 2%
- Foreign-born
- 3% · Canada, Vietnam
- Languages at home
- 93% English-only · Spanish 5%
Political lean MEDSL · Madison
- 2024 margin
- R (+13.3) · D 42.5% · R 55.8% · Other 1.8%
- 2008→2024 swing
- -22.5pp toward R · 2008: 9.2pp · 2024: -13.3pp
- All cycles
- 2024: R+13.3 2020: R+13.2 2016: R+15.6 2012: R+1.4 2008: D+9.2
Not yet ingested
- Civics
- —
Market trends
- HPI YoY
- ▼ -56.88%
- Current HPI
- 204.4612
- Rent YoY
- ▲ 1.67%
- Metro
- St. Louis, MO-IL
- State GDP YoY
- ▲ 1.59%
- F500 in state
- 60
Industry mix (Fortune 500 HQ in IL)
| Industry | F500 HQs | Revenue |
|---|---|---|
| Insurance | 4 | $201B |
|
||
| Consumer Goods | 4 | $87B |
|
||
| Industrial Machinery | 3 | $64B |
|
||
| Healthcare | 2 | $55B |
|
||
| Retail / Pharmacy | 1 | $148B |
|
||
| Agriculture / Food | 1 | $86B |
|
||
Price history
1 event — show timeline
- 2026-06-05 Listed $89,000 MARIS as Distributed by MLS Grid
Cash-flow waterfall
monthlySold comps — $/sqft
last 12 mo · ≤1 miLoading sold comps…