654 June Ter · DeLand, FL
Flood risk No data
- FEMA flood zone
- —
- Chance of flooding over 30 yrs
- —
- Est. flood insurance / yr
- —
Fire risk No data
- Est. fire insurance / yr
- —
Heat risk No data
- Hot days now (above threshold)
- —
- Hot days in 30 yrs
- —
Wind risk No data
- Chance of severe wind over 30 yrs
- —
Air-quality risk No data
- Unhealthy air days now
- —
- Unhealthy air days in 30 yrs
- —
Risk factors via First Street. Map © Google.
Why this score? — see what drove the B grade
The composite is a weighted blend of 9 inputs, each scored 0–100. Each bar is that input's sub-score; the figure is the points it added to the 100-point composite (weight × sub-score).
- Cash flow +30.0/30.0
- 1% rule +10.0/10.0
- DSCR +10.0/10.0
- ARV discount +7.5/15.0
- Schools +3.9/10.0
- Livability +3.4/5.0
- Rent growth +3.2/5.0
- Condition / age +2.5/5.0
- Appreciation +0.0/10.0
$130,000
🖨 Deal sheet (PDF) 📄 Offer letter ✓ Due diligence
Listing remarks
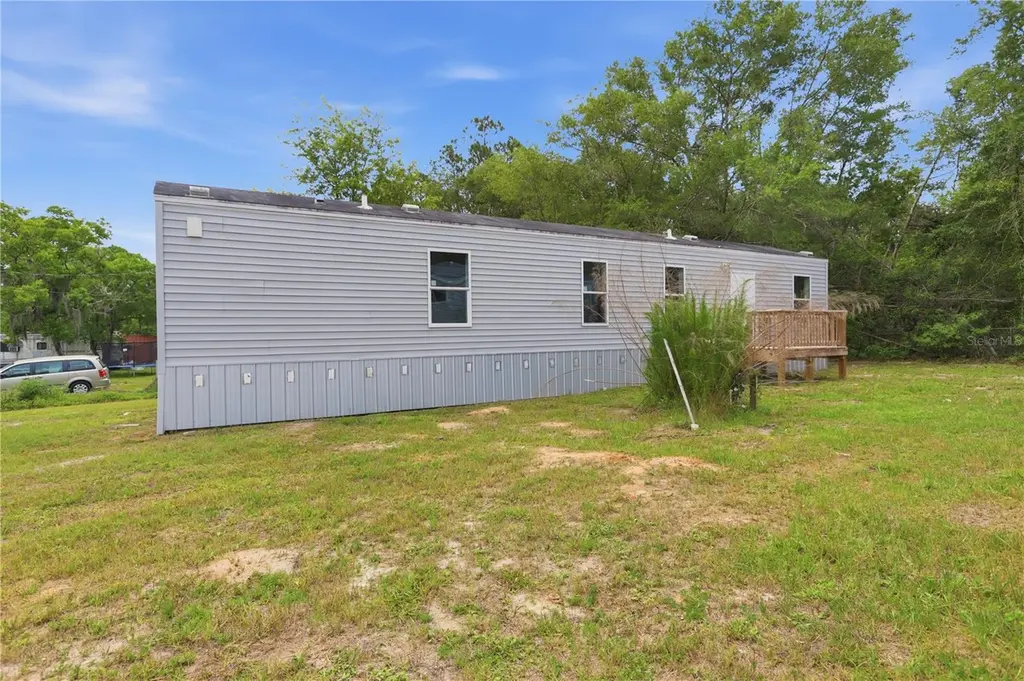
WHY RENT WHEN YOU CAN OWN - come take a look at this affordable home that just needs some finishing touches on the inside. This 3 bedroom 2 bathroom 2018 Manufactured home has never been lived in. If you are looking for two homes that would allow for family or in-laws to live next door, 646 June Terr (V4949054) is also being offered for sale. Investors - own two rentals next to each other - making management easy! Located in quiet area of DeLand!
Key facts
- 0.23 acre lot
- Built 2018
- Listed 30 days
Property features AI
Finance
- Other: Unfurnished; Living area about 854 sq ft (building area 998 sq ft)
- Financial info:
- HOA & community: Not in a development; No association indicated
Exterior
- Parking:
- Security:
- Utilities: Public water; Septic tank; Broadband/high-speed internet available; Cable available
- Home design: Manufactured home (single wide); One level; East-facing entry
- Construction: Metal frame construction; Metal roof; Crawlspace foundation; Built on a 0.23-acre lot (approx. 75 x 135)
- Exterior features: Exterior lighting; Paved road access
Interior
- Kitchen: No appliances included
- Bedrooms: 3 bedrooms
- Flooring: Laminate flooring
- Bathrooms: 2 full bathrooms
- Heating & cooling: Central heating; Central air conditioning
- Interior features: Solid wood cabinets; Split bedroom floor plan; Inside utility/additional room
- Laundry & utility: Laundry inside
Neighborhood map
What this means for you Summary
Snapshot
- This is a 3-bed/2.0-bath land listed at $130k.
Deal economics
- At list price, monthly cash flow is $855 ($10k/yr) — positive.
- The deal already cash-flows at list — no discount required.
- Meets the 1% rule at list price ($2k rent vs $130k).
- Recommended offer: $128k (1.5% below list) — sets the bar for market timing.
Location & tenants
- Location reads 68/100 on livability (#498 in FL) — a middle-class / working-renter tenant base. Strengths: housing A+, cost of living A, crime B; Watch: schools D+, amenities F, commute F.
- Volusia (suburban): math 44% / reading 49% proficiency, ranked #47 of 73 in FL (top 64%) — families likely to look elsewhere, expect single-tenant / working-renter base with shorter leases.
- Market conditions: Rents rising (+2.8%/yr); 662 active listings in the ZIP; 2 comparable units currently listed for rent nearby; 3,402 units permitted in Volusia County in 2024 (681 in 5+ unit buildings).
- This rent runs 34% of the median local income ($74k/yr) — at the standard rent-burdened threshold; future hikes will face affordability resistance.
Forward outlook
- Local home prices are declining (-3.0%/yr); year-one equity from $899 of loan paydown is wiped out by about $4k of value loss. Plan a longer hold.
- Volusia County population projected at +19% by 2050 — long-run rental-demand tailwind backs the buy-and-hold thesis.
- At projected returns (-3.0% appreciation + 2.8% rent growth), your $36k cash investment doubles in ~5 years — after that, you're playing with house money.
Negotiation context
- It's been on market 30 days — a 2% lower offer ($128k) is reasonable based on typical stale-listing flexibility.
- 2 sale attempts with the ask held roughly flat each time — persistent listings suggest the price (not the market) is what's stuck; bring a comps-based counter.
Questions for the listing agent
- Is there a deadline driving the sale (1031 exchange, divorce, estate, relocation)? That informs how much negotiation room exists.
- Schools are D-rated, which usually means shorter tenancies and higher turnover. Who's the typical renter profile here, and what's been the actual vacancy rate?
- What's the average days-on-market for RENTAL listings here right now (not sales)? A rising rental-DOM trend means longer vacancies and softer asking-rent achievability than the comps imply.
- What's the recent tenant-quality profile in this submarket — average credit score on applications, eviction rate, late-payment / NSF rate, and stable-employment percentage? A property-management company in the area should have these aggregated.
- How much new for-sale + rental construction is in the pipeline within 1–3 miles? Heavy new supply typically softens prices + rents 12–24 months out; constrained supply supports both.
Investment metrics
- 1% rule
- 1.60% ✓
- Cap rate
- 14.18%
- Cash-on-cash
- 28.18%
- DSCR
- 2.25
- GRM
- 5.2
CMA / ARV
No comps found within radius.
Projected returns pro-forma
-3.0% appreciation · 2.82% rent growth · sell at horizon
- IRR
- 22.2%
- Equity multiple
- 1.91×
- Total profit
- $32,969
- Equity at exit
- $19,383
- IRR
- 30.1%
- Equity multiple
- 3.67×
- Total profit
- $97,132
- Equity at exit
- $11,240
Cash invested: $36,400 (down + closing). Projections, not guarantees.
Landlord ↔ Tenant lean methodology
- Overall (STATE)
- 87 Strongly Landlord-Friendly
- State Florida
- 87 Strongly Landlord-Friendly · R+3
- County
- — inherits STATE
- City
- — inherits STATE
ZIP-level market 32724
- Rents YoY
- 2.8%
- Active inventory
- 662
- Price-to-rent
- 5.2×
Monthly cashflow live
- Estimated rent
- $2,078 medium interval (Pro) →
- Mortgage (P&I)
- −$682
- Tax from tax record
- −$51 /mo · $608/yr
- Insurance
- −$54
- HOA
- −$0
- Vacancy / Maint / Mgmt
- −$436
- Net cashflow
- $855
Break-even live
Sensitivity live
| Price | -10% $928 | -5% $892 | +0% $855 | +5% $818 | +10% $781 |
|---|---|---|---|---|---|
| Rent | -10% $691 | -5% $773 | +0% $855 | +5% $937 | +10% $1,019 |
| Rate | -1.0pp $920 | -0.5pp $888 | base $855 | +0.5pp $821 | +1.0pp $787 |
UW: 25.0% down · 7.5% · 30yr · 1.5% tax · 5.0% vac · 8.0% maint · 8.0% mgmt
Financing live
Cash to close
- Down payment
- $32,500
- Closing costs
- $3,900
- Reserves months
- —
- Total cash needed
- —
Loan-product check · same deal, 3 products live
Conventional
25% down · 7.5% · 30yr
- Down + closing
- —
- Monthly P&I
- —
- Monthly cashflow
- —
- DSCR
- —
- Eligible?
- —
Personal DTI + credit; lowest rate.
DSCR
20% down · 8.5% · 30yr
- Down + closing
- —
- Monthly P&I
- —
- Monthly cashflow
- —
- DSCR
- —
- Eligible?
- —
No personal income docs; deal must DSCR.
Hard money
10% down · 12.0% · 12mo
- Down + closing
- —
- Monthly P&I
- —
- Monthly cashflow
- —
- DSCR
- —
- Eligible?
- —
Short-term bridge; refi at stabilization.
Rent comps 2 comps
| Address | Beds | Baths | Sqft | Rent | $/sqft | DOM | Units | Dist |
|---|---|---|---|---|---|---|---|---|
| 255 Tupelo Honey Cir Deland, FL | 1.0–4.0 | 1.0–3.0 | 1516 | $2,200 | $1.45 | 5d | 4 | 0.92mi |
| 1077 Quail Dr DeLand, FL | 2.0 | 2.0 | 1080 | $1,600 | $1.48 | 24d | 1 | 0.94mi |
Listing history 15 events
-
2026-06-18days on market $130,000 Active 30 DOM
-
2026-06-17days on market $130,000 Active 29 DOM
-
2026-06-16days on market $130,000 Active 28 DOM
-
2026-06-15days on market $130,000 Active 27 DOM
-
2026-06-10days on market $130,000 Active 26 DOM
-
2026-06-09days on market $130,000 Active 25 DOM
-
2026-06-08days on market $130,000 Active 24 DOM
-
2026-06-07days on market $130,000 Active 23 DOM
-
2026-06-05days on market $130,000 Active 20 DOM
-
2026-06-03days on market $130,000 Active 19 DOM
-
2026-06-03days on market $130,000 Active 18 DOM
-
2026-06-01days on market $130,000 Active 17 DOM
-
2026-05-31days on market $130,000 Active 16 DOM
-
2026-05-31days on market $130,000 Active 15 DOM
-
2026-05-15$130,000 Active 451-char remark
ⓘ Source: listings_history table (triggers on properties + properties_extension) + one-shot
backfill from property_details.listing_events for pre-trigger history.
Tax reassessment forecast FL · Resets to sale price
- Current annual tax
- $608 · $51/mo
- Projected year-2 tax
- $1,079 · $90/mo
- Expected delta
- +$471/yr (+$39/mo · 77.5%)
ⓘ Screening estimate from a state-policy table — verify with the county assessor before closing.
Nearby sold comps map
Loading sold comps map…
Walkable amenities ~0.75 mi
Loading nearby amenities…
Taxation est. · year 1
- Rental income
- $24,933
- − Mortgage interest
- −$7,282
- − Property taxes
- −$608
- − Insurance
- −$650
- − Repairs & maintenance
- −$1,995
- − Management
- −$1,995
- − Depreciation
- −$3,782
- Taxable income
- $8,622
- Est. tax owed @ 24.0%
- −$2,069
- After-tax cash flow
- $8,189/yr
For passive investors: Depreciation is non-cash, so a rental often shows a tax loss while cash-flowing — sheltering income. Rental losses are passive: they offset passive income freely, and up to $25,000/yr can offset ordinary (W-2) income if you actively participate and your MAGI is under $100k (phasing out to $0 by $150k); unused losses carry forward. On sale, claimed depreciation is recaptured at up to 25%, and gains may owe capital-gains tax (a 1031 exchange can defer both). Figures are a year-1 estimate at your 24.0% rate — not tax advice; consult a CPA.
Schools (NCES district)
- District
- Volusia
- NCES district ID
- 1201920
- Math proficiency
- 44% ▼ -9.00%
- Reading proficiency
- 49% ▼ -3.00%
- Median HH income
- $42,946
- Composite
- 39.2/100
- National rank
- #4019
- State rank
- #47 of 73 in FL
Livability — DeLand
- Score
- 68/100
- State rank
- #498
- US rank
- #9197
Category grades
Schools grade is shown separately in the Schools card above.
Census & demographics
- County
- Volusia County · 556,871 people
- City population
- 81,399
- Metro
- Deltona-Daytona Beach-Ormond Beach, FL
- Population (ZIP)
- 45,140
- Household income
- $73,592
- Rent vs Own
- Severe rent burden
- 942.0
Population outlook (Volusia County) Hauer SSP2
- Today (2025)
- 572,749 people
- By 2030
- 598,695 · +4.5%
- By 2040
- 644,880 · +12.6%
- By 2050
- 681,451 · +19.0%
- By 2075
- 759,957 · +32.7%
- By 2100
- 778,902 · +36.0%
Race, ethnicity, and origin ACS 2023
- Neighborhood character
- Predominantly White (71%)
- Race & ethnicity
- White 71% Hispanic / Latino 19% Two or more races 9% Black 6% Asian 1%
- Hispanic origin (detail)
- Mexican 9% Puerto Rican 5%
- Common ancestry
- Romanian 2% Slovak 2% Lithuanian 2%
- Foreign-born
- 10% · Canada, Jamaica
- Languages at home
- 83% English-only · Spanish 14% Other Indo-European 1% French/Haitian/Cajun 1%
Political lean MEDSL · Volusia
- 2024 margin
- Strong R (+21.8) · D 38.7% · R 60.5%
- 2008→2024 swing
- -27.4pp toward R · 2008: 5.7pp · 2024: -21.8pp
- All cycles
- 2024: R+21.8 2020: R+14.1 2016: R+13.1 2012: R+1.2 2008: D+5.7
Not yet ingested
- Civics
- —
Market trends
- HPI YoY
- ▼ -215.80%
- Current HPI
- 297.1837
- Rent YoY
- ▲ 2.82%
- Metro
- Deltona-Daytona Beach-Ormond Beach, FL
- State GDP YoY
- ▲ 3.28%
- F500 in state
- 36
Industry mix (Fortune 500 HQ in FL)
| Industry | F500 HQs | Revenue |
|---|---|---|
| Industrial Technology | 2 | $29B |
|
||
| Insurance | 2 | $17B |
|
||
| Retail | 1 | $60B |
|
||
| Technology Distribution | 1 | $58B |
|
||
| Homebuilding | 1 | $35B |
|
||
| Technology Manufacturing | 1 | $35B |
|
||
Price history
2 events — show timeline
- 2026-06-15 Relisted — Stellar MLS as Distributed by MLS Grid
- 2026-05-15 Listed $130,000 Stellar MLS as Distributed by MLS Grid
Property tax history
+71.8%/yrLatest (2025): $608 · -1.7% YoY. Source: county tax records.
Cash-flow waterfall
monthlySold comps — $/sqft
last 12 mo · ≤1 miLoading sold comps…