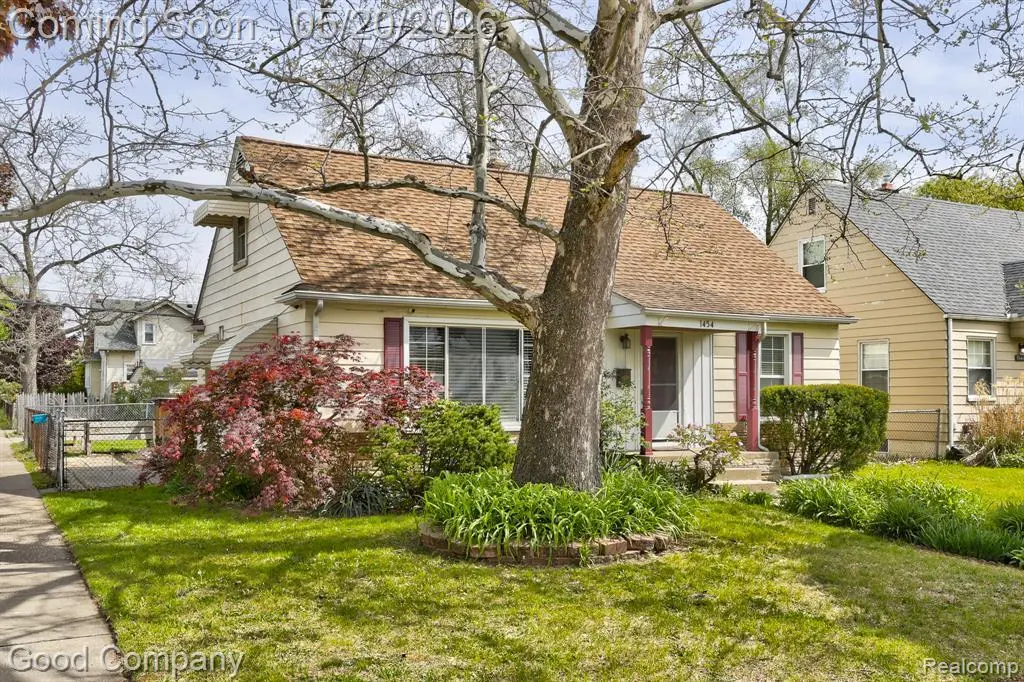
1454 Leroy St · Ferndale, MI
Flood risk 1/10 · Minimal
- FEMA flood zone
- X (unshaded)
- Chance of flooding over 30 yrs
- 0.0%
- Est. flood insurance / yr
- $507 – $1,088
Fire risk 1/10 · Minimal
- Est. fire insurance / yr
- $784 – $1,456
Heat risk 3/10 · Minor
- Hot days now (above 97°F)
- 7 days/yr
- Hot days in 30 yrs
- 15 days/yr
Wind risk 2/10 · Minimal
- Chance of severe wind over 30 yrs
- —
Air-quality risk 4/10 · Minor
- Unhealthy air days now
- 3 days/yr
- Unhealthy air days in 30 yrs
- 6 days/yr
Risk factors via First Street. Map © Google.
Why this score? — see what drove the D+ grade
The composite is a weighted blend of 9 inputs, each scored 0–100. Each bar is that input's sub-score; the figure is the points it added to the 100-point composite (weight × sub-score).
- Cash flow +12.7/30.0
- ARV discount +12.4/15.0
- Livability +4.5/5.0
- Rent growth +4.1/5.0
- DSCR +3.8/10.0
- 1% rule +3.3/10.0
- Schools +2.5/10.0
- Condition / age +2.5/5.0
- Appreciation +0.0/10.0
$285,000
🖨 Deal sheet 📄 Offer letter ✓ Due diligence
Listing remarks MLS
Ferndale's leading home seller presents this corner lot bungalow with beautiful hardwood floors, a spacious back family room, and a detached two-car garage. Bright living room with a large picture window flows into a central dining room featuring a classic chandelier and a charming glass French door at the staircase. Kitchen offers stainless steel appliances, wood cabinetry, and tile backsplash. Open back family room provides great additional living space with a ceiling fan, multiple windows, and access to the back deck. Two entry-level bedrooms with hardwood floors share a full tile bath down the hallway. Head upstairs to a large primary bedroom that spans the entire second floor with built-in dresser drawers and carpet. Full basement provides laundry and plenty of storage space. Fenced backyard with a wood deck, garden area, and brick paver walkway. Close to downtown Ferndale shops, restaurants, and parks. Welcome Home!
Key facts
- Wood cabinetry
- Corner lot
- Hardwood floors
Tags
Property features AI
Finance
- Other: Lot approximately 0.14 acre (50 x 121); Subdivision: LEGGETT FARM
Exterior
- Parking: Detached 2-car garage; Paved access
- Utilities: Public water; Public sewer
- Home design: Single-family residence; One and one-half story; Ground-level entry with steps; Aluminum siding
- Construction: Block foundation
- Exterior features: Covered porch; Deck; Fenced yard
Interior
- Kitchen: Dishwasher; Free-standing gas oven; Free-standing refrigerator; Microwave
- Bedrooms: Total of 7 rooms (bedrooms included)
- Bathrooms: 1 full bathroom
- Heating & cooling: Forced air heating (natural gas); Central air conditioning
- Interior features: Gas water heater; Disposal; Partially finished basement; Interior lighting
- Laundry & utility: Washer; Dryer
Neighborhood map
What this means for you Summary
Snapshot
- This is a 4-bed/1.0-bath single-family listed at $285k.
Deal economics
- At list price, monthly cash flow is $-31 ($-374/yr) — negative.
- To cash-flow at today's rent, offer at most $279k (1.9% below list).
- To meet the 1% rule (rent ≥ 1% of price), the offer needs to be $236k (17.3% below list).
- Recommended offer: $236k (17.3% below list) — sets the bar for 1% rule.
- Cap rate 6.2% vs local median 4.5% in Ferndale — top-decile yield for the area; either an underpriced asset or a hidden risk that comps aren't pricing in. Stress-test before assuming the spread holds.
Location & tenants
- Location reads 90/100 on livability (#8 in MI, #103 nationally) — a professional / high-income tenant draw. Strengths: amenities A+, commute A+, employment A+; Watch: schools D+.
- Ferndale Public Schools (suburban): math 18% / reading 39% proficiency, ranked #366 of 540 in MI (top 68%) — low school quality limits family demand, transient renter base, plan for 1-2y turnover.
- Market conditions: Rents rising fast (+6.2%/yr); 171 active listings in the ZIP; 14 comparable units currently listed for rent nearby; rentals at typical pace (median 17d on market — plan ~3-4 weeks tenant-placement turnaround); solid renter incomes; 2,614 units permitted in Oakland County in 2024 (721 in 5+ unit buildings).
- This rent runs 31% of the median local income ($90k/yr) — at the standard rent-burdened threshold; future hikes will face affordability resistance.
Forward outlook
- Local home prices are declining (-3.0%/yr); year-one equity from $2k of loan paydown is wiped out by about $9k of value loss. Plan a longer hold.
- Oakland County population projected at +10% by 2050 — modest demand growth; plan on rents tracking national, not racing it.
Negotiation context
- Only 12 days on market — expect competitive offers; lowballing is unlikely to land.
- 4 sale attempts with the ask held roughly flat each time — persistent listings suggest the price (not the market) is what's stuck; bring a comps-based counter.
- Current owner paid $156k; list at $285k implies a 82% gain — meaningful room to come down on a strong offer.
Risks & watch-outs
- Watch-outs: built in 1948 — expect roof / HVAC / electrical / plumbing capex.
Questions for the listing agent
- What do current leases actually rent for vs. the listed asking? Can we see a recent rent roll and the last 12 months of T-12 income?
- Built in 1948 — when were the roof, HVAC, electrical panel, plumbing, and water heater last replaced?
- Is there a deadline driving the sale (1031 exchange, divorce, estate, relocation)? That informs how much negotiation room exists.
- Schools are D-rated, which usually means shorter tenancies and higher turnover. Who's the typical renter profile here, and what's been the actual vacancy rate?
- The area grade is low — what's the realistic commute time and amenity access for the typical tenant pool here? Any planned neighborhood developments (good or bad) we should know about?
- What's the average days-on-market for RENTAL listings here right now (not sales)? A rising rental-DOM trend means longer vacancies and softer asking-rent achievability than the comps imply.
- What's the recent tenant-quality profile in this submarket — average credit score on applications, eviction rate, late-payment / NSF rate, and stable-employment percentage? A property-management company in the area should have these aggregated.
- How much new for-sale + rental construction is in the pipeline within 1–3 miles? Heavy new supply typically softens prices + rents 12–24 months out; constrained supply supports both.
Investment metrics
- 1% rule
- 0.83% ✗
- Cap rate
- 6.16%
- Cash-on-cash
- -0.47%
- DSCR
- 0.98
- GRM
- 10.1
CMA / ARV
- ARV (on-the-fly)
- $319,488
- Comps found
- 12
Show comp detail 12 sales within ~0.75 mi
| Address | Dist | Beds/Ba | Sqft | Sold | Price | $/sf | Match |
|---|---|---|---|---|---|---|---|
| 1705 W Troy St | 0.26mi | 3/2.0 (-1) | 1,674 (+1%) | 2mo | $322,000 | $192 | 77 |
| 1915 Central St | 0.32mi | 3/1.0 (-1) | 1,624 (-2%) | 2mo | $280,000 | $172 | 74 |
| 1310 Pinecrest Dr | 0.25mi | 3/1.5 (-1) | 1,731 (+4%) | 2mo | $264,900 | $153 | 73 |
| 1677 Pearson St | 0.20mi | 3/2.0 (-1) | 1,815 (+9%) | 0mo | $295,000 | $163 | 66 |
| 8121 Cloverdale Ave | 0.43mi | 5/2.0 (+1) | 1,765 (+6%) | 1mo | $212,000 | $120 | 60 |
| 23045 Sherman St | 0.34mi | 3/1.0 (-1) | 1,468 (-12%) | 1mo | $226,000 | $154 | 59 |
| 985 W Hazelhurst St | 0.39mi | 3/2.5 (-1) | 1,550 (-7%) | 2mo | $400,000 | $258 | 58 |
| 550 Pinecrest Dr | 0.54mi | 3/1.5 (-1) | 1,547 (-7%) | 1mo | $387,400 | $250 | 56 |
| 1060 W Hazelhurst St | 0.31mi | 3/2.0 (-1) | 1,874 (+13%) | 1mo | $366,000 | $195 | 54 |
| 621 W Hazelhurst St | 0.66mi | 4/2.5 | 1,758 (+6%) | 0mo | $475,000 | $270 | 53 |
| 705 W Breckenridge St | 0.52mi | 3/1.5 (-1) | 1,462 (-12%) | 2mo | $346,000 | $237 | 47 |
| 21025 Glen Lodge Rd | 0.68mi | 3/2.0 (-1) | 1,774 (+7%) | 2mo | $201,500 | $114 | 47 |
Match score weights: distance 35% · size 25% · config 20% · recency 20%. Top-matched comps best support the ARV.
Projected returns pro-forma
-3.0% appreciation · 6.24% rent growth · sell at horizon
- IRR
- -13.6%
- Equity multiple
- 0.50×
- Total profit
- $-40,241
- Equity at exit
- $42,494
- IRR
- -0.5%
- Equity multiple
- 0.96×
- Total profit
- $-2,828
- Equity at exit
- $24,642
Cash invested: $79,800 (down + closing). Projections, not guarantees.
Landlord ↔ Tenant lean methodology
- Overall (STATE)
- 62 Landlord-Friendly
- State Michigan
- 62 Landlord-Friendly · EVEN
- County
- — inherits STATE
- City
- — inherits STATE
ZIP-level market 48220
- Rents YoY
- 6.2%
- Active inventory
- 171
- Price-to-rent
- 10.1×
Monthly cashflow live
- Estimated rent
- $2,358 high interval (Pro) →
- Mortgage (P&I)
- −$1,495
- Tax from tax record
- −$281 /mo · $3,369/yr
- Insurance
- −$119
- HOA
- −$0
- Vacancy / Maint / Mgmt
- −$495
- Net cashflow
- $-31
Break-even live
UW: 25.0% down · 7.5% · 30yr · 1.5% tax · 5.0% vac · 8.0% maint · 8.0% mgmt
Financing live
Cash to close
- Down payment
- $71,250
- Closing costs
- $8,550
- Reserves months
- —
- Total cash needed
- —
Loan-product check · same deal, 3 products live
Conventional
25% down · 7.5% · 30yr
- Down + closing
- —
- Monthly P&I
- —
- Monthly cashflow
- —
- DSCR
- —
- Eligible?
- —
Personal DTI + credit; lowest rate.
DSCR
20% down · 8.5% · 30yr
- Down + closing
- —
- Monthly P&I
- —
- Monthly cashflow
- —
- DSCR
- —
- Eligible?
- —
No personal income docs; deal must DSCR.
Hard money
10% down · 12.0% · 12mo
- Down + closing
- —
- Monthly P&I
- —
- Monthly cashflow
- —
- DSCR
- —
- Eligible?
- —
Short-term bridge; refi at stabilization.
Rent comps 14 comps
| Address | Beds | Baths | Sqft | Rent | $/sqft | DOM | Units | Dist |
|---|---|---|---|---|---|---|---|---|
| 1557 Leroy St Ferndale, MI | 3.0 | 2.0 | 1380 | $2,523 | $1.83 | 4d | 1 | 0.09mi |
| 631 Shasta Pl Ferndale, MI | 3.0 | 2.0 | 1317 | $2,100 | $1.59 | 43d | 1 | 0.51mi |
| 23511 Majestic St Oak Park, MI | 3.0 | 1.0 | 1100 | $1,750 | $1.59 | 24d | 1 | 0.86mi |
| 20110 Northlawn St Detroit, MI | 3.0 | 1.0 | 1100 | $1,350 | $1.23 | 17d | 1 | 1.09mi |
| 320 E Troy St Ferndale, MI | 4.0 | 2.0 | 1627 | $2,200 | $1.35 | 43d | 1 | 1.11mi |
| 351 Edgewood Pl Unit 2 Ferndale, MI | 3.0 | 2.0 | 1600 | $2,200 | $1.38 | 17d | 1 | 1.17mi |
| 19986 Cherrylawn St Detroit, MI | 4.0 | 1.5 | 1144 | $1,700 | $1.49 | 17d | 1 | 1.19mi |
| 20009 Wisconsin St Detroit, MI | 3.0 | 1.5 | 1051 | $1,400 | $1.33 | 17d | 1 | 1.21mi |
| 24051 Geneva St Oak Park, MI | 3.0 | 1.5 | 2052 | $1,800 | $0.88 | 43d | 1 | 1.26mi |
| 25090 Woodward Ave Royal Oak, MI | 1.0–3.0 | 1.0–2.5 | 1146 | $4,195 | $3.66 | 1d | 13 | 1.39mi |
| 2705 Inman St Ferndale, MI | 3.0 | 2.5 | 1429 | $3,195 | $2.24 | 1d | 1 | 1.42mi |
| 2554 Woodstock Dr Highland Park, MI | 3.0 | 1.5 | 1929 | $2,250 | $1.17 | 14d | 1 | 1.43mi |
| 159 Allenhurst Ave Royal Oak, MI | 3.0 | 2.0 | 1955 | $2,700 | $1.38 | 1d | 1 | 1.45mi |
| 21850 Coolidge Hwy #203 Oak Park, MI | 3.0 | 2.0 | 1100 | $1,700 | $1.55 | 4d | 1 | 1.50mi |
Listing history 21 events
-
2026-06-17status $285,000 Pending 12 DOM
Show marketing remark (935 chars)
Ferndale's leading home seller presents this corner lot bungalow with beautiful hardwood floors, a spacious back family room, and a detached two-car garage. Bright living room with a large picture window flows into a central dining room featuring a classic chandelier and a charming glass French door at the staircase. Kitchen offers stainless steel appliances, wood cabinetry, and tile backsplash. Open back family room provides great additional living space with a ceiling fan, multiple windows, and access to the back deck. Two entry-level bedrooms with hardwood floors share a full tile bath down the hallway. Head upstairs to a large primary bedroom that spans the entire second floor with built-in dresser drawers and carpet. Full basement provides laundry and plenty of storage space. Fenced backyard with a wood deck, garden area, and brick paver walkway. Close to downtown Ferndale shops, restaurants, and parks. Welcome Home!
-
2026-06-17days on market $285,000 Active Under Contract 12 DOM
Show marketing remark (935 chars)
Ferndale's leading home seller presents this corner lot bungalow with beautiful hardwood floors, a spacious back family room, and a detached two-car garage. Bright living room with a large picture window flows into a central dining room featuring a classic chandelier and a charming glass French door at the staircase. Kitchen offers stainless steel appliances, wood cabinetry, and tile backsplash. Open back family room provides great additional living space with a ceiling fan, multiple windows, and access to the back deck. Two entry-level bedrooms with hardwood floors share a full tile bath down the hallway. Head upstairs to a large primary bedroom that spans the entire second floor with built-in dresser drawers and carpet. Full basement provides laundry and plenty of storage space. Fenced backyard with a wood deck, garden area, and brick paver walkway. Close to downtown Ferndale shops, restaurants, and parks. Welcome Home!
-
2026-06-16days on market $285,000 Active Under Contract 11 DOM
-
2026-06-15days on market $285,000 Active Under Contract 10 DOM
-
2026-06-13days on market $285,000 Active Under Contract 8 DOM
-
2026-06-13days on market $285,000 Active Under Contract 7 DOM
-
2026-06-09days on market $285,000 Active Under Contract 4 DOM
-
2026-06-08statusdays on market $285,000 Active Under Contract 3 DOM
Show marketing remark (935 chars)
Ferndale's leading home seller presents this corner lot bungalow with beautiful hardwood floors, a spacious back family room, and a detached two-car garage. Bright living room with a large picture window flows into a central dining room featuring a classic chandelier and a charming glass French door at the staircase. Kitchen offers stainless steel appliances, wood cabinetry, and tile backsplash. Open back family room provides great additional living space with a ceiling fan, multiple windows, and access to the back deck. Two entry-level bedrooms with hardwood floors share a full tile bath down the hallway. Head upstairs to a large primary bedroom that spans the entire second floor with built-in dresser drawers and carpet. Full basement provides laundry and plenty of storage space. Fenced backyard with a wood deck, garden area, and brick paver walkway. Close to downtown Ferndale shops, restaurants, and parks. Welcome Home!
-
2026-06-07pricedays on market $285,000 Active 2 DOM
-
2026-06-04days on market $300,000 Active 16 DOM
-
2026-06-03days on market $300,000 Active 15 DOM
-
2026-06-02days on market $300,000 Active 14 DOM
-
2026-06-01days on market $300,000 Active 13 DOM
-
2026-05-31days on market $300,000 Active 12 DOM
-
2026-05-15historical $300,000 948-char remark
-
2001-06-05soldstatus $156,500
-
1999-10-01soldstatus $137,900
-
1995-10-30soldstatus $80,000
-
1981-04-01soldstatus $36,900
-
1979-08-01soldstatus $36,900
-
1979-04-01soldstatus $34,000
ⓘ Source: listings_history table (triggers on properties + properties_extension) + one-shot
backfill from property_details.listing_events for pre-trigger history.
Tax reassessment forecast MI · Partial reset (capped growth)
- Current annual tax
- $3,369 · $281/mo
- Projected year-2 tax
- $3,879 · $323/mo
- Expected delta
- +$510/yr (+$43/mo · 15.1%)
ⓘ Screening estimate from a state-policy table — verify with the county assessor before closing.
Climate risk First Street
- Flood 1/10 Low FEMA zone X (unshaded) · 0% chance over 30 yrs
- Wildfire 1/10 Low
- Heat 3/10 Moderate 7 d/yr ≥97°F today · 15 d/yr by 30 yrs out
- Wind 2/10 Low
- Air quality 4/10 Moderate 3 unhealthy d/yr today · 6 by 30 yrs out
Nearby sold comps map
Loading sold comps map…
Walkable amenities ~0.75 mi
Loading nearby amenities…
Taxation est. · year 1
- Rental income
- $28,297
- − Mortgage interest
- −$15,964
- − Property taxes
- −$3,369
- − Insurance
- −$1,425
- − Repairs & maintenance
- −$2,264
- − Management
- −$2,264
- − Depreciation
- −$8,291
- Taxable loss
- −$5,280
- Est. tax savings @ 24.0%
- +$1,267
- After-tax cash flow
- $893/yr
For passive investors: Depreciation is non-cash, so a rental often shows a tax loss while cash-flowing — sheltering income. Rental losses are passive: they offset passive income freely, and up to $25,000/yr can offset ordinary (W-2) income if you actively participate and your MAGI is under $100k (phasing out to $0 by $150k); unused losses carry forward. On sale, claimed depreciation is recaptured at up to 25%, and gains may owe capital-gains tax (a 1031 exchange can defer both). Figures are a year-1 estimate at your 24.0% rate — not tax advice; consult a CPA.
Schools (NCES district)
- District
- Ferndale Public Schools
- NCES district ID
- 2614280
- Math proficiency
- 18% ▼ -3.00%
- Reading proficiency
- 39% ▲ 5.00%
- Median HH income
- $56,069
- Composite
- 25.46/100
- National rank
- #7449
- State rank
- #366 of 540 in MI
Livability — Ferndale
- Score
- 90/100
- State rank
- #8
- US rank
- #103
Category grades
Schools grade is shown separately in the Schools card above.
Census & demographics
- Census place
- Ferndale, MI
- County
- Oakland County · 1,009,092 people
- City population
- 21,527
- Metro
- Detroit-Warren-Dearborn, MI
- Population (ZIP)
- 21,527
- Household income
- $89,881
- Rent vs Own
- Severe rent burden
- 670.0
Population outlook (Oakland County) Hauer SSP2
- Today (2025)
- 1,335,747 people
- By 2030
- 1,375,100 · +2.9%
- By 2040
- 1,435,385 · +7.5%
- By 2050
- 1,469,250 · +10.0%
- By 2075
- 1,531,946 · +14.7%
- By 2100
- 1,450,485 · +8.6%
Race, ethnicity, and origin ACS 2023
- Neighborhood character
- Predominantly White (72%)
- Race & ethnicity
- White 72% Black 15% Two or more races 6% Hispanic / Latino 5% Asian 3%
- Common ancestry
- Romanian 11% Lithuanian 6% Slovak 3%
- Foreign-born
- 4% · Canada, South Korea
- Languages at home
- 95% English-only · Spanish 2% Other Indo-European 1% German/W. Germanic 1%
Political lean MEDSL · Oakland
- 2024 margin
- D (+10.6) · D 54.4% · R 43.8% · Other 1.9%
- 2008→2024 swing
- -3.9pp toward R · 2008: 14.5pp · 2024: 10.6pp
- All cycles
- 2024: D+10.6 2020: D+14.1 2016: D+8.1 2012: D+8.1 2008: D+14.5
Not yet ingested
- Civics
- —
Market trends
- HPI YoY
- ▼ -394.92%
- Current HPI
- 273.0986
- Rent YoY
- ▲ 6.24%
- Metro
- Detroit-Warren-Dearborn, MI
- State GDP YoY
- ▲ 1.37%
- F500 in state
- 28
Industry mix (Fortune 500 HQ in MI)
| Industry | F500 HQs | Revenue |
|---|---|---|
| Automotive Parts | 3 | $48B |
|
||
| Automotive | 2 | $372B |
|
||
| Chemicals | 1 | $45B |
|
||
| Automotive Retail | 1 | $29B |
|
||
| Healthcare / Medical Devices | 1 | $23B |
|
||
| Automotive Technology | 1 | $20B |
|
||
Price history
+738.2% since first listed17 events — show timeline
- 2026-06-17 Pending — MiRealSource-MiMLS
- 2026-06-17 Pending — REALCOMP
- 2026-06-08 Contingent — MiRealSource-MiMLS
- 2026-06-08 Contingent — REALCOMP
- 2026-06-05 Listing Removed — MiRealSource-MiMLS
- 2026-06-05 Listing Removed — REALCOMP
- 2026-06-05 Listed $285,000 REALCOMP
- 2026-06-05 Listed $285,000 MiRealSource-MiMLS
- 2026-05-20 Listed $300,000 MiRealSource-MiMLS
- 2026-05-20 Listed $300,000 REALCOMP
- 2026-05-15 Coming Soon — MiRealSource-MiMLS
- 2001-06-05 Sold (Public Records) $156,500 Public Records
- 1999-10-01 Sold (Public Records) $137,900 Public Records
- 1995-10-30 Sold (Public Records) $80,000 Public Records
- 1981-04-01 Sold (Public Records) $36,900 Public Records
- 1979-08-01 Sold (Public Records) $36,900 Public Records
- 1979-04-01 Sold (Public Records) $34,000 Public Records
Property tax history
+1.5%/yrLatest (2025): $3,369 · +1.5% YoY. Source: county tax records.
Cash-flow waterfall
monthlySold comps — $/sqft
last 12 mo · ≤1 miLoading sold comps…