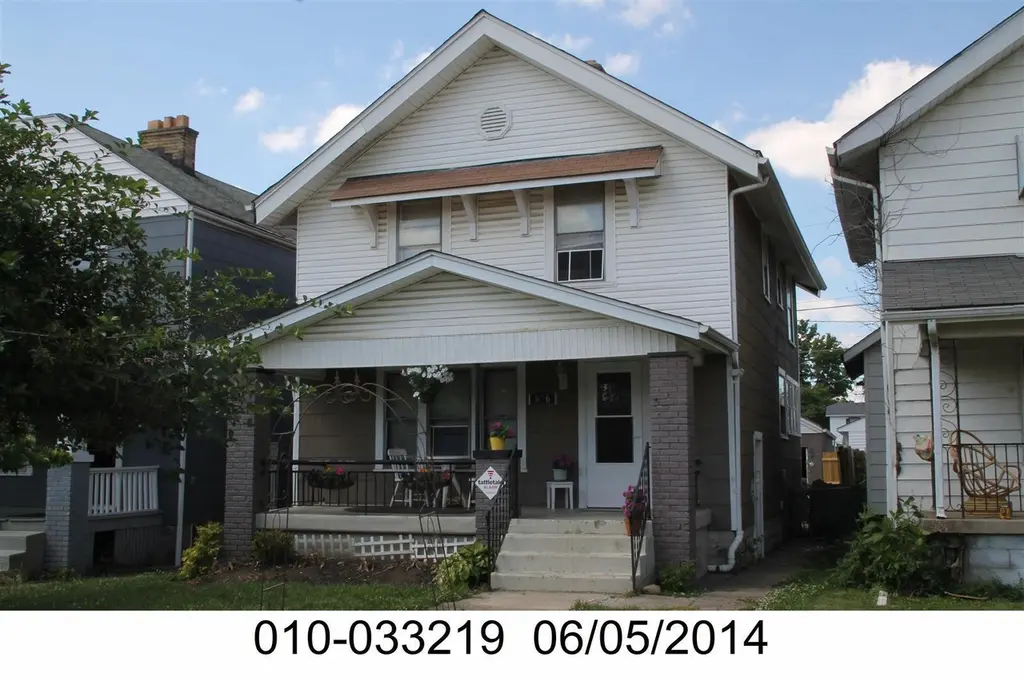
676 E Moler St · Columbus, OH
Flood risk 1/10 · Minimal
- FEMA flood zone
- X (unshaded)
- Chance of flooding over 30 yrs
- 0.0%
- Est. flood insurance / yr
- $473 – $860
Fire risk 1/10 · Minimal
- Est. fire insurance / yr
- $713 – $1,323
Heat risk 4/10 · Minor
- Hot days now (above 100°F)
- 7 days/yr
- Hot days in 30 yrs
- 18 days/yr
Wind risk 2/10 · Minimal
- Chance of severe wind over 30 yrs
- 1.0%
Air-quality risk 3/10 · Minor
- Unhealthy air days now
- 2 days/yr
- Unhealthy air days in 30 yrs
- 3 days/yr
Risk factors via First Street. Map © Google.
Why this score? — see what drove the D grade
The composite is a weighted blend of 9 inputs, each scored 0–100. Each bar is that input's sub-score; the figure is the points it added to the 100-point composite (weight × sub-score).
- Cash flow +15.0/30.0
- ARV discount +7.5/15.0
- 1% rule +5.0/10.0
- DSCR +5.0/10.0
- Livability +4.0/5.0
- Rent growth +3.1/5.0
- Condition / age +2.5/5.0
- Schools +1.7/10.0
- Appreciation +0.0/10.0
$40,000
🖨 Deal sheet (PDF) 📄 Offer letter ✓ Due diligence
Listing remarks MLS
FANTASTIC OPPORTUNITY! PURCHASE THIS PROPERTY FOR AS LITTLE AS 3% DOWN! THIS PROPERTY IS APPROVED FOR HOMEPATH RENOVATION MORTGAGE FINANCING. PLEASE CONTACT LISTING AGENT FOR MORE INFORMATION.
Key facts
- 3,049 sq ft lot
- Garage
- Built 1929
Neighborhood map
What this means for you Summary
Snapshot
- This is a 3-bed/1.5-bath single-family listed at $40k.
Deal economics
- At list price, monthly cash flow is $1k ($13k/yr) — positive.
- The deal already cash-flows at list — no discount required.
- Meets the 1% rule at list price ($2k rent vs $40k).
- Recommended offer: $35k (12.0% below list) — sets the bar for market timing.
- Cap rate 38.3% vs local median 3.8% in Columbus — top-decile yield for the area; either an underpriced asset or a hidden risk that comps aren't pricing in. Stress-test before assuming the spread holds.
Location & tenants
- Location reads 81/100 on livability (#97 in OH, #1,491 nationally) — a professional / high-income tenant draw. Strengths: commute A+, cost of living A+, housing A+; Watch: employment C-, crime F.
- Columbus City School District (urban): math 15% / reading 26% proficiency, ranked #626 of 656 in OH (top 95%) — low school quality limits family demand, transient renter base, plan for 1-2y turnover; 72% free/reduced lunch — lower-income household profile, screen leases tightly.
- Market conditions: Rents rising (+2.3%/yr); 196 active listings in the ZIP; 40 comparable units currently listed for rent nearby; rentals at typical pace (median 24d on market — plan ~3-4 weeks tenant-placement turnaround); 45% of comp listings sitting > 30 days — soft ceiling on asking rent; 8,139 units permitted in Franklin County in 2024 (5,940 in 5+ unit buildings).
- This rent runs 32% of the median local income ($63k/yr) — at the standard rent-burdened threshold; future hikes will face affordability resistance.
Forward outlook
- Local home prices are declining (-3.0%/yr); year-one equity from $277 of loan paydown is wiped out by about $1k of value loss. Plan a longer hold.
- Franklin County population projected at +34% by 2050 — long-run rental-demand tailwind backs the buy-and-hold thesis.
- At projected returns (-3.0% appreciation + 2.3% rent growth), your $11k cash investment doubles in ~1 year — after that, you're playing with house money.
Negotiation context
- It's been on market 197 days — a 12% lower offer ($35k) is reasonable based on typical stale-listing flexibility.
- 4 sale attempts since 17y ago with the ask held roughly flat each time — persistent listings suggest the price (not the market) is what's stuck; bring a comps-based counter.
Risks & watch-outs
- Watch-outs: built in 1929 — expect roof / HVAC / electrical / plumbing capex.
Questions for the listing agent
- It's been on market 197 days. Have you received any prior offers? Is the seller open to a 12% concession, seller financing, or rate buy-down credit?
- Built in 1929 — when were the roof, HVAC, electrical panel, plumbing, and water heater last replaced?
- Why hasn't it sold? Are there any deal-killer items the seller is aware of (foundation, flood, title, zoning, code violations)?
- Is there a deadline driving the sale (1031 exchange, divorce, estate, relocation)? That informs how much negotiation room exists.
- Crime grade is F in this area — have there been break-ins, vandalism, or insurance claims at this property in the last 3 years? What carrier currently insures it and at what premium?
- The area grade is low — what's the realistic commute time and amenity access for the typical tenant pool here? Any planned neighborhood developments (good or bad) we should know about?
- What's the average days-on-market for RENTAL listings here right now (not sales)? A rising rental-DOM trend means longer vacancies and softer asking-rent achievability than the comps imply.
- What's the recent tenant-quality profile in this submarket — average credit score on applications, eviction rate, late-payment / NSF rate, and stable-employment percentage? A property-management company in the area should have these aggregated.
- How much new for-sale + rental construction is in the pipeline within 1–3 miles? Heavy new supply typically softens prices + rents 12–24 months out; constrained supply supports both.
Investment metrics
- 1% rule
- 4.25% ✓
- Cap rate
- 38.31%
- Cash-on-cash
- 114.34%
- DSCR
- 6.09
- GRM
- 2.0
CMA / ARV
- ARV (on-the-fly)
- $311,178
- Comps found
- 12
Show comp detail 12 sales within ~0.75 mi
| Address | Dist | Beds/Ba | Sqft | Sold | Price | $/sf | Match |
|---|---|---|---|---|---|---|---|
| 792 Thurman Ave | 0.35mi | 3/1.5 | 1,307 (+0%) | 1mo | $280,000 | $214 | 82 |
| 605 Frebis Ave | 0.11mi | 3/2.5 | 1,459 (+12%) | 1mo | $345,000 | $236 | 70 |
| 601 Frebis Ave | 0.11mi | 3/2.5 | 1,459 (+12%) | 2mo | $349,000 | $239 | 70 |
| 301 Southwood Ave | 0.56mi | 3/1.5 | 1,260 (-3%) | 1mo | $350,000 | $278 | 68 |
| 306 E Jenkins Ave | 0.53mi | 3/1.5 | 1,248 (-4%) | 1mo | $390,000 | $313 | 68 |
| 1576 Linwood Ave | 0.59mi | 3/1.5 | 1,272 (-2%) | 2mo | $245,000 | $193 | 67 |
| 1532 Parsons Ave | 0.35mi | 2/1.5 (-1) | 1,402 (+8%) | 1mo | $185,500 | $132 | 65 |
| 165 Frebis Ave | 0.73mi | 2/2.5 (-1) | 1,314 (+1%) | 1mo | $360,000 | $274 | 55 |
| 1329 Studer Ave | 0.70mi | 3/1.5 | 1,191 (-8%) | 1mo | $212,000 | $178 | 52 |
| 278 E Welch Ave | 0.62mi | 2/2.5 (-1) | 1,202 (-8%) | 1mo | $382,000 | $318 | 48 |
| 1403 Bruck St | 0.60mi | 2/2.0 (-1) | 1,428 (+10%) | 1mo | $395,000 | $277 | 48 |
| 959 Heyl Ave | 0.71mi | 2/2.5 (-1) | 1,176 (-10%) | 1mo | $260,000 | $221 | 41 |
Match score weights: distance 35% · size 25% · config 20% · recency 20%. Top-matched comps best support the ARV.
Projected returns pro-forma
-3.0% appreciation · 2.32% rent growth · sell at horizon
- IRR
- —
- Equity multiple
- 6.39×
- Total profit
- $60,357
- Equity at exit
- $5,964
- IRR
- —
- Equity multiple
- 13.10×
- Total profit
- $135,504
- Equity at exit
- $3,458
Cash invested: $11,200 (down + closing). Projections, not guarantees.
Landlord ↔ Tenant lean methodology
- Overall (STATE)
- 73 Landlord-Friendly
- State Ohio
- 73 Landlord-Friendly · R+6
- County
- — inherits STATE
- City
- — inherits STATE
ZIP-level market 43207
- Rents YoY
- 2.3%
- Active inventory
- 196
- Price-to-rent
- 2.0×
Monthly cashflow live
- Estimated rent
- $1,701 high interval (Pro) →
- Mortgage (P&I)
- −$210
- Tax est. 1.5%
- −$50 /mo · $600/yr
- Insurance
- −$17
- HOA
- −$0
- Vacancy / Maint / Mgmt
- −$357
- Net cashflow
- $1,067
Break-even live
Sensitivity live
| Price | -10% $1,095 | -5% $1,081 | +0% $1,067 | +5% $1,053 | +10% $1,040 |
|---|---|---|---|---|---|
| Rent | -10% $933 | -5% $1,000 | +0% $1,067 | +5% $1,134 | +10% $1,202 |
| Rate | -1.0pp $1,087 | -0.5pp $1,077 | base $1,067 | +0.5pp $1,057 | +1.0pp $1,046 |
UW: 25.0% down · 7.5% · 30yr · 1.5% tax · 5.0% vac · 8.0% maint · 8.0% mgmt
Financing live
Cash to close
- Down payment
- $10,000
- Closing costs
- $1,200
- Reserves months
- —
- Total cash needed
- —
Loan-product check · same deal, 3 products live
Conventional
25% down · 7.5% · 30yr
- Down + closing
- —
- Monthly P&I
- —
- Monthly cashflow
- —
- DSCR
- —
- Eligible?
- —
Personal DTI + credit; lowest rate.
DSCR
20% down · 8.5% · 30yr
- Down + closing
- —
- Monthly P&I
- —
- Monthly cashflow
- —
- DSCR
- —
- Eligible?
- —
No personal income docs; deal must DSCR.
Hard money
10% down · 12.0% · 12mo
- Down + closing
- —
- Monthly P&I
- —
- Monthly cashflow
- —
- DSCR
- —
- Eligible?
- —
Short-term bridge; refi at stabilization.
Rent comps 40 comps
| Address | Beds | Baths | Sqft | Rent | $/sqft | DOM | Units | Dist |
|---|---|---|---|---|---|---|---|---|
| 662 Southwood Ave Columbus, OH | 3.0 | 2.0 | 1183 | $1,950 | $1.65 | 20d | 1 | 0.20mi |
| 530 Hanford St Unit 1496117P Columbus, OH | 4.0 | 3.0 | 1862 | $7,310 | $3.93 | 2d | 1 | 0.20mi |
| 554 E Gates St Columbus, OH | 2.0 | 1.0 | 902 | $1,295 | $1.44 | 11d | 1 | 0.21mi |
| 546 E Jenkins Ave Unit 1 Columbus, OH | 2.0 | 1.0 | 975 | $1,295 | $1.33 | 24d | 1 | 0.22mi |
| 573 E Mithoff St Columbus, OH | 3.0 | 1.5 | 1300 | $2,100 | $1.62 | 44d | 1 | 0.25mi |
| 490-492 E Jenkins Ave Unit 490 Columbus, OH | 3.0 | 1.0 | 1050 | $1,325 | $1.26 | 44d | 1 | 0.28mi |
| 1416 S Ohio Ave Columbus, OH | 3.0 | 1.5 | 1056 | $1,595 | $1.51 | 22d | 1 | 0.31mi |
| 476 Southwood Ave Columbus, OH | 2.0 | 1.0 | 1219 | $1,400 | $1.15 | 44d | 1 | 0.32mi |
| 1175 Ann St Columbus, OH | 2.0 | 1.0 | 904 | $1,495 | $1.65 | 44d | 1 | 0.37mi |
| 506 Thurman Ave Columbus, OH | 3.0 | 1.0 | 1500 | $1,600 | $1.07 | 2d | 1 | 0.39mi |
| 529 E Morrill Ave Columbus, OH | 3.0 | 1.0 | 1318 | $1,600 | $1.21 | 4d | 1 | 0.44mi |
| 357 Frebis Ave #5 Columbus, OH | 3.0 | 3.5 | 1748 | $2,750 | $1.57 | 44d | 1 | 0.45mi |
| 396 E Mithoff St Columbus, OH | 3.0 | 1.5 | 1380 | $2,295 | $1.66 | 11d | 1 | 0.45mi |
| 1460 Oakwood Ave Columbus, OH | 2.0 | 1.0 | 901 | $900 | $1.00 | 15d | 1 | 0.45mi |
| 1460 Oakwood Ave Columbus, OH | 2.0 | 1.0 | 901 | $900 | $1.00 | 44d | 1 | 0.45mi |
| 1239-1241 S Champion Ave Columbus, OH | 3.0 | 1.0 | 1134 | $1,275 | $1.12 | 16d | 1 | 0.48mi |
| 761 Siebert St Columbus, OH | 2.0 | 2.0 | 1050 | $2,350 | $2.24 | 4d | 1 | 0.49mi |
| 1225 S Champion Ave Unit 1225 Columbus, OH | 3.0 | 1.0 | 1110 | $1,095 | $0.99 | 4d | 1 | 0.50mi |
| 1227 S Champion Ave Unit 1227 Columbus, OH | 3.0 | 1.0 | 1110 | $1,195 | $1.08 | 4d | 1 | 0.50mi |
| 1061 Parsons Ave Columbus, OH | 2.0 | 2.0 | 1408 | $1,950 | $1.38 | 44d | 1 | 0.55mi |
| 367 E Morrill Ave Columbus, OH | 2.0 | 1.0 | 977 | $1,450 | $1.48 | 44d | 1 | 0.59mi |
| 1118 S Ohio Ave Columbus, OH | 3.0 | 1.5 | 1232 | $1,750 | $1.42 | 44d | 1 | 0.60mi |
| 362 E Hinman Ave Columbus, OH | 2.0 | 1.0 | 879 | $1,149 | $1.31 | 44d | 1 | 0.62mi |
| 850 E Whittier St Columbus, OH | 3.0 | 2.0 | 1200 | $1,949 | $1.62 | 24d | 1 | 0.65mi |
| 966 S 18th St Columbus, OH | 3.0 | 1.5 | 1428 | $2,400 | $1.68 | 44d | 1 | 0.66mi |
| 205 E Moler St Unit B Columbus, OH | 2.0 | 1.0 | 891 | $995 | $1.12 | 8d | 1 | 0.66mi |
| 880 E Whittier St Columbus, OH | 2.0 | 1.5 | 1064 | $1,100 | $1.03 | 44d | 1 | 0.66mi |
| 461-463 Reinhard Ave Columbus, OH | 3.0 | 1.0 | 1134 | $1,450 | $1.28 | 3d | 1 | 0.66mi |
| 461-463 Reinhard Ave Unit 461 Columbus, OH | 3.0 | 1.0 | 1134 | $1,450 | $1.28 | 3d | 1 | 0.66mi |
| 1288 Linwood Ave Columbus, OH | 3.0 | 1.0 | 1344 | $1,900 | $1.41 | 44d | 1 | 0.68mi |
| 630 Stanley Ave Columbus, OH | 3.0 | 1.0 | 1300 | $1,949 | $1.50 | 24d | 1 | 0.70mi |
| 928 S 18th St Columbus, OH | 3.0 | 2.0 | 1216 | $1,995 | $1.64 | 44d | 1 | 0.71mi |
| 963 S 22nd St Columbus, OH | 3.0 | 2.0 | 1188 | $3,200 | $2.69 | 8d | 1 | 0.74mi |
| 1843 Parsons Ave Columbus, OH | 2.0 | 1.0 | 899 | $1,331 | $1.48 | 24d | 1 | 0.75mi |
| 977 S Ohio Ave Columbus, OH | 3.0 | 2.5 | 1650 | $2,500 | $1.52 | 44d | 1 | 0.76mi |
| 936 Wagner St Columbus, OH | 3.0 | 3.0 | 1560 | $2,750 | $1.76 | 24d | 1 | 0.77mi |
| 315 Siebert St Columbus, OH | 3.0 | 1.0 | 1597 | $2,200 | $1.38 | 24d | 1 | 0.77mi |
| 705 E Columbus St Columbus, OH | 3.0 | 1.0 | 1436 | $2,300 | $1.60 | 44d | 1 | 0.78mi |
| 877 Heyl Ave Columbus, OH | 2.0 | 1.0 | 1200 | $1,750 | $1.46 | 44d | 1 | 0.80mi |
| 206 E Woodrow Ave Columbus, OH | 2.0 | 1.0 | 999 | $1,295 | $1.30 | 44d | 1 | 0.81mi |
Listing history 12 events
-
2024-12-02status Pending
-
2017-12-18soldstatus $105,500
-
2016-04-04status Pending
-
2016-02-16status Active
-
2016-02-16historical
-
2016-01-18status Active
-
2016-01-16historical
-
2015-09-18$40,000 Active
-
2009-04-17soldstatus $27,000 192-char remark
Show marketing remark (192 chars)
FANTASTIC OPPORTUNITY! PURCHASE THIS PROPERTY FOR AS LITTLE AS 3% DOWN! THIS PROPERTY IS APPROVED FOR HOMEPATH RENOVATION MORTGAGE FINANCING. PLEASE CONTACT LISTING AGENT FOR MORE INFORMATION.
-
2009-04-07historical 192-char remark
Show marketing remark (192 chars)
FANTASTIC OPPORTUNITY! PURCHASE THIS PROPERTY FOR AS LITTLE AS 3% DOWN! THIS PROPERTY IS APPROVED FOR HOMEPATH RENOVATION MORTGAGE FINANCING. PLEASE CONTACT LISTING AGENT FOR MORE INFORMATION.
-
2009-03-16$29,000 192-char remark
Show marketing remark (192 chars)
FANTASTIC OPPORTUNITY! PURCHASE THIS PROPERTY FOR AS LITTLE AS 3% DOWN! THIS PROPERTY IS APPROVED FOR HOMEPATH RENOVATION MORTGAGE FINANCING. PLEASE CONTACT LISTING AGENT FOR MORE INFORMATION.
-
1990-09-04soldstatus $35,000
ⓘ Source: listings_history table (triggers on properties + properties_extension) + one-shot
backfill from property_details.listing_events for pre-trigger history.
Climate risk First Street
- Flood 1/10 Low FEMA zone X (unshaded) · 0% chance over 30 yrs
- Wildfire 1/10 Low
- Heat 4/10 Moderate 7 d/yr ≥100°F today · 18 d/yr by 30 yrs out
- Wind 2/10 Low 100% chance of damaging wind over 30 yrs
- Air quality 3/10 Moderate 2 unhealthy d/yr today · 3 by 30 yrs out
Nearby sold comps map
Loading sold comps map…
Walkable amenities ~0.75 mi
Loading nearby amenities…
Taxation est. · year 1
- Rental income
- $20,409
- − Mortgage interest
- −$2,241
- − Property taxes
- −$600
- − Insurance
- −$200
- − Repairs & maintenance
- −$1,633
- − Management
- −$1,633
- − Depreciation
- −$1,164
- Taxable income
- $12,939
- Est. tax owed @ 24.0%
- −$3,105
- After-tax cash flow
- $9,701/yr
For passive investors: Depreciation is non-cash, so a rental often shows a tax loss while cash-flowing — sheltering income. Rental losses are passive: they offset passive income freely, and up to $25,000/yr can offset ordinary (W-2) income if you actively participate and your MAGI is under $100k (phasing out to $0 by $150k); unused losses carry forward. On sale, claimed depreciation is recaptured at up to 25%, and gains may owe capital-gains tax (a 1031 exchange can defer both). Figures are a year-1 estimate at your 24.0% rate — not tax advice; consult a CPA.
Schools (NCES district)
- District
- Columbus City School District
- NCES district ID
- 3904380
- Math proficiency
- 15% ▼ -17.00%
- Reading proficiency
- 26% ▼ -12.00%
- Median HH income
- $38,483
- Composite
- 17.19/100
- National rank
- #9105
- State rank
- #626 of 656 in OH
Livability — Columbus
- Score
- 81/100
- State rank
- #97
- US rank
- #1491
Category grades
Schools grade is shown separately in the Schools card above.
Census & demographics
- Census place
- Columbus, OH
- County
- Franklin County · 1,351,780 people
- City population
- 612,189
- Metro
- Columbus, OH
- Population (ZIP)
- 47,272
- Household income
- $63,310
- Rent vs Own
- Severe rent burden
- 1679.0
Population outlook (Franklin County) Hauer SSP2
- Today (2025)
- 1,456,139 people
- By 2030
- 1,556,890 · +6.9%
- By 2040
- 1,757,349 · +20.7%
- By 2050
- 1,950,539 · +34.0%
- By 2075
- 2,376,171 · +63.2%
- By 2100
- 2,636,796 · +81.1%
Race, ethnicity, and origin ACS 2023
- Neighborhood character
- Diverse neighborhood (Simpson 0.57)
- Race & ethnicity
- White 59% Black 28% Two or more races 7% Hispanic / Latino 5% Asian 1%
- Hispanic origin (detail)
- Mexican 3%
- Common ancestry
- Italian 2% Romanian 2% Slovak 1%
- Foreign-born
- 4% · Canada
- Languages at home
- 95% English-only · Spanish 3% Other Indo-European 1%
Political lean MEDSL · Franklin
- 2024 margin
- Strong D (+28.4) · D 63.7% · R 35.3% · Other 1.0%
- 2008→2024 swing
- +7.7pp toward D · 2008: 20.7pp · 2024: 28.4pp
- All cycles
- 2024: D+28.4 2020: D+31.4 2016: D+25.9 2012: D+21.7 2008: D+20.7
Not yet ingested
- Civics
- —
Market trends
- HPI YoY
- ▼ -244.33%
- Current HPI
- 268.3028
- Rent YoY
- ▲ 2.32%
- Metro
- Columbus, OH
- State GDP YoY
- ▲ 1.98%
- F500 in state
- 48
Industry mix (Fortune 500 HQ in OH)
| Industry | F500 HQs | Revenue |
|---|---|---|
| Insurance | 3 | $145B |
|
||
| Industrial Machinery | 3 | $49B |
|
||
| Financial Services | 3 | $24B |
|
||
| Consumer Goods | 2 | $93B |
|
||
| Aerospace / Defense | 2 | $47B |
|
||
| Utilities | 2 | $33B |
|
||
Price history
+201.4% since first listed12 events — show timeline
- 2024-12-02 Pending — CBRMLS
- 2017-12-18 Sold (Public Records) $105,500 Public Records
- 2016-04-04 Pending — CBRMLS
- 2016-02-16 Relisted — CBRMLS
- 2016-02-16 Listing Removed — CBRMLS
- 2016-01-18 Relisted — CBRMLS
- 2016-01-16 Listing Removed — CBRMLS
- 2015-09-18 Listed $40,000 CBRMLS
- 2009-04-17 Sold (MLS) $27,000 CBRMLS
- 2009-04-07 Listing Removed — CBRMLS
- 2009-03-16 Listed $29,000 CBRMLS
- 1990-09-04 Sold (Public Records) $35,000 Public Records
Property tax history
+13.6%/yrLatest (2024): $3,245 · +1.3% YoY. Source: county tax records.
Cash-flow waterfall
monthlySold comps — $/sqft
last 12 mo · ≤1 miLoading sold comps…