 Multi-family
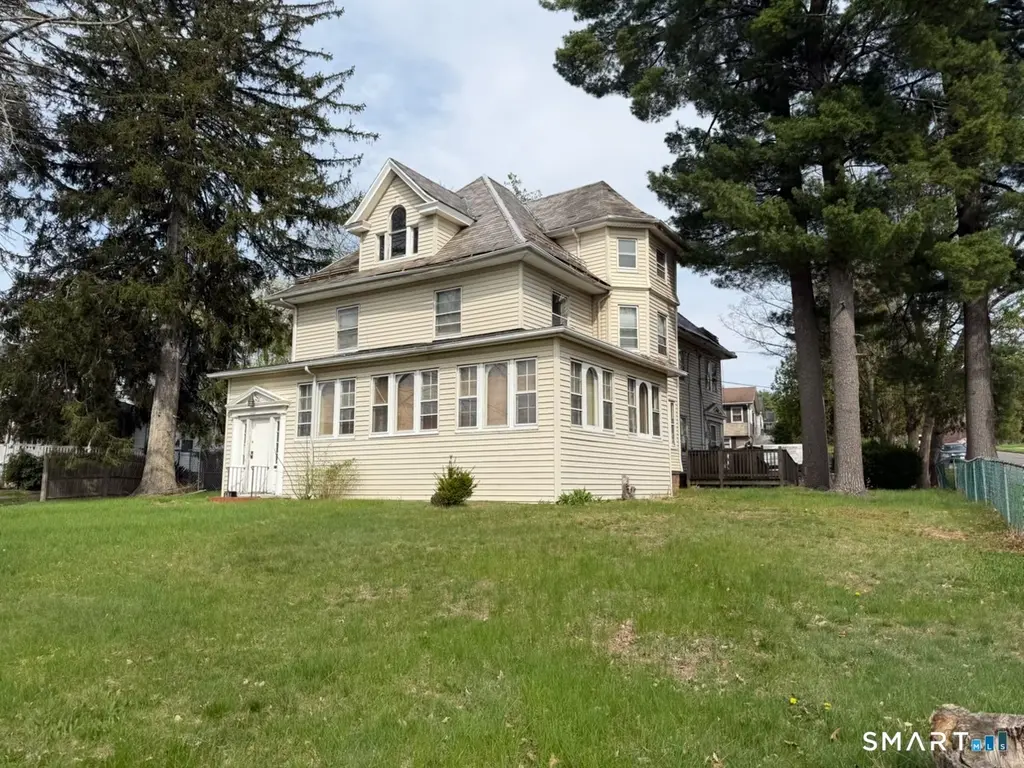
334 Blue Hills Ave · Hartford, CT
Flood risk 1/10 · Minimal
- FEMA flood zone
- X (unshaded)
- Chance of flooding over 30 yrs
- 0.0%
- Est. flood insurance / yr
- $473 – $860
Fire risk 1/10 · Minimal
- Est. fire insurance / yr
- $829 – $1,539
Heat risk 5/10 · Moderate
- Hot days now (above 97°F)
- 7 days/yr
- Hot days in 30 yrs
- 16 days/yr
Wind risk 6/10 · Moderate
- Chance of severe wind over 30 yrs
- 27.0%
Air-quality risk 3/10 · Minor
- Unhealthy air days now
- 3 days/yr
- Unhealthy air days in 30 yrs
- 4 days/yr
Risk factors via First Street. Map © Google.
Why this score? — see what drove the A- grade
The composite is a weighted blend of 9 inputs, each scored 0–100. Each bar is that input's sub-score; the figure is the points it added to the 100-point composite (weight × sub-score).
- Cash flow +30.0/30.0
- ARV discount +10.4/15.0
- 1% rule +10.0/10.0
- DSCR +10.0/10.0
- Appreciation +10.0/10.0
- Livability +3.8/5.0
- Rent growth +2.5/5.0
- Condition / age +2.2/5.0
- Schools +1.4/10.0
$399,925
🖨 Deal sheet (PDF) 📄 Offer letter ✓ Due diligence
Multi-family units
County records classify this as Multi-Family (2-4 Unit). Listing-text estimate: 1 unit. estimate disagrees with records
Listing remarks MLS
Spacious and unique multi-family opportunity offering exceptional potential in the city of Hartford. This expansive property features three full levels, each functioning as its own unit with separate kitchens and bathrooms on every floor, providing flexibility for extended living or income-producing possibilities. With a total of approximately 10-11 bedrooms throughout, 3.5 baths , the layout offers ample space to accommodate a variety of needs. The basement includes existing plumbing for an additional bathroom, presenting further opportunity for expansion or added value. Situated on a rare half-acre lot and offering over 5,000 square feet of living space, this property stands out for its size and versatility. While it requires renovation, it presents a strong opportunity for investors or owner-occupants looking to customize and maximize its full potential.
Key facts
- Half-acre lot
- Existing plumbing
- Separate kitchens
Tags
Neighborhood map
What this means for you Summary
Snapshot
- This is a 6-bed/4.0-bath multifamily listed at $400k. Condition is rated fair.
Deal economics
- At list price, monthly cash flow is $2k ($27k/yr) — positive.
- The deal already cash-flows at list — no discount required.
- Meets the 1% rule at list price ($6k rent vs $400k).
- Recommended offer: $388k (3.0% below list) — sets the bar for market timing.
Location & tenants
- Location reads 76/100 on livability (#58 in CT, #3,553 nationally) — a middle-class / working-renter tenant base. Strengths: amenities A+, commute A+, health & safety A+; Watch: crime F, employment F.
- Hartford School District (urban): math 13% / reading 21% proficiency, ranked #150 of 153 in CT (top 98%) — low school quality limits family demand, transient renter base, plan for 1-2y turnover; 84% free/reduced lunch — lower-income household profile, screen leases tightly.
- Zoned schools: Webster Micro Society Magnet School (math 22% / reading 29%, grade F, #418 of 553 statewide, top 76%, 615 students, 62% FRL); Renzulli Gifted And Talented Academy (math 52% / reading 72%, grade B+, #38 of 175 statewide, top 21%, 119 students, 72% FRL); University High School of Science And Engineering (math 37% / reading 42%, grade F, #107 of 194 statewide, top 56%, 412 students, 66% FRL) — zoned schools average 67% FRL vs 84% district-wide (17 pts lower); this property's tenant base skews higher-income than the district average.
- Zoned-school proficiency averages 42% at this address vs 17% district-wide (+25 pts) — the actual schools serving this property are materially stronger than the Hartford School District average implies; a family-tenant draw the district grade alone would hide.
- Market conditions: 47 active listings in the ZIP; lower-income renter base — watch delinquency; 1,867 units permitted in Capitol Planning Region in 2024 (1,399 in 5+ unit buildings).
- At $6,384/mo this rent would consume 172% of the median local household income ($44k/yr) (locally 1466% of renters already pay >50% of income on rent) — very limited rent-growth headroom before tenants either downsize or default.
Forward outlook
- In year one you build about $43k of equity ($3k loan paydown + $40k appreciation (10.0% local appreciation)).
- At projected returns (10.0% appreciation + 3.0% rent growth), your $112k cash investment doubles in ~2 years — after that, you're playing with house money.
- By year 2, paydown + projected appreciation supports a ~$69k cash-out refi (75% LTV) — recoverable capital for the next deal without selling this one.
Negotiation context
- It's been on market 43 days — a 3% lower offer ($388k) is reasonable based on typical stale-listing flexibility.
Risks & watch-outs
- Watch-outs: built in 1900 — expect roof / HVAC / electrical / plumbing capex.
- Climate carrying-cost: major wind risk, 27% chance of damaging wind over 30y; extreme-heat days projected 7→16/yr by 2055 (HVAC capex compounding) — expect insurance premiums to compound above CPI over the hold.
Questions for the listing agent
- It's been on market 43 days. Have you received any prior offers? Is the seller open to a 3% concession, seller financing, or rate buy-down credit?
- Have any recent inspections been done? Can we get a copy of the seller's disclosures and any deferred-maintenance estimates?
- Built in 1900 — when were the roof, HVAC, electrical panel, plumbing, and water heater last replaced?
- Is there a deadline driving the sale (1031 exchange, divorce, estate, relocation)? That informs how much negotiation room exists.
- Schools are D-rated, which usually means shorter tenancies and higher turnover. Who's the typical renter profile here, and what's been the actual vacancy rate?
- Crime grade is F in this area — have there been break-ins, vandalism, or insurance claims at this property in the last 3 years? What carrier currently insures it and at what premium?
- What's the average days-on-market for RENTAL listings here right now (not sales)? A rising rental-DOM trend means longer vacancies and softer asking-rent achievability than the comps imply.
- What's the recent tenant-quality profile in this submarket — average credit score on applications, eviction rate, late-payment / NSF rate, and stable-employment percentage? A property-management company in the area should have these aggregated.
- How much new apartment / multifamily construction is in the pipeline within 1–3 miles? Heavy new supply (>2% of stock underway) typically softens rents 12–24 months out; light construction supports rent growth.
Investment metrics
- 1% rule
- 1.60% ✓
- Cap rate
- 13.13%
- Cash-on-cash
- 24.43%
- DSCR
- 2.09
- GRM
- 5.2
CMA / ARV
- ARV (median comp)
- $427,224
- List price
- $399,925
- Delta
- -6.39%
- Verdict
- FAIR
- Comps
- 1 within 2.0 mi
Projected returns pro-forma
10.0% appreciation · 3.0% rent growth · sell at horizon
- IRR
- 42.7%
- Equity multiple
- 4.24×
- Total profit
- $363,093
- Equity at exit
- $360,284
- IRR
- 36.9%
- Equity multiple
- 9.53×
- Total profit
- $955,267
- Equity at exit
- $776,966
Cash invested: $111,979 (down + closing). Projections, not guarantees.
Landlord ↔ Tenant lean methodology
- Overall (STATE)
- 27 Tenant-Leaning
- State Connecticut
- 27 Tenant-Leaning · D+7
- County
- — inherits STATE
- City
- — inherits STATE
ZIP-level market 06112
- Home prices YoY
- 4.9%
- Active inventory
- 47
- Price-to-rent
- 15.7×
Monthly cashflow live
- Estimated rent
- $6,384 medium interval (Pro) →
- Mortgage (P&I)
- −$2,097
- Tax est. 1.5%
- −$500 /mo · $5,999/yr
- Insurance
- −$167
- HOA
- −$0
- Vacancy / Maint / Mgmt
- −$1,341
- Net cashflow
- $2,280
Break-even live
Sensitivity live
| Price | -10% $2,556 | -5% $2,418 | +0% $2,280 | +5% $2,141 | +10% $2,003 |
|---|---|---|---|---|---|
| Rent | -10% $1,775 | -5% $2,027 | +0% $2,280 | +5% $2,532 | +10% $2,784 |
| Rate | -1.0pp $2,481 | -0.5pp $2,381 | base $2,280 | +0.5pp $2,176 | +1.0pp $2,071 |
3-unit breakdown (identical units grouped — click to expand)
| Units | Beds | Baths | Est. rent |
|---|---|---|---|
| 3× units | 3 | 1 | $6,384 |
| #1 | 3 | 1 | $2,128 |
| #2 | 3 | 1 | $2,128 |
| #3 | 3 | 1 | $2,128 |
| Total (3 units) | $6,384 | ||
UW: 25.0% down · 7.5% · 30yr · 1.5% tax · 5.0% vac · 8.0% maint · 8.0% mgmt
Financing live
Cash to close
- Down payment
- $99,981
- Closing costs
- $11,998
- Reserves months
- —
- Total cash needed
- —
Loan-product check · same deal, 3 products live
Conventional
25% down · 7.5% · 30yr
- Down + closing
- —
- Monthly P&I
- —
- Monthly cashflow
- —
- DSCR
- —
- Eligible?
- —
Personal DTI + credit; lowest rate.
DSCR
20% down · 8.5% · 30yr
- Down + closing
- —
- Monthly P&I
- —
- Monthly cashflow
- —
- DSCR
- —
- Eligible?
- —
No personal income docs; deal must DSCR.
Hard money
10% down · 12.0% · 12mo
- Down + closing
- —
- Monthly P&I
- —
- Monthly cashflow
- —
- DSCR
- —
- Eligible?
- —
Short-term bridge; refi at stabilization.
Listing history 2 events
-
2026-05-31days on market $399,925 Active 43 DOM
-
2026-04-18$399,925 Active 869-char remark
Show marketing remark (869 chars)
Spacious and unique multi-family opportunity offering exceptional potential in the city of Hartford. This expansive property features three full levels, each functioning as its own unit with separate kitchens and bathrooms on every floor, providing flexibility for extended living or income-producing possibilities. With a total of approximately 10-11 bedrooms throughout, 3.5 baths , the layout offers ample space to accommodate a variety of needs. The basement includes existing plumbing for an additional bathroom, presenting further opportunity for expansion or added value. Situated on a rare half-acre lot and offering over 5,000 square feet of living space, this property stands out for its size and versatility. While it requires renovation, it presents a strong opportunity for investors or owner-occupants looking to customize and maximize its full potential.
ⓘ Source: listings_history table (triggers on properties + properties_extension) + one-shot
backfill from property_details.listing_events for pre-trigger history.
Climate risk First Street
- Flood 1/10 Low FEMA zone X (unshaded) · 0% chance over 30 yrs
- Wildfire 1/10 Low
- Heat 5/10 Major 7 d/yr ≥97°F today · 16 d/yr by 30 yrs out
- Wind 6/10 Major 27% chance of damaging wind over 30 yrs
- Air quality 3/10 Moderate 3 unhealthy d/yr today · 4 by 30 yrs out
Nearby sold comps map
Loading sold comps map…
Walkable amenities ~0.75 mi
Loading nearby amenities…
Taxation est. · year 1
- Rental income
- $76,608
- − Mortgage interest
- −$22,402
- − Property taxes
- −$5,999
- − Insurance
- −$2,000
- − Repairs & maintenance
- −$6,129
- − Management
- −$6,129
- − Depreciation
- −$11,634
- Taxable income
- $22,316
- Est. tax owed @ 24.0%
- −$5,356
- After-tax cash flow
- $21,999/yr
For passive investors: Depreciation is non-cash, so a rental often shows a tax loss while cash-flowing — sheltering income. Rental losses are passive: they offset passive income freely, and up to $25,000/yr can offset ordinary (W-2) income if you actively participate and your MAGI is under $100k (phasing out to $0 by $150k); unused losses carry forward. On sale, claimed depreciation is recaptured at up to 25%, and gains may owe capital-gains tax (a 1031 exchange can defer both). Figures are a year-1 estimate at your 24.0% rate — not tax advice; consult a CPA.
Condition & rehab AI · 12 photos
This multi-family property requires moderate renovations, focusing on kitchen appliances, bathrooms, and interior painting. Landscaping and HVAC maintenance are also needed. The property has good potential for increased value with these updates.
Repairs flagged
- Major kitchen appliances — Old and worn, need replacement.
- Major bathroom fixtures — Outdated, need replacement.
- Major interior walls — Paint peeling, needs repainting.
- Major landscaping — Overgrown, needs trimming and mulching.
Value-add opportunities
- Resale Kitchen appliances — Modern appliances will attract buyers.
- Resale Bathroom fixtures — Up-to-date fixtures will appeal to buyers.
- Both Paint touch-up — Fresh paint will improve curb appeal and interior condition.
- Both Landscaping — A well-maintained yard will enhance curb appeal and attract tenants.
- Both HVAC maintenance — A clean and efficient HVAC system will attract buyers and tenants.
- Both Flooring inspection — Inspect for any hidden damage and replace if necessary.
Renovation cost estimate screening
| Repair item | Severity | Est. cost |
|---|---|---|
| kitchen appliances · Old and worn, need replacement. | Major | $15,000–50,000 |
| bathroom fixtures · Outdated, need replacement. | Major | $15,000–50,000 |
| interior walls · Paint peeling, needs repainting. | Major | $15,000–50,000 |
| landscaping · Overgrown, needs trimming and mulching. | Major | $15,000–50,000 |
| Total estimated repair cost · 4 items | $60,000–200,000 |
Value-add ROI direction
- Resale Kitchen appliances — Modern appliances will attract buyers. ↑
- Resale Bathroom fixtures — Up-to-date fixtures will appeal to buyers. ↑
- Both Paint touch-up — Fresh paint will improve curb appeal and interior condition. ↑
- Both Landscaping — A well-maintained yard will enhance curb appeal and attract tenants. ↑
- Both HVAC maintenance — A clean and efficient HVAC system will attract buyers and tenants. ↑
- Both Flooring inspection — Inspect for any hidden damage and replace if necessary. ↑
ⓘ Cost ranges are severity-bucket heuristics (US national rule-of-thumb). Get contractor quotes + a written scope before underwriting a rehab budget.
Schools (NCES district)
- District
- Hartford School District
- NCES district ID
- 0901920
- Math proficiency
- 13% ▼ -5.00%
- Reading proficiency
- 21% ▼ -6.00%
- Median HH income
- $30,521
- Composite
- 13.54/100
- National rank
- #9514
- State rank
- #150 of 153 in CT
Livability — Hartford
- Score
- 76/100
- State rank
- #58
- US rank
- #3553
Category grades
Schools grade is shown separately in the Schools card above.
Census & demographics
- Census place
- Hartford, CT
- County
- Hartford County · 754,208 people
- City population
- 121,162
- Metro
- Hartford-East Hartford-Middletown, CT
- Population (ZIP)
- 22,333
- Household income
- $44,460
- Rent vs Own
- Severe rent burden
- 1466.0
Population outlook (Capitol County) Hauer SSP2
- By 2040
- 1,063,519
Race, ethnicity, and origin ACS 2023
- Neighborhood character
- Predominantly Black (68%)
- Race & ethnicity
- Black 68% Hispanic / Latino 19% White 9% Two or more races 6%
- Hispanic origin (detail)
- Puerto Rican 15% Dominican 1%
- Common ancestry
- Hispanic 2%
- Foreign-born
- 26% · Canada
- Languages at home
- 81% English-only · Spanish 14% French/Haitian/Cajun 2% Other Indo-European 1%
Political lean MEDSL · Capitol
- 2024 margin
- Strong D (+21.9) · D 60.1% · R 38.2% · Other 1.7%
- All cycles
- 2024: D+21.9
Not yet ingested
- Civics
- —
Market trends
- HPI YoY
- ▲ 14.58%
- Current HPI
- 310.7763
- Rent YoY
- —
- Metro
- Hartford-East Hartford-Middletown, CT
- State GDP YoY
- ▲ 1.06%
- F500 in state
- 38
Industry mix (Fortune 500 HQ in CT)
| Industry | F500 HQs | Revenue |
|---|---|---|
| Industrial Machinery | 4 | $38B |
|
||
| Insurance | 3 | $71B |
|
||
| Financial Services | 2 | $25B |
|
||
| Transportation / Logistics | 2 | $18B |
|
||
| Healthcare | 1 | $247B |
|
||
| Telecommunications | 1 | $55B |
|
||
Price history
1 event — show timeline
- 2026-04-18 Listed $399,925 Smart MLS
Cash-flow waterfall
monthlySold comps — $/sqft
last 12 mo · ≤1 miLoading sold comps…