2997 Berry Farm Rd · Carlisle, SC
Flood risk 1/10 · Minimal
- FEMA flood zone
- X (unshaded)
- Chance of flooding over 30 yrs
- 0.0%
- Est. flood insurance / yr
- $507 – $1,088
Fire risk 3/10 · Minor
- Est. fire insurance / yr
- $783 – $1,453
Heat risk 6/10 · Moderate
- Hot days now (above 107°F)
- 7 days/yr
- Hot days in 30 yrs
- 16 days/yr
Wind risk 4/10 · Minor
- Chance of severe wind over 30 yrs
- 15.0%
Air-quality risk 2/10 · Minimal
- Unhealthy air days now
- 1 days/yr
- Unhealthy air days in 30 yrs
- 1 days/yr
Risk factors via First Street. Map © Google.
Why this score? — see what drove the B grade
The composite is a weighted blend of 9 inputs, each scored 0–100. Each bar is that input's sub-score; the figure is the points it added to the 100-point composite (weight × sub-score).
- Cash flow +30.0/30.0
- 1% rule +10.0/10.0
- DSCR +10.0/10.0
- ARV discount +7.5/15.0
- Appreciation +3.3/10.0
- Livability +2.7/5.0
- Rent growth +2.5/5.0
- Condition / age +2.5/5.0
- Schools +2.3/10.0
$49,900
🖨 Deal sheet 📄 Offer letter ✓ Due diligence
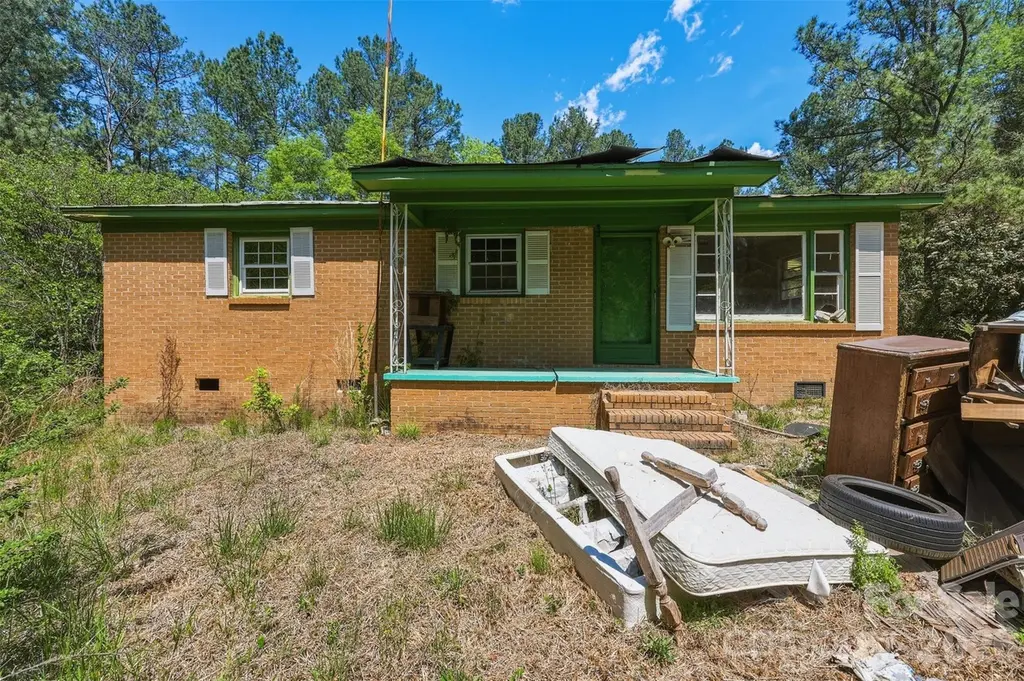
Listing remarks
Investor Special / Handyman Special! Opportunity knocks at 2997 Berry Farm Rd! This all-brick 3-bedroom, 1-bath home sits on a spacious 1-acre lot, offering the perfect canvas for your next fix-and-flip or rental project. Ideal for investors, cash buyers, or buyers looking to bring their vision to life. With plenty of land and room for improvement, the upside potential is there for the right buyer. Whether you're looking to renovate, expand, or hold as a long-term investment, this property presents a strong value-add opportunity. Sold as-is.
Key facts
- 1 acre lot
- Listed 61 days
Property features AI
Finance
- HOA & community: No HOA
Exterior
- Parking: Driveway
- Utilities: No water source specified; No sewer specified
- Home design: Single-family residence; Residential property; One story; Site-built construction; Brick exterior
- Construction: Crawl space foundation
- Exterior features: Concrete road access; Publicly maintained road
Interior
- Kitchen: No appliances listed
- Bedrooms: 3 bedrooms on the main level
- Bathrooms: 1 full bathroom on the main level
- Heating & cooling: No heating system specified; No cooling system specified
- Interior features: One-level living; Entry level: Ground floor
- Laundry & utility: No laundry facilities
Neighborhood map
What this means for you Summary
Snapshot
- This is a 3-bed/1.0-bath single-family listed at $50k.
Deal economics
- At list price, monthly cash flow is $528 ($6k/yr) — positive.
- The deal already cash-flows at list — no discount required.
- Meets the 1% rule at list price ($1k rent vs $50k).
- Recommended offer: $47k (6.0% below list) — sets the bar for market timing.
Location & tenants
- Location reads 54/100 on livability (#325 in SC) — a working-class tenant base; expect higher turnover. Strengths: cost of living A+, housing A+; Watch: schools F, crime F, amenities F.
- Union 01 (town): math 23% / reading 33% proficiency, ranked #60 of 80 in SC (top 75%) — low school quality limits family demand, transient renter base, plan for 1-2y turnover; 64% free/reduced lunch — lower-income household profile, screen leases tightly.
- Market conditions: 4 active listings in the ZIP; 57 units permitted in Union County in 2024 (0 in 5+ unit buildings).
Forward outlook
- Local home prices are declining (-3.0%/yr); year-one equity from $345 of loan paydown is wiped out by about $1k of value loss. Plan a longer hold.
- Union County population projected at -28% by 2050 — secular population decline; favor cash flow + early exit over multi-decade hold.
- At projected returns (-3.0% appreciation + 3.0% rent growth), your $14k cash investment doubles in ~3 years — after that, you're playing with house money.
Negotiation context
- It's been on market 62 days — a 6% lower offer ($47k) is reasonable based on typical stale-listing flexibility.
Risks & watch-outs
- Climate carrying-cost: extreme-heat days projected 7→16/yr by 2055 (HVAC capex compounding) — expect insurance premiums to compound above CPI over the hold.
Questions for the listing agent
- It's been on market 62 days. Have you received any prior offers? Is the seller open to a 6% concession, seller financing, or rate buy-down credit?
- Why hasn't it sold? Are there any deal-killer items the seller is aware of (foundation, flood, title, zoning, code violations)?
- Is there a deadline driving the sale (1031 exchange, divorce, estate, relocation)? That informs how much negotiation room exists.
- Schools are F-rated, which usually means shorter tenancies and higher turnover. Who's the typical renter profile here, and what's been the actual vacancy rate?
- Crime grade is F in this area — have there been break-ins, vandalism, or insurance claims at this property in the last 3 years? What carrier currently insures it and at what premium?
- What's the average days-on-market for RENTAL listings here right now (not sales)? A rising rental-DOM trend means longer vacancies and softer asking-rent achievability than the comps imply.
- What's the recent tenant-quality profile in this submarket — average credit score on applications, eviction rate, late-payment / NSF rate, and stable-employment percentage? A property-management company in the area should have these aggregated.
- How much new for-sale + rental construction is in the pipeline within 1–3 miles? Heavy new supply typically softens prices + rents 12–24 months out; constrained supply supports both.
Investment metrics
- 1% rule
- 2.10% ✓
- Cap rate
- 19.00%
- Cash-on-cash
- 45.39%
- DSCR
- 3.02
- GRM
- 4.0
CMA / ARV
No comps found within radius.
Projected returns pro-forma
-3.0% appreciation · 3.0% rent growth · sell at horizon
- IRR
- 42.5%
- Equity multiple
- 2.83×
- Total profit
- $25,559
- Equity at exit
- $7,440
- IRR
- 48.6%
- Equity multiple
- 5.69×
- Total profit
- $65,547
- Equity at exit
- $4,314
Cash invested: $13,972 (down + closing). Projections, not guarantees.
Landlord ↔ Tenant lean methodology
- Overall (STATE)
- 90 Strongly Landlord-Friendly
- State South Carolina
- 90 Strongly Landlord-Friendly · R+6
- County
- — inherits STATE
- City
- — inherits STATE
ZIP-level market 29031
- Home prices YoY
- -1.6%
- Active inventory
- 4
- Price-to-rent
- 4.0×
Monthly cashflow live
- Estimated rent
- $1,049 medium interval (Pro) →
- Mortgage (P&I)
- −$262
- Tax from tax record
- −$18 /mo · $214/yr
- Insurance
- −$21
- HOA
- −$0
- Vacancy / Maint / Mgmt
- −$220
- Net cashflow
- $528
Break-even live
UW: 25.0% down · 7.5% · 30yr · 1.5% tax · 5.0% vac · 8.0% maint · 8.0% mgmt
Financing live
Cash to close
- Down payment
- $12,475
- Closing costs
- $1,497
- Reserves months
- —
- Total cash needed
- —
Loan-product check · same deal, 3 products live
Conventional
25% down · 7.5% · 30yr
- Down + closing
- —
- Monthly P&I
- —
- Monthly cashflow
- —
- DSCR
- —
- Eligible?
- —
Personal DTI + credit; lowest rate.
DSCR
20% down · 8.5% · 30yr
- Down + closing
- —
- Monthly P&I
- —
- Monthly cashflow
- —
- DSCR
- —
- Eligible?
- —
No personal income docs; deal must DSCR.
Hard money
10% down · 12.0% · 12mo
- Down + closing
- —
- Monthly P&I
- —
- Monthly cashflow
- —
- DSCR
- —
- Eligible?
- —
Short-term bridge; refi at stabilization.
Listing history 19 events
-
2026-06-19days on market $49,900 Active 62 DOM
-
2026-06-18days on market $49,900 Active 61 DOM
-
2026-06-17days on market $49,900 Active 60 DOM
-
2026-06-16days on market $49,900 Active 59 DOM
-
2026-06-15days on market $49,900 Active 58 DOM
-
2026-06-14days on market $49,900 Active 56 DOM
-
2026-06-12days on market $49,900 Active 55 DOM
-
2026-06-09days on market $49,900 Active 52 DOM
-
2026-06-08days on market $49,900 Active 51 DOM
-
2026-06-07days on market $49,900 Active 50 DOM
-
2026-06-05days on market $49,900 Active 47 DOM
-
2026-06-03days on market $49,900 Active 46 DOM
-
2026-06-02days on market $49,900 Active 45 DOM
-
2026-06-01days on market $49,900 Active 44 DOM
-
2026-05-31days on market $49,900 Active 43 DOM
-
2026-05-30days on market $49,900 Active 42 DOM
-
2026-04-23price $49,900
-
2026-04-19$54,900 Active
-
2026-04-15historical $54,900
ⓘ Source: listings_history table (triggers on properties + properties_extension) + one-shot
backfill from property_details.listing_events for pre-trigger history.
Tax reassessment forecast SC · Resets to sale price
- Current annual tax
- $214 · $18/mo
- Projected year-2 tax
- $284 · $24/mo
- Expected delta
- +$70/yr (+$6/mo · 32.9%)
ⓘ Screening estimate from a state-policy table — verify with the county assessor before closing.
Climate risk First Street
- Flood 1/10 Low FEMA zone X (unshaded) · 0% chance over 30 yrs
- Wildfire 3/10 Moderate
- Heat 6/10 Major 7 d/yr ≥107°F today · 16 d/yr by 30 yrs out
- Wind 4/10 Moderate 15% chance of damaging wind over 30 yrs
- Air quality 2/10 Low 1 unhealthy d/yr today · 1 by 30 yrs out
Nearby sold comps map
Loading sold comps map…
Walkable amenities ~0.75 mi
Loading nearby amenities…
Taxation est. · year 1
- Rental income
- $12,588
- − Mortgage interest
- −$2,795
- − Property taxes
- −$214
- − Insurance
- −$250
- − Repairs & maintenance
- −$1,007
- − Management
- −$1,007
- − Depreciation
- −$1,452
- Taxable income
- $5,864
- Est. tax owed @ 24.0%
- −$1,407
- After-tax cash flow
- $4,934/yr
For passive investors: Depreciation is non-cash, so a rental often shows a tax loss while cash-flowing — sheltering income. Rental losses are passive: they offset passive income freely, and up to $25,000/yr can offset ordinary (W-2) income if you actively participate and your MAGI is under $100k (phasing out to $0 by $150k); unused losses carry forward. On sale, claimed depreciation is recaptured at up to 25%, and gains may owe capital-gains tax (a 1031 exchange can defer both). Figures are a year-1 estimate at your 24.0% rate — not tax advice; consult a CPA.
Schools (NCES district)
- District
- Union 01
- NCES district ID
- 4503750
- Math proficiency
- 23% ▼ -9.00%
- Reading proficiency
- 33% ▬ 0.00%
- Median HH income
- $34,709
- Composite
- 23.05/100
- National rank
- #7971
- State rank
- #60 of 80 in SC
Livability — Carlisle
- Score
- 54/100
- State rank
- #325
- US rank
- #24001
Category grades
Schools grade is shown separately in the Schools card above.
Census & demographics
- Population (ZIP)
- 1,747
Population outlook (Union County) Hauer SSP2
- Today (2025)
- 25,518 people
- By 2030
- 24,099 · -5.6%
- By 2040
- 21,133 · -17.2%
- By 2050
- 18,314 · -28.2%
- By 2075
- 13,235 · -48.1%
- By 2100
- 9,565 · -62.5%
Race, ethnicity, and origin ACS 2023
- Neighborhood character
- Predominantly Black (69%)
- Race & ethnicity
- Black 69% White 24%
- Common ancestry
- Serbian 1%
- Foreign-born
- 0%
Political lean MEDSL · Union
- 2024 margin
- Solid R (+32.7) · D 33.2% · R 65.9%
- 2008→2024 swing
- -21.5pp toward R · 2008: -11.2pp · 2024: -32.7pp
- All cycles
- 2024: R+32.7 2020: R+24.5 2016: R+19.3 2012: R+6.5 2008: R+11.2
Not yet ingested
- Civics
- —
Market trends
- HPI YoY
- ▼ -3.47%
- Current HPI
- 214.4185
- Rent YoY
- —
- Metro
- —
- State GDP YoY
- ▲ 4.51%
- F500 in state
- 2
Industry mix (Fortune 500 HQ in SC)
| Industry | F500 HQs | Revenue |
|---|---|---|
| Packaging | 1 | $7B |
|
||
Price history
-9.1% since first listed3 events — show timeline
- 2026-04-23 Price Changed $49,900 CANOPYMLS as Distributed by MLS Grid
- 2026-04-19 Listed $54,900 CANOPYMLS as Distributed by MLS Grid
- 2026-04-15 Coming Soon $54,900 CANOPYMLS as Distributed by MLS Grid
Property tax history
+16.6%/yrLatest (2015): $214 · +30.5% YoY. Source: county tax records.
Cash-flow waterfall
monthlySold comps — $/sqft
last 12 mo · ≤1 miLoading sold comps…