 Triplex
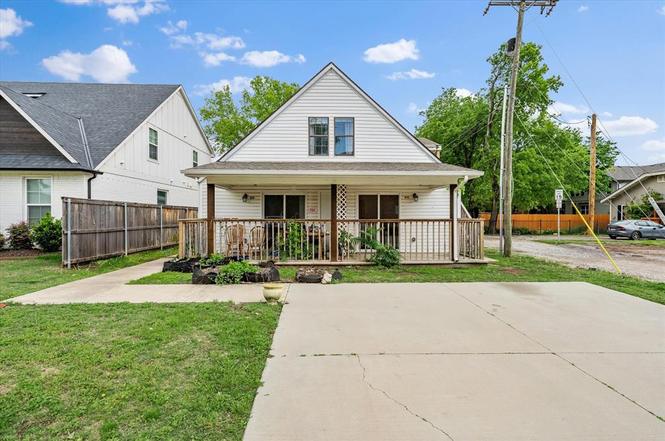
414 Ferrill St #416 · Norman, OK
Flood risk 1/10 · Minimal
- FEMA flood zone
- X (unshaded)
- Chance of flooding over 30 yrs
- 0.0%
- Est. flood insurance / yr
- $507 – $1,088
Fire risk 4/10 · Minor
- Est. fire insurance / yr
- $2,463 – $4,575
Heat risk 6/10 · Moderate
- Hot days now (above 108°F)
- 7 days/yr
- Hot days in 30 yrs
- 19 days/yr
Wind risk 3/10 · Minor
- Chance of severe wind over 30 yrs
- 5.0%
Air-quality risk 2/10 · Minimal
- Unhealthy air days now
- 1 days/yr
- Unhealthy air days in 30 yrs
- 1 days/yr
Risk factors via First Street. Map © Google.
Why this score? — see what drove the B- grade
The composite is a weighted blend of 9 inputs, each scored 0–100. Each bar is that input's sub-score; the figure is the points it added to the 100-point composite (weight × sub-score).
- Cash flow +30.0/30.0
- DSCR +10.0/10.0
- 1% rule +8.1/10.0
- ARV discount +6.6/15.0
- Livability +4.2/5.0
- Rent growth +3.2/5.0
- Schools +2.6/10.0
- Condition / age +2.5/5.0
- Appreciation +0.0/10.0
$365,000
🖨 Deal sheet (PDF) 📄 Offer letter ✓ Due diligence
Multi-family units
County records classify this as Multi-Family (2-4 Unit). Listing-text estimate: 3 units. confirmed
Listing remarks MLS
Remodeled and fully Leased triplex for sale. Located just North of the famous MONTE restaurant and a few blocks to The University of Oklahoma.
Key facts
- Triplex opportunity
- Prime location
- 6,098 sq ft lot
Tags
Neighborhood map
What this means for you Summary
Snapshot
- This is a 3 × 5-bed/3.0-bath units multifamily listed at $365k.
Deal economics
- At list price, monthly cash flow is $1k ($18k/yr) — positive. Per door: $486/mo.
- The deal already cash-flows at list — no discount required.
- Meets the 1% rule at list price ($5k rent vs $365k).
- Recommended offer: $321k (12.0% below list) — sets the bar for market timing.
- Cap rate 11.1% vs local median 3.6% in Norman — top-decile yield for the area; either an underpriced asset or a hidden risk that comps aren't pricing in. Stress-test before assuming the spread holds.
Location & tenants
- Location reads 85/100 on livability (#1 in OK, #557 nationally) — a professional / high-income tenant draw. Strengths: amenities A+, commute A+, cost of living A+.
- Norman (suburban): math 27% / reading 32% proficiency, ranked #61 of 270 in OK (top 23%) — low school quality limits family demand, transient renter base, plan for 1-2y turnover.
- Zoned schools: Lincoln Es (math 42% / reading 37%, grade F, #107 of 845 statewide, top 14%, 283 students, 0% FRL); Irving Ms (math 14% / reading 20%, grade F, #193 of 345 statewide, top 60%, 788 students, 0% FRL); Norman Hs (math 27% / reading 44%, grade F, #46 of 447 statewide, top 10%, 2,137 students, 0% FRL) — zoned schools average 0% FRL vs 39% district-wide (39 pts lower); this property's tenant base skews higher-income than the district average.
- Market conditions: Rents rising (+2.8%/yr); 356 active listings in the ZIP; 12 comparable units currently listed for rent nearby; rentals at typical pace (median 17d on market — plan ~3-4 weeks tenant-placement turnaround); 592 units permitted in Cleveland County in 2024 (12 in 5+ unit buildings).
Forward outlook
- Local home prices are declining (-3.0%/yr); year-one equity from $3k of loan paydown is wiped out by about $11k of value loss. Plan a longer hold.
- Cleveland County population projected at +40% by 2050 — long-run rental-demand tailwind backs the buy-and-hold thesis.
- At projected returns (-3.0% appreciation + 2.8% rent growth), your $102k cash investment doubles in ~8 years — after that, you're playing with house money.
Negotiation context
- It's been on market 271 days — a 12% lower offer ($321k) is reasonable based on typical stale-listing flexibility.
- 7 sale attempts since 8y ago; this cycle's ask has dropped $65k (15%) from the opening price — seller is motivated, your offer sets the floor, not the list.
- Current owner paid $174k; list at $365k implies a 110% gain — meaningful room to come down on a strong offer.
Risks & watch-outs
- Watch-outs: built in 1940 — expect roof / HVAC / electrical / plumbing capex.
- Climate carrying-cost: extreme-heat days projected 7→19/yr by 2055 (HVAC capex compounding) — expect insurance premiums to compound above CPI over the hold.
Questions for the listing agent
- It's been on market 271 days. Have you received any prior offers? Is the seller open to a 12% concession, seller financing, or rate buy-down credit?
- Can we see the unit-by-unit rent roll, current vacancy, and any below-market leases? What's the average tenancy length?
- What capital expenditures (roof, boiler, parking lot, exteriors) have been made in the last 5 years, and what's planned in the next 2?
- Built in 1940 — when were the roof, HVAC, electrical panel, plumbing, and water heater last replaced?
- Why hasn't it sold? Are there any deal-killer items the seller is aware of (foundation, flood, title, zoning, code violations)?
- Is there a deadline driving the sale (1031 exchange, divorce, estate, relocation)? That informs how much negotiation room exists.
- What's the average days-on-market for RENTAL listings here right now (not sales)? A rising rental-DOM trend means longer vacancies and softer asking-rent achievability than the comps imply.
- What's the recent tenant-quality profile in this submarket — average credit score on applications, eviction rate, late-payment / NSF rate, and stable-employment percentage? A property-management company in the area should have these aggregated.
- How much new apartment / multifamily construction is in the pipeline within 1–3 miles? Heavy new supply (>2% of stock underway) typically softens rents 12–24 months out; light construction supports rent growth.
Investment metrics
- 1% rule
- 1.31% ✓
- Cap rate
- 11.09%
- Cash-on-cash
- 17.12%
- DSCR
- 1.76
- GRM
- 6.4
CMA / ARV
- ARV (on-the-fly)
- $357,504
- Comps found
- 2
Show comp detail 2 sales within ~0.75 mi
| Address | Dist | Beds/Ba | Sqft | Sold | Price | $/sf | Match |
|---|---|---|---|---|---|---|---|
| 414 Ferrill St #416 | 0.00mi | 5/3.0 | 1,824 (0%) | 1mo | $358,000 | $196 | 99 |
| 1501 Barkley St #1503 | 0.56mi | 5/3.0 | 1,891 (+4%) | 6mo | $271,000 | $143 | 63 |
Match score weights: distance 35% · size 25% · config 20% · recency 20%. Top-matched comps best support the ARV.
Projected returns pro-forma
-3.0% appreciation · 2.8% rent growth · sell at horizon
- IRR
- 8.2%
- Equity multiple
- 1.32×
- Total profit
- $32,723
- Equity at exit
- $54,423
- IRR
- 17.3%
- Equity multiple
- 2.41×
- Total profit
- $143,948
- Equity at exit
- $31,559
Cash invested: $102,200 (down + closing). Projections, not guarantees.
Landlord ↔ Tenant lean methodology
- Overall (STATE)
- 83 Strongly Landlord-Friendly
- State Oklahoma
- 83 Strongly Landlord-Friendly · R+20
- County
- — inherits STATE
- City
- — inherits STATE
ZIP-level market 73071
- Rents YoY
- 2.8%
- Active inventory
- 356
- Price-to-rent
- 19.1×
Monthly cashflow live
- Estimated rent
- $4,774 medium interval (Pro) →
- Mortgage (P&I)
- −$1,914
- Tax from tax record
- −$247 /mo · $2,963/yr
- Insurance
- −$152
- HOA
- −$0
- Lot rent
- −$0
- Vacancy / Maint / Mgmt
- −$1,003
- Net cashflow
- $1,458
Break-even live
Sensitivity live
| Price | -10% $1,665 | -5% $1,562 | +0% $1,458 | +5% $1,355 | +10% $1,252 |
|---|---|---|---|---|---|
| Rent | -10% $1,081 | -5% $1,270 | +0% $1,458 | +5% $1,647 | +10% $1,836 |
| Rate | -1.0pp $1,642 | -0.5pp $1,551 | base $1,458 | +0.5pp $1,364 | +1.0pp $1,268 |
3-unit breakdown (identical units grouped — click to expand)
| Units | Beds | Baths | Est. rent |
|---|---|---|---|
| 3× units | 5 | 3 | $4,773 |
| #1 | 5 | 3 | $1,591 |
| #2 | 5 | 3 | $1,591 |
| #3 | 5 | 3 | $1,591 |
| Total (3 units) | $4,774 | ||
UW: 25.0% down · 7.5% · 30yr · 1.5% tax · 5.0% vac · 8.0% maint · 8.0% mgmt
Financing live
Cash to close
- Down payment
- $91,250
- Closing costs
- $10,950
- Reserves months
- —
- Total cash needed
- —
Loan-product check · same deal, 3 products live
Conventional
25% down · 7.5% · 30yr
- Down + closing
- —
- Monthly P&I
- —
- Monthly cashflow
- —
- DSCR
- —
- Eligible?
- —
Personal DTI + credit; lowest rate.
DSCR
20% down · 8.5% · 30yr
- Down + closing
- —
- Monthly P&I
- —
- Monthly cashflow
- —
- DSCR
- —
- Eligible?
- —
No personal income docs; deal must DSCR.
Hard money
10% down · 12.0% · 12mo
- Down + closing
- —
- Monthly P&I
- —
- Monthly cashflow
- —
- DSCR
- —
- Eligible?
- —
Short-term bridge; refi at stabilization.
Rent comps 12 comps
| Address | Beds | Baths | Sqft | Rent | $/sqft | DOM | Units | Dist |
|---|---|---|---|---|---|---|---|---|
| 1005 Classen Blvd Norman, OK | 4.0 | 2.0 | 2018 | $2,700 | $1.34 | 5d | 1 | 0.01mi |
| 1301 Melisa Dr Norman, OK | 4.0 | 2.0 | 1775 | $2,000 | $1.13 | 13d | 1 | 0.57mi |
| 1149 W Brooks St Norman, OK | 1.0–4.0 | 1.0–2.0 | 1025 | $1,402 | $1.37 | 0d | 5 | 0.80mi |
| 1345 Columbia Cir Norman, OK | 4.0 | 2.0 | 1357 | $1,600 | $1.18 | 26d | 1 | 1.03mi |
| 1023 Chautauqua Ave Norman, OK | 4.0 | 1.0 | 1308 | $2,100 | $1.61 | 26d | 1 | 1.09mi |
| 106 W Mosier St Norman, OK | 4.0 | 2.0 | 1762 | $2,150 | $1.22 | 26d | 1 | 1.34mi |
| 1716 Briarcreek Norman, OK | 4.0 | 2.0 | 1734 | $1,845 | $1.06 | 17d | 1 | 1.39mi |
| 1508 Creekside Dr Norman, OK | 4.0 | 2.5 | 1580 | $1,760 | $1.11 | 22d | 1 | 1.43mi |
| 1219 Leslie Ln Norman, OK | 4.0 | 2.5 | 1875 | $2,495 | $1.33 | 17d | 1 | 1.46mi |
| 1424 Teakwood Dr Norman, OK | 4.0 | 2.0 | 1842 | $1,900 | $1.03 | 26d | 1 | 1.46mi |
| 1222 Camden Way Norman, OK | 4.0 | 2.0 | 2030 | $2,600 | $1.28 | 17d | 1 | 1.47mi |
| 1214 Cruce St Norman, OK | 4.0 | 2.0 | 1882 | $3,200 | $1.70 | 13d | 1 | 1.49mi |
Listing history 32 events
-
2026-01-24status Pending
-
2025-09-28price $365,000
-
2025-09-24price $395,000
-
2025-07-25price $398,000
-
2025-07-16price $409,999
-
2025-06-02price $410,000
-
2025-06-02price $41,000
-
2025-04-26$430,000 Active
-
2021-09-14soldstatus $174,000
-
2021-09-08soldstatus $348,000 Sold 143-char remark
Show marketing remark (143 chars)
Remodeled and fully Leased triplex for sale. Located just North of the famous MONTE restaurant and a few blocks to The University of Oklahoma.
-
2021-06-30status Pending 143-char remark
Show marketing remark (143 chars)
Remodeled and fully Leased triplex for sale. Located just North of the famous MONTE restaurant and a few blocks to The University of Oklahoma.
-
2021-05-24$352,500 Active 143-char remark
Show marketing remark (143 chars)
Remodeled and fully Leased triplex for sale. Located just North of the famous MONTE restaurant and a few blocks to The University of Oklahoma.
-
2021-01-29historical
-
2020-11-23price $338,000
-
2020-11-23status Active
-
2020-10-02status Pending
-
2020-09-28price $339,900
-
2020-09-23price $352,900
-
2020-09-01price $355,900
-
2020-08-18price $359,900
-
2020-08-16status Active
-
2020-08-07status Pending
-
2020-05-25price $362,900
-
2020-05-12price $367,500
-
2020-02-10$369,000 Active
-
2018-08-27soldstatus $110,000
-
2018-08-14soldstatus $110,000 Sold
-
2018-08-07status Pending
-
2018-08-07status Active
-
2018-07-23status Pending
-
2018-07-18$124,900 Active
-
1999-03-31soldstatus $35,000
ⓘ Source: listings_history table (triggers on properties + properties_extension) + one-shot
backfill from property_details.listing_events for pre-trigger history.
Tax reassessment forecast OK · Resets to sale price
- Current annual tax
- $2,963 · $247/mo
- Projected year-2 tax
- $3,285 · $274/mo
- Expected delta
- +$322/yr (+$27/mo · 10.9%)
ⓘ Screening estimate from a state-policy table — verify with the county assessor before closing.
Climate risk First Street
- Flood 1/10 Low FEMA zone X (unshaded) · 0% chance over 30 yrs
- Wildfire 4/10 Moderate
- Heat 6/10 Major 7 d/yr ≥108°F today · 19 d/yr by 30 yrs out
- Wind 3/10 Moderate 5% chance of damaging wind over 30 yrs
- Air quality 2/10 Low 1 unhealthy d/yr today · 1 by 30 yrs out
Nearby sold comps map
Loading sold comps map…
Walkable amenities ~0.75 mi
Loading nearby amenities…
Taxation est. · year 1
- Rental income
- $57,288
- − Mortgage interest
- −$20,446
- − Property taxes
- −$2,963
- − Insurance
- −$1,825
- − Repairs & maintenance
- −$4,583
- − Management
- −$4,583
- − Depreciation
- −$10,618
- Taxable income
- $12,270
- Est. tax owed @ 24.0%
- −$2,945
- After-tax cash flow
- $14,556/yr
For passive investors: Depreciation is non-cash, so a rental often shows a tax loss while cash-flowing — sheltering income. Rental losses are passive: they offset passive income freely, and up to $25,000/yr can offset ordinary (W-2) income if you actively participate and your MAGI is under $100k (phasing out to $0 by $150k); unused losses carry forward. On sale, claimed depreciation is recaptured at up to 25%, and gains may owe capital-gains tax (a 1031 exchange can defer both). Figures are a year-1 estimate at your 24.0% rate — not tax advice; consult a CPA.
Schools (NCES district)
- District
- Norman
- NCES district ID
- 4021720
- Math proficiency
- 27% ▼ -9.00%
- Reading proficiency
- 32% ▼ -8.00%
- Median HH income
- $48,940
- Composite
- 25.67/100
- National rank
- #7395
- State rank
- #61 of 270 in OK
Livability — Norman
- Score
- 85/100
- State rank
- #1
- US rank
- #557
Category grades
Schools grade is shown separately in the Schools card above.
Census & demographics
- Census place
- Norman, OK
- County
- Cleveland County · 239,547 people
- City population
- 123,141
- Metro
- Oklahoma City, OK
- Population (ZIP)
- 43,798
- Household income
- $64,007
- Rent vs Own
- Severe rent burden
- 1903.0
Population outlook (Cleveland County) Hauer SSP2
- Today (2025)
- 323,621 people
- By 2030
- 349,070 · +7.9%
- By 2040
- 400,168 · +23.7%
- By 2050
- 454,101 · +40.3%
- By 2075
- 602,926 · +86.3%
- By 2100
- 734,485 · +127.0%
Race, ethnicity, and origin ACS 2023
- Neighborhood character
- Predominantly White (68%)
- Race & ethnicity
- White 68% Two or more races 12% Black 8% Hispanic / Latino 8% Asian 3% Native American 3%
- Hispanic origin (detail)
- Mexican 5%
- Common ancestry
- Italian 3% Serbian 3% Lithuanian 2%
- Foreign-born
- 7% · Canada, China
- Languages at home
- 89% English-only · Spanish 5% Other Indo-European 1% Chinese 1%
Political lean MEDSL · Cleveland
- 2024 margin
- R (+14.9) · D 41.4% · R 56.4% · Other 2.2%
- 2008→2024 swing
- +9.1pp toward D · 2008: -24.0pp · 2024: -14.9pp
- All cycles
- 2024: R+14.9 2020: R+14.1 2016: R+21.7 2012: R+25.9 2008: R+24.0
Not yet ingested
- Civics
- —
Market trends
- HPI YoY
- ▼ -187.04%
- Current HPI
- 249.3797
- Rent YoY
- ▲ 2.80%
- Metro
- Oklahoma City, OK
- State GDP YoY
- ▲ 1.55%
- F500 in state
- 6
Industry mix (Fortune 500 HQ in OK)
| Industry | F500 HQs | Revenue |
|---|---|---|
| Energy | 3 | $48B |
|
||
Price history
+942.9% since first listed32 events — show timeline
- 2026-01-24 Pending — MLSOK
- 2025-09-28 Price Changed $365,000 MLSOK
- 2025-09-24 Price Changed $395,000 MLSOK
- 2025-07-25 Price Changed $398,000 MLSOK
- 2025-07-16 Price Changed $409,999 MLSOK
- 2025-06-02 Price Changed $410,000 MLSOK
- 2025-06-02 Price Changed $41,000 MLSOK
- 2025-04-26 Listed $430,000 MLSOK
- 2021-09-14 Sold (Public Records) $174,000 Public Records
- 2021-09-08 Sold (MLS) $348,000 MLSOK
- 2021-06-30 Pending — MLSOK
- 2021-05-24 Listed $352,500 MLSOK
- 2021-01-29 Listing Removed — MLSOK
- 2020-11-23 Price Changed $338,000 MLSOK
- 2020-11-23 Relisted — MLSOK
- 2020-10-02 Pending — MLSOK
- 2020-09-28 Price Changed $339,900 MLSOK
- 2020-09-23 Price Changed $352,900 MLSOK
- 2020-09-01 Price Changed $355,900 MLSOK
- 2020-08-18 Price Changed $359,900 MLSOK
- 2020-08-16 Relisted — MLSOK
- 2020-08-07 Pending — MLSOK
- 2020-05-25 Price Changed $362,900 MLSOK
- 2020-05-12 Price Changed $367,500 MLSOK
- 2020-02-10 Listed $369,000 MLSOK
- 2018-08-27 Sold (Public Records) $110,000 Public Records
- 2018-08-14 Sold (MLS) $110,000 MLSOK
- 2018-08-07 Pending — MLSOK
- 2018-08-07 Relisted — MLSOK
- 2018-07-23 Pending — MLSOK
- 2018-07-18 Listed $124,900 MLSOK
- 1999-03-31 Sold (Public Records) $35,000 Public Records
Property tax history
+15.5%/yrLatest (2024): $2,963 · +4.7% YoY. Source: county tax records.
Cash-flow waterfall
monthlySold comps — $/sqft
last 12 mo · ≤1 miLoading sold comps…