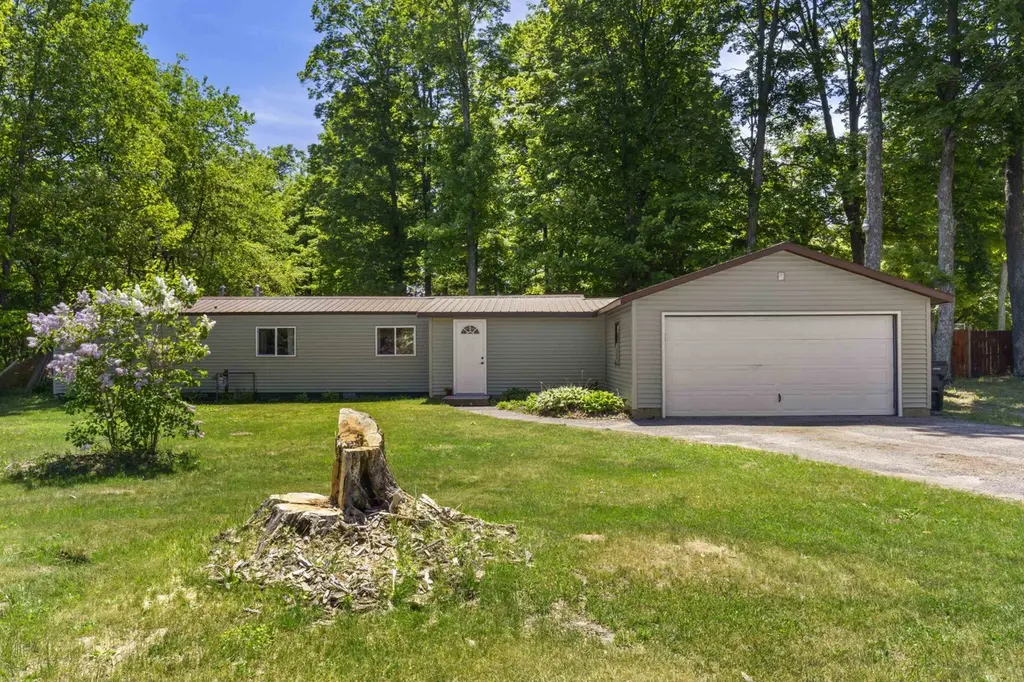
9077 Homestead Rd · Benzonia, MI
Flood risk 6/10 · Moderate
- FEMA flood zone
- X (unshaded)
- Chance of flooding over 30 yrs
- 0.7%
- Est. flood insurance / yr
- $507 – $1,088
Fire risk 1/10 · Minimal
- Est. fire insurance / yr
- $784 – $1,456
Heat risk 1/10 · Minimal
- Hot days now (above 94°F)
- 7 days/yr
- Hot days in 30 yrs
- 14 days/yr
Wind risk 1/10 · Minimal
- Chance of severe wind over 30 yrs
- —
Air-quality risk 2/10 · Minimal
- Unhealthy air days now
- 1 days/yr
- Unhealthy air days in 30 yrs
- 1 days/yr
Risk factors via First Street. Map © Google.
Why this score? — see what drove the C- grade
The composite is a weighted blend of 9 inputs, each scored 0–100. Each bar is that input's sub-score; the figure is the points it added to the 100-point composite (weight × sub-score).
- Cash flow +17.3/30.0
- ARV discount +7.5/15.0
- Appreciation +7.4/10.0
- DSCR +5.4/10.0
- 1% rule +3.5/10.0
- Schools +3.3/10.0
- Livability +3.3/5.0
- Rent growth +2.5/5.0
- Condition / age +2.5/5.0
$99,000
🖨 Deal sheet (PDF) 📄 Offer letter ✓ Due diligence
Listing remarks MLS
A long list of major improvements means you can focus on enjoying your home rather than tackling projects. This extensively remodeled property has been updated from the ground up, including replacement of the subflooring, new flooring throughout, new siding, exterior doors, furnace, kitchen, kitchen appliances, and most plumbing components. The metal roof adds long-term durability and peace of mind. Inside, the updated kitchen serves as the heart of the home, while the practical breezeway connecting the house and attached two-car garage provides valuable everyday space for coats, boots, storage, or a dedicated mudroom setup. The large wooded yard offers room to relax, garden, play, or simply enjoy a little extra privacy without sacrificing convenience. Natural gas service and high-speed internet make it easy to stay comfortable and connected. Located near area schools and just minutes from downtown Beulah and Benzonia, you'll also enjoy easy access to Crystal Lake, Lake Michigan beaches, the Platte Lakes, and countless opportunities for boating, fishing, hiking, and exploring Northern Michigan. With so much of the heavy lifting already completed, this is a property where you can move in and start enjoying the location from day one. NOTE: Sellers cannot close until Aug 3.
Key facts
- Large wooded yard
- Metal roof
- Breezeway
Tags
Property features AI
Exterior
- Parking: Attached garage (2 spaces)
- Utilities: Private well water; Septic tank
- Home design: Single-family residence; One story
- Construction: Vinyl siding
- Exterior features: Deck; Wooded lot
Interior
- Kitchen: Oven; Range; Refrigerator; Dishwasher not listed
- Bathrooms: One full bathroom
- Heating & cooling: Forced air heating (natural gas); Cooling with ceiling fan(s) and exhaust fan
- Interior features: Washer and dryer included; Oven, Range, Refrigerator, and Dryer present; Ceiling fan(s); Exhaust fan
- Laundry & utility: Washer; Dryer; Crawl space basement
Neighborhood map
What this means for you Summary
Snapshot
- This is a 2-bed/1.0-bath single-family listed at $99k.
Deal economics
- At list price, monthly cash flow is $73 ($874/yr) — positive.
- The deal already cash-flows at list — no discount required.
- To meet the 1% rule (rent ≥ 1% of price), the offer needs to be $84k (15.3% below list).
- Recommended offer: $84k (15.3% below list) — sets the bar for 1% rule.
Location & tenants
- Location reads 66/100 on livability (#417 in MI) — a middle-class / working-renter tenant base. Strengths: cost of living A+, housing A+; Watch: schools D+, employment D+, crime D-.
- Benzie County Central Schools (rural): math 33% / reading 44% proficiency, ranked #234 of 540 in MI (top 43%) — families likely to look elsewhere, expect single-tenant / working-renter base with shorter leases.
- Market conditions: 26 active listings in the ZIP; 110 units permitted in Benzie County in 2024 (0 in 5+ unit buildings).
Forward outlook
- In year one you build about $5k of equity ($684 loan paydown + $5k appreciation (4.9% local appreciation)).
- Benzie County population projected at -21% by 2050 — secular population decline; favor cash flow + early exit over multi-decade hold.
- At projected returns (4.9% appreciation + 3.0% rent growth), your $28k cash investment doubles in ~4 years — after that, you're playing with house money.
- By year 7, paydown + projected appreciation supports a ~$35k cash-out refi (75% LTV) — recoverable capital for the next deal without selling this one.
Negotiation context
- Only 3 days on market — expect competitive offers; lowballing is unlikely to land.
- 9 sale attempts since 25y ago with the ask held roughly flat each time — persistent listings suggest the price (not the market) is what's stuck; bring a comps-based counter.
- Current owner paid $40k; list at $99k implies a 151% gain — meaningful room to come down on a strong offer.
Risks & watch-outs
- Climate carrying-cost: major flood risk — expect insurance premiums to compound above CPI over the hold.
Questions for the listing agent
- Is there a deadline driving the sale (1031 exchange, divorce, estate, relocation)? That informs how much negotiation room exists.
- Schools are D-rated, which usually means shorter tenancies and higher turnover. Who's the typical renter profile here, and what's been the actual vacancy rate?
- Crime grade is D in this area — have there been break-ins, vandalism, or insurance claims at this property in the last 3 years? What carrier currently insures it and at what premium?
- What's the average days-on-market for RENTAL listings here right now (not sales)? A rising rental-DOM trend means longer vacancies and softer asking-rent achievability than the comps imply.
- What's the recent tenant-quality profile in this submarket — average credit score on applications, eviction rate, late-payment / NSF rate, and stable-employment percentage? A property-management company in the area should have these aggregated.
- How much new for-sale + rental construction is in the pipeline within 1–3 miles? Heavy new supply typically softens prices + rents 12–24 months out; constrained supply supports both.
Investment metrics
- 1% rule
- 0.85% ✗
- Cap rate
- 7.18%
- Cash-on-cash
- 3.15%
- DSCR
- 1.14
- GRM
- 9.8
CMA / ARV
No comps found within radius.
Projected returns pro-forma
4.86% appreciation · 3.0% rent growth · sell at horizon
- IRR
- 15.2%
- Equity multiple
- 1.96×
- Total profit
- $26,638
- Equity at exit
- $55,280
- IRR
- 15.8%
- Equity multiple
- 3.77×
- Total profit
- $76,820
- Equity at exit
- $94,733
Cash invested: $27,720 (down + closing). Projections, not guarantees.
Landlord ↔ Tenant lean methodology
- Overall (STATE)
- 62 Landlord-Friendly
- State Michigan
- 62 Landlord-Friendly · EVEN
- County
- — inherits STATE
- City
- — inherits STATE
ZIP-level market 49616
- Home prices YoY
- 2.1%
- Active inventory
- 26
- Price-to-rent
- 9.8×
Monthly cashflow live
- Estimated rent
- $839 medium interval (Pro) →
- Mortgage (P&I)
- −$519
- Tax from tax record
- −$29 /mo · $354/yr
- Insurance
- −$41
- HOA
- −$0
- Vacancy / Maint / Mgmt
- −$176
- Net cashflow
- $73
Break-even live
Sensitivity live
| Price | -10% $129 | -5% $101 | +0% $73 | +5% $45 | +10% $17 |
|---|---|---|---|---|---|
| Rent | -10% $7 | -5% $40 | +0% $73 | +5% $106 | +10% $139 |
| Rate | -1.0pp $123 | -0.5pp $98 | base $73 | +0.5pp $47 | +1.0pp $21 |
UW: 25.0% down · 7.5% · 30yr · 1.5% tax · 5.0% vac · 8.0% maint · 8.0% mgmt
Financing live
Cash to close
- Down payment
- $24,750
- Closing costs
- $2,970
- Reserves months
- —
- Total cash needed
- —
Loan-product check · same deal, 3 products live
Conventional
25% down · 7.5% · 30yr
- Down + closing
- —
- Monthly P&I
- —
- Monthly cashflow
- —
- DSCR
- —
- Eligible?
- —
Personal DTI + credit; lowest rate.
DSCR
20% down · 8.5% · 30yr
- Down + closing
- —
- Monthly P&I
- —
- Monthly cashflow
- —
- DSCR
- —
- Eligible?
- —
No personal income docs; deal must DSCR.
Hard money
10% down · 12.0% · 12mo
- Down + closing
- —
- Monthly P&I
- —
- Monthly cashflow
- —
- DSCR
- —
- Eligible?
- —
Short-term bridge; refi at stabilization.
Listing history 4 events
-
2026-06-09status $99,000 Pending 3 DOM
-
2026-06-08days on market $99,000 Active 3 DOM
-
2026-06-07remarks 699-char remark
-
2026-06-07$99,000 Active 2 DOM
ⓘ Source: listings_history table (triggers on properties + properties_extension) + one-shot
backfill from property_details.listing_events for pre-trigger history.
Tax reassessment forecast MI · Partial reset (capped growth)
- Current annual tax
- $354 · $29/mo
- Projected year-2 tax
- $939 · $78/mo
- Expected delta
- +$585/yr (+$49/mo · 165.5%)
ⓘ Screening estimate from a state-policy table — verify with the county assessor before closing.
Climate risk First Street
- Flood 6/10 Major FEMA zone X (unshaded) · 70% chance over 30 yrs
- Wildfire 1/10 Low
- Heat 1/10 Low 7 d/yr ≥94°F today · 14 d/yr by 30 yrs out
- Wind 1/10 Low
- Air quality 2/10 Low 1 unhealthy d/yr today · 1 by 30 yrs out
Nearby sold comps map
Loading sold comps map…
Walkable amenities ~0.75 mi
Loading nearby amenities…
Taxation est. · year 1
- Rental income
- $10,066
- − Mortgage interest
- −$5,546
- − Property taxes
- −$354
- − Insurance
- −$495
- − Repairs & maintenance
- −$805
- − Management
- −$805
- − Depreciation
- −$2,880
- Taxable loss
- −$818
- Est. tax savings @ 24.0%
- +$196
- After-tax cash flow
- $1,070/yr
For passive investors: Depreciation is non-cash, so a rental often shows a tax loss while cash-flowing — sheltering income. Rental losses are passive: they offset passive income freely, and up to $25,000/yr can offset ordinary (W-2) income if you actively participate and your MAGI is under $100k (phasing out to $0 by $150k); unused losses carry forward. On sale, claimed depreciation is recaptured at up to 25%, and gains may owe capital-gains tax (a 1031 exchange can defer both). Figures are a year-1 estimate at your 24.0% rate — not tax advice; consult a CPA.
Schools (NCES district)
- District
- Benzie County Central Schools
- NCES district ID
- 2604950
- Math proficiency
- 33% ▼ -2.00%
- Reading proficiency
- 44% ▼ -2.00%
- Median HH income
- $46,158
- Composite
- 32.84/100
- National rank
- #5616
- State rank
- #234 of 540 in MI
Livability — Benzonia
- Score
- 66/100
- State rank
- #417
- US rank
- #11456
Category grades
Schools grade is shown separately in the Schools card above.
Census & demographics
- Population (ZIP)
- 2,177
Population outlook (Benzie County) Hauer SSP2
- Today (2025)
- 17,179 people
- By 2030
- 16,774 · -2.4%
- By 2040
- 15,308 · -10.9%
- By 2050
- 13,594 · -20.9%
- By 2075
- 11,015 · -35.9%
- By 2100
- 8,181 · -52.4%
Race, ethnicity, and origin ACS 2023
- Neighborhood character
- Predominantly White (85%)
- Race & ethnicity
- White 85% Hispanic / Latino 8% Native American 4% Two or more races 4% Pacific Islander 1%
- Hispanic origin (detail)
- Mexican 2% Puerto Rican 3% Cuban 2%
- Common ancestry
- Iranian 6% Romanian 5% Portuguese 3%
- Foreign-born
- 1%
- Languages at home
- 98% English-only · Spanish 2%
Political lean MEDSL · Benzie
- 2024 margin
- Lean R (+8.7) · D 45.0% · R 53.7% · Other 1.3%
- 2008→2024 swing
- -16.1pp toward R · 2008: 7.4pp · 2024: -8.7pp
- All cycles
- 2024: R+8.7 2020: R+9.1 2016: R+14.0 2012: R+3.9 2008: D+7.4
Not yet ingested
- Civics
- —
Market trends
- HPI YoY
- ▲ 4.86%
- Current HPI
- 240.7377
- Rent YoY
- —
- Metro
- —
- State GDP YoY
- ▲ 1.37%
- F500 in state
- 28
Industry mix (Fortune 500 HQ in MI)
| Industry | F500 HQs | Revenue |
|---|---|---|
| Automotive Parts | 3 | $48B |
|
||
| Automotive | 2 | $372B |
|
||
| Chemicals | 1 | $45B |
|
||
| Automotive Retail | 1 | $29B |
|
||
| Healthcare / Medical Devices | 1 | $23B |
|
||
| Automotive Technology | 1 | $20B |
|
||
Price history
+147.5% since first listed19 events — show timeline
- 2026-06-05 Listed $99,000 MiRealSource-MiMLS
- 2026-06-05 Listed $99,000 REALCOMP
- 2012-07-31 Sold (MLS) $39,500 REALCOMP
- 2012-07-31 Sold (MLS) $39,000 SW Michigan MLS
- 2012-07-31 Sold (MLS) $39,500 MiRealSource-MiMLS
- 2011-12-05 Listing Removed — MiRealSource-MiMLS
- 2011-08-03 Listed $45,000 MiRealSource-MiMLS
- 2011-08-03 Listed $45,000 REALCOMP
- 2011-08-03 Listed $45,000 MiRealSource-MiMLS
- 2011-07-29 Listed $45,000 SW Michigan MLS
- 2008-10-01 Sold (MLS) $54,900 MiRealSource-MiMLS
- 2008-10-01 Sold (MLS) $54,900 SW Michigan MLS
- 2008-08-04 Listed $59,900 MiRealSource-MiMLS
- 2008-08-04 Listed $59,900 SW Michigan MLS
- 2005-09-08 Sold (Public Records) $53,900 Public Records
- 2005-09-08 Sold (Public Records) $37,500 Public Records
- 2001-11-30 Listing Removed — MiRealSource-MiMLS
- 2001-08-09 Listed $47,500 MiRealSource-MiMLS
- 1998-12-30 Sold (Public Records) $40,000 Public Records
Property tax history
-19.4%/yrLatest (2025): $354 · -39.4% YoY. Source: county tax records.
Cash-flow waterfall
monthlySold comps — $/sqft
last 12 mo · ≤1 miLoading sold comps…