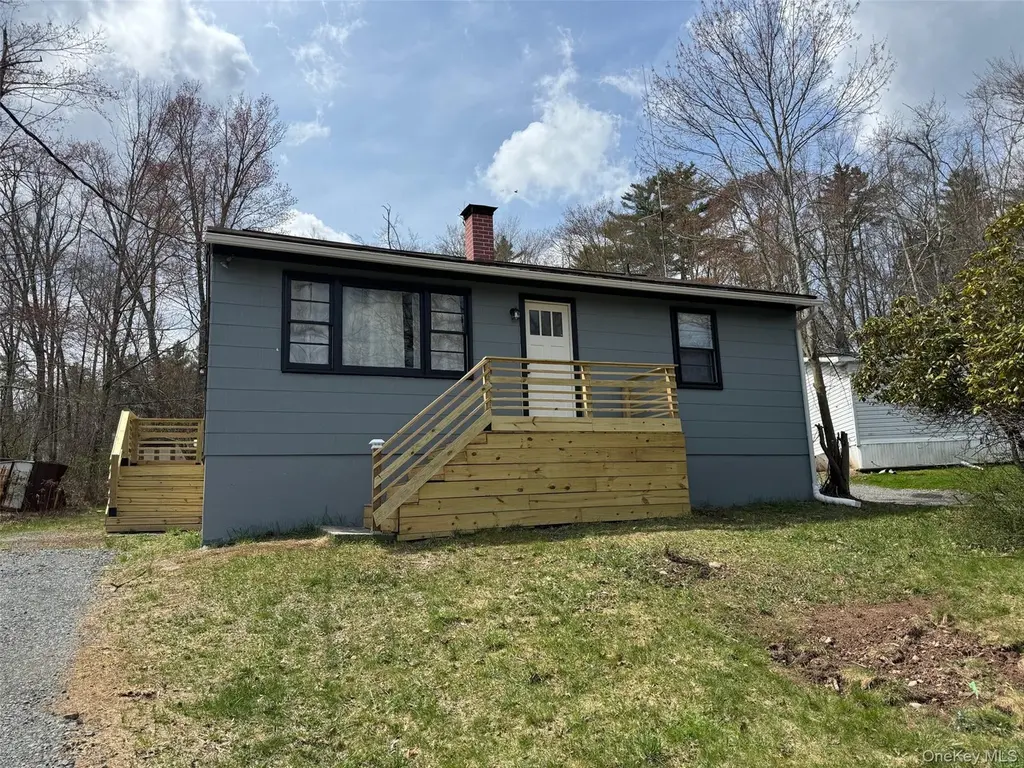
5 Lucky Ln · Narrowsburg, NY
Flood risk 1/10 · Minimal
- FEMA flood zone
- X (unshaded)
- Chance of flooding over 30 yrs
- 0.0%
- Est. flood insurance / yr
- $473 – $860
Fire risk 4/10 · Minor
- Est. fire insurance / yr
- $691 – $1,283
Heat risk 2/10 · Minimal
- Hot days now (above 93°F)
- 7 days/yr
- Hot days in 30 yrs
- 15 days/yr
Wind risk 2/10 · Minimal
- Chance of severe wind over 30 yrs
- 3.0%
Air-quality risk 2/10 · Minimal
- Unhealthy air days now
- 0 days/yr
- Unhealthy air days in 30 yrs
- 1 days/yr
Risk factors via First Street. Map © Google.
Why this score? — see what drove the D grade
The composite is a weighted blend of 9 inputs, each scored 0–100. Each bar is that input's sub-score; the figure is the points it added to the 100-point composite (weight × sub-score).
- ARV discount +15.0/15.0
- Appreciation +10.0/10.0
- Cash flow +4.3/30.0
- Schools +4.0/10.0
- Livability +2.8/5.0
- Rent growth +2.5/5.0
- Condition / age +2.5/5.0
- 1% rule +0.5/10.0
- DSCR +0.0/10.0
$225,000
🖨 Deal sheet 📄 Offer letter ✓ Due diligence
Listing remarks MLS
Welcome to this three bedroom ranch in the Luxton Lake community with a shared park just down the road through the low cost HOA at $250 per year. Newer features include an updated bath and kitchen, fresh paint and all new flooring. Kitchen/livingroom has an open floor plan for plenty of natural light. HOA fee includes road plowing and maintenance, as well as park and river access. Minutes away is the Hamlet of Narrowsburg where you’ll find art galleries, shops, and destination-worthy restaurants like The Heron, Bridge and Main, and the Laundrette. Explore nearby Tusten Mountain Trail for your hiking pleasure a 3 mile loop offering a scenic view of the Delaware River for kayaking or tubing. Also nearby is the Narrowsburg’s farmers market. Enjoy all the Catskills-Delaware River Valley has to offer.
Key facts
- Open floor plan
- Updated bath
- Park access
Tags
Neighborhood map
What this means for you Summary
Snapshot
- This is a 3-bed/1.0-bath single-family listed at $225k.
Deal economics
- At list price, monthly cash flow is $-596 ($-7k/yr) — negative.
- To cash-flow at today's rent, offer at most $139k (38.4% below list).
- To meet the 1% rule (rent ≥ 1% of price), the offer needs to be $124k (44.9% below list).
- Recommended offer: $124k (44.9% below list) — sets the bar for 1% rule.
- Cap rate 3.1% vs local median 1.7% in Narrowsburg — top-decile yield for the area; either an underpriced asset or a hidden risk that comps aren't pricing in. Stress-test before assuming the spread holds.
Location & tenants
- Location reads 56/100 on livability (#1,108 in NY) — a working-class tenant base; expect higher turnover. Strengths: cost of living A+, housing A; Watch: schools F, crime F, amenities F.
- Sullivan West Central School District (rural): math 45% / reading 47% proficiency, ranked #436 of 590 in NY (top 74%) — families likely to look elsewhere, expect single-tenant / working-renter base with shorter leases.
- Market conditions: 43 active listings in the ZIP; 739 units permitted in Sullivan County in 2024 (5 in 5+ unit buildings).
Forward outlook
- In year one you build about $24k of equity ($2k loan paydown + $22k appreciation (10.0% local appreciation)).
- Sullivan County population projected at -24% by 2050 — secular population decline; favor cash flow + early exit over multi-decade hold.
- By year 2, paydown + projected appreciation supports a ~$39k cash-out refi (75% LTV) — recoverable capital for the next deal without selling this one.
Negotiation context
- It's been on market 62 days — a 6% lower offer ($212k) is reasonable based on typical stale-listing flexibility.
Questions for the listing agent
- What do current leases actually rent for vs. the listed asking? Can we see a recent rent roll and the last 12 months of T-12 income?
- It's been on market 62 days. Have you received any prior offers? Is the seller open to a 45% concession, seller financing, or rate buy-down credit?
- Built in 1968 — when were the roof, HVAC, electrical panel, plumbing, and water heater last replaced?
- What does the HOA fee cover, when was the last increase, and are there any pending special assessments or reserve-fund shortfalls?
- Why hasn't it sold? Are there any deal-killer items the seller is aware of (foundation, flood, title, zoning, code violations)?
- Is there a deadline driving the sale (1031 exchange, divorce, estate, relocation)? That informs how much negotiation room exists.
- Schools are F-rated, which usually means shorter tenancies and higher turnover. Who's the typical renter profile here, and what's been the actual vacancy rate?
- Crime grade is F in this area — have there been break-ins, vandalism, or insurance claims at this property in the last 3 years? What carrier currently insures it and at what premium?
- The area grade is low — what's the realistic commute time and amenity access for the typical tenant pool here? Any planned neighborhood developments (good or bad) we should know about?
- What's the average days-on-market for RENTAL listings here right now (not sales)? A rising rental-DOM trend means longer vacancies and softer asking-rent achievability than the comps imply.
- What's the recent tenant-quality profile in this submarket — average credit score on applications, eviction rate, late-payment / NSF rate, and stable-employment percentage? A property-management company in the area should have these aggregated.
- How much new for-sale + rental construction is in the pipeline within 1–3 miles? Heavy new supply typically softens prices + rents 12–24 months out; constrained supply supports both.
Investment metrics
- 1% rule
- 0.55% ✗
- Cap rate
- 3.11%
- Cash-on-cash
- -11.36%
- DSCR
- 0.49
- GRM
- 15.1
CMA / ARV
- ARV (median comp)
- $339,173
- List price
- $225,000
- Delta
- -33.66%
- Verdict
- UNDERPRICED
- Comps
- 10 within 1.0 mi
Projected returns pro-forma
10.0% appreciation · 3.0% rent growth · sell at horizon
- IRR
- 16.3%
- Equity multiple
- 2.34×
- Total profit
- $84,585
- Equity at exit
- $202,698
- IRR
- 15.7%
- Equity multiple
- 5.43×
- Total profit
- $279,026
- Equity at exit
- $437,126
Cash invested: $63,000 (down + closing). Projections, not guarantees.
Landlord ↔ Tenant lean methodology
- Overall (STATE)
- 15 Strongly Tenant-Friendly
- State New York
- 15 Strongly Tenant-Friendly · D+10
- County
- — inherits STATE
- City
- — inherits STATE
ZIP-level market 12764
- Home prices YoY
- 15.3%
- Active inventory
- 43
- Price-to-rent
- 15.1×
Monthly cashflow live
- Estimated rent
- $1,240 medium interval (Pro) →
- Mortgage (P&I)
- −$1,180
- Tax est. 1.5%
- −$281 /mo · $3,375/yr
- Insurance
- −$94
- HOA
- −$21
- Vacancy / Maint / Mgmt
- −$260
- Net cashflow
- $-596
Break-even live
UW: 25.0% down · 7.5% · 30yr · 1.5% tax · 5.0% vac · 8.0% maint · 8.0% mgmt
Financing live
Cash to close
- Down payment
- $56,250
- Closing costs
- $6,750
- Reserves months
- —
- Total cash needed
- —
Loan-product check · same deal, 3 products live
Conventional
25% down · 7.5% · 30yr
- Down + closing
- —
- Monthly P&I
- —
- Monthly cashflow
- —
- DSCR
- —
- Eligible?
- —
Personal DTI + credit; lowest rate.
DSCR
20% down · 8.5% · 30yr
- Down + closing
- —
- Monthly P&I
- —
- Monthly cashflow
- —
- DSCR
- —
- Eligible?
- —
No personal income docs; deal must DSCR.
Hard money
10% down · 12.0% · 12mo
- Down + closing
- —
- Monthly P&I
- —
- Monthly cashflow
- —
- DSCR
- —
- Eligible?
- —
Short-term bridge; refi at stabilization.
HOA detail
- Monthly dues
- $21 · $252/yr
Listing history 15 events
-
2026-06-18days on market $225,000 Active 62 DOM
-
2026-06-17days on market $225,000 Active 61 DOM
-
2026-06-16days on market $225,000 Active 60 DOM
-
2026-06-15days on market $225,000 Active 59 DOM
-
2026-06-13days on market $225,000 Active 57 DOM
-
2026-06-12days on market $225,000 Active 56 DOM
-
2026-06-09days on market $225,000 Active 53 DOM
-
2026-06-08days on market $225,000 Active 52 DOM
-
2026-06-07days on market $225,000 Active 51 DOM
-
2026-06-07pricedays on market $225,000 Active 50 DOM
-
2026-06-04days on market $275,000 Active 47 DOM
-
2026-06-02days on market $275,000 Active 46 DOM
-
2026-06-01days on market $275,000 Active 45 DOM
-
2026-05-31days on market $275,000 Active 44 DOM
-
2026-04-17$275,000 Active 820-char remark
Show marketing remark (820 chars)
Welcome to this three bedroom ranch in the Luxton Lake community with a shared park just down the road through the low cost HOA at $250 per year. Newer features include an updated bath and kitchen, fresh paint and all new flooring. Kitchen/livingroom has an open floor plan for plenty of natural light. HOA fee includes road plowing and maintenance, as well as park and river access. Minutes away is the Hamlet of Narrowsburg where you’ll find art galleries, shops, and destination-worthy restaurants like The Heron, Bridge and Main, and the Laundrette. Explore nearby Tusten Mountain Trail for your hiking pleasure a 3 mile loop offering a scenic view of the Delaware River for kayaking or tubing. Also nearby is the Narrowsburg’s farmers market. Enjoy all the Catskills-Delaware River Valley has to offer.
ⓘ Source: listings_history table (triggers on properties + properties_extension) + one-shot
backfill from property_details.listing_events for pre-trigger history.
Climate risk First Street
- Flood 1/10 Low FEMA zone X (unshaded) · 0% chance over 30 yrs
- Wildfire 4/10 Moderate
- Heat 2/10 Low 7 d/yr ≥93°F today · 15 d/yr by 30 yrs out
- Wind 2/10 Low 3% chance of damaging wind over 30 yrs
- Air quality 2/10 Low 0 unhealthy d/yr today · 1 by 30 yrs out
Nearby sold comps map
Loading sold comps map…
Walkable amenities ~0.75 mi
Loading nearby amenities…
Taxation est. · year 1
- Rental income
- $14,878
- − Mortgage interest
- −$12,603
- − Property taxes
- −$3,375
- − Insurance
- −$1,125
- − Repairs & maintenance
- −$1,190
- − Management
- −$1,190
- − HOA
- −$252
- − Depreciation
- −$6,545
- Taxable loss
- −$11,403
- Est. tax savings @ 24.0%
- +$2,737
- After-tax cash flow
- $-4,420/yr
For passive investors: Depreciation is non-cash, so a rental often shows a tax loss while cash-flowing — sheltering income. Rental losses are passive: they offset passive income freely, and up to $25,000/yr can offset ordinary (W-2) income if you actively participate and your MAGI is under $100k (phasing out to $0 by $150k); unused losses carry forward. On sale, claimed depreciation is recaptured at up to 25%, and gains may owe capital-gains tax (a 1031 exchange can defer both). Figures are a year-1 estimate at your 24.0% rate — not tax advice; consult a CPA.
Schools (NCES district)
- District
- Sullivan West Central School District
- NCES district ID
- 3600023
- Math proficiency
- 45% ▼ -7.00%
- Reading proficiency
- 47% ▼ -2.00%
- Median HH income
- $56,078
- Composite
- 40.05/100
- National rank
- #3817
- State rank
- #436 of 590 in NY
Livability — Narrowsburg
- Score
- 56/100
- State rank
- #1108
- US rank
- #22694
Category grades
Schools grade is shown separately in the Schools card above.
Census & demographics
- Population (ZIP)
- 1,827
Population outlook (Sullivan County) Hauer SSP2
- Today (2025)
- 68,974 people
- By 2030
- 65,609 · -4.9%
- By 2040
- 58,878 · -14.6%
- By 2050
- 52,500 · -23.9%
- By 2075
- 39,941 · -42.1%
- By 2100
- 28,880 · -58.1%
Race, ethnicity, and origin ACS 2023
- Neighborhood character
- Predominantly White (76%)
- Race & ethnicity
- White 76% Black 14% Hispanic / Latino 6% Two or more races 3%
- Hispanic origin (detail)
- Common ancestry
- Danish 4% Iranian 3% Slovak 2%
- Foreign-born
- 5% · Canada, Mexico
- Languages at home
- 93% English-only · Spanish 3% German/W. Germanic 2% Other Indo-European 1%
Political lean MEDSL · Sullivan
- 2024 margin
- R (+16.7) · D 41.6% · R 58.4%
- 2008→2024 swing
- -26.2pp toward R · 2008: 9.5pp · 2024: -16.7pp
- All cycles
- 2024: R+16.7 2020: R+9.2 2016: R+13.7 2012: D+10.4 2008: D+9.5
Not yet ingested
- Civics
- —
Market trends
- HPI YoY
- ▲ 55.78%
- Current HPI
- 420.1391
- Rent YoY
- —
- Metro
- —
- State GDP YoY
- ▲ 2.60%
- F500 in state
- 92
Industry mix (Fortune 500 HQ in NY)
| Industry | F500 HQs | Revenue |
|---|---|---|
| Financial Services | 10 | $950B |
|
||
| Consumer Goods | 9 | $162B |
|
||
| Insurance | 4 | $225B |
|
||
| Telecommunications | 2 | $144B |
|
||
| Pharmaceuticals | 2 | $112B |
|
||
| Media / Entertainment | 2 | $69B |
|
||
Price history
1 event — show timeline
- 2026-04-17 Listed $275,000 OneKey® MLS as Distributed by MLS Grid
Cash-flow waterfall
monthlySold comps — $/sqft
last 12 mo · ≤1 miLoading sold comps…