15096 St Hwy 113 Canadian Shores Hwy N #1 · Indianola, OK
Flood risk No data
- FEMA flood zone
- —
- Chance of flooding over 30 yrs
- —
- Est. flood insurance / yr
- —
Fire risk No data
- Est. fire insurance / yr
- —
Heat risk 6/10 · Moderate
- Hot days now (above threshold)
- 7 days/yr
- Hot days in 30 yrs
- 19 days/yr
Wind risk No data
- Chance of severe wind over 30 yrs
- —
Air-quality risk 2/10 · Minimal
- Unhealthy air days now
- 1 days/yr
- Unhealthy air days in 30 yrs
- 1 days/yr
Risk factors via First Street. Map © Google.
Why this score? — see what drove the C+ grade
The composite is a weighted blend of 9 inputs, each scored 0–100. Each bar is that input's sub-score; the figure is the points it added to the 100-point composite (weight × sub-score).
- Cash flow +24.2/30.0
- Appreciation +8.0/10.0
- DSCR +7.8/10.0
- ARV discount +7.5/15.0
- 1% rule +6.3/10.0
- Schools +3.1/10.0
- Livability +2.7/5.0
- Rent growth +2.5/5.0
- Condition / age +2.5/5.0
$85,000
🖨 Deal sheet 📄 Offer letter ✓ Due diligence
Listing remarks
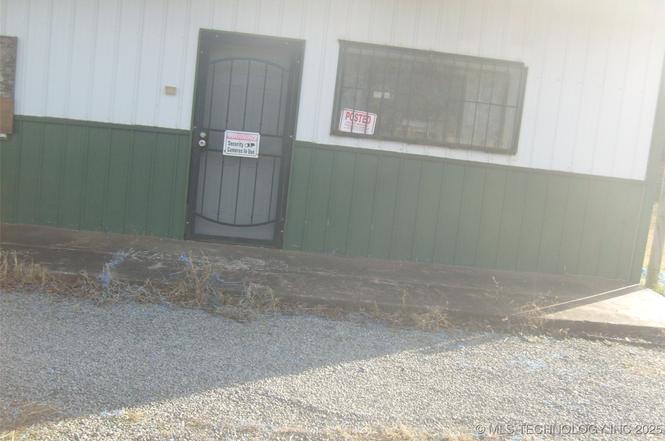
Owner/Broker, property is zoned Commercial at this time, I have talked to zoning and planning, and they have told me that I could change the zoning to multipurpose or residence so with that said you could do just about anything you would like with the property it was Ruby's bar there is a home to the East of the property so you can see where I'm going with this property. The property is over 2700sf with an office at one end and a kitchen in the middle and a big open space at the other end where the bar, storage room, his and hers bathroom that could be made in to 1 bathroom. there're 2 doors in front of the building 1 goes to open space the other is for the office there is 2 doors in back b
Key facts
- Office
- Open space
- Kitchen
Tags
Property features AI
Finance
- HOA & community: Sidewalks; Senior community
Exterior
- Parking: Handicap parking
- Security: Owned security system; Smoke detectors; No safety shelter
- Utilities: Electricity available; Natural gas available; Water available (rural); Cable available; Phone available; Septic tank
- Home design: Single-story; Handicap access; Slab foundation
- Construction: Brick veneer and steel construction; Asphalt and fiberglass roof
- Exterior features: Deck; Barbed wire fencing; Mature trees; Beach access and boat ramp/lift access to Eufaula Lake; Faces north
Interior
- Kitchen: Laminate counters; Wet bar and dry bar
- Flooring: Carpet; Concrete
- Bathrooms: One half bathroom
- Heating & cooling: Central heating (electric and gas); Central air conditioning
- Interior features: Storm windows; Storm door(s); Wet bar and dry bar; High-speed internet available; Laminate counters; Cable TV available; Ceiling fan(s); Accessible doors and hallways; Parking accessibility
Neighborhood map
What this means for you Summary
Snapshot
- This is a 1-bed/0.5-bath single-family listed at $85k.
Deal economics
- At list price, monthly cash flow is $169 ($2k/yr) — positive.
- The deal already cash-flows at list — no discount required.
- Meets the 1% rule at list price ($958 rent vs $85k).
- Recommended offer: $75k (12.0% below list) — sets the bar for market timing.
Location & tenants
- Location reads 54/100 on livability (#587 in OK) — a working-class tenant base; expect higher turnover. Strengths: cost of living A+, housing A+; Watch: schools F, crime F, amenities F.
- Indianola (rural): math 35% / reading 30% proficiency, ranked #213 of 513 in OK (top 42%) — families likely to look elsewhere, expect single-tenant / working-renter base with shorter leases; 71% free/reduced lunch — lower-income household profile, screen leases tightly.
- Market conditions: 16 active listings in the ZIP; 46 units permitted in Pittsburg County in 2024 (0 in 5+ unit buildings).
Forward outlook
- In year one you build about $6k of equity ($588 loan paydown + $5k appreciation (6.0% local appreciation)).
- Pittsburg County population projected to shrink 7% by 2050 — rents likely to lag national; underwrite the cash flow, not the appreciation.
- At projected returns (6.0% appreciation + 3.0% rent growth), your $24k cash investment doubles in ~3 years — after that, you're playing with house money.
- By year 6, paydown + projected appreciation supports a ~$31k cash-out refi (75% LTV) — recoverable capital for the next deal without selling this one.
Negotiation context
- It's been on market 184 days — a 12% lower offer ($75k) is reasonable based on typical stale-listing flexibility.
Risks & watch-outs
- Climate carrying-cost: extreme-heat days projected 7→19/yr by 2055 (HVAC capex compounding) — expect insurance premiums to compound above CPI over the hold.
Questions for the listing agent
- It's been on market 184 days. Have you received any prior offers? Is the seller open to a 12% concession, seller financing, or rate buy-down credit?
- Built in 1968 — when were the roof, HVAC, electrical panel, plumbing, and water heater last replaced?
- Why hasn't it sold? Are there any deal-killer items the seller is aware of (foundation, flood, title, zoning, code violations)?
- Is there a deadline driving the sale (1031 exchange, divorce, estate, relocation)? That informs how much negotiation room exists.
- Schools are F-rated, which usually means shorter tenancies and higher turnover. Who's the typical renter profile here, and what's been the actual vacancy rate?
- Crime grade is F in this area — have there been break-ins, vandalism, or insurance claims at this property in the last 3 years? What carrier currently insures it and at what premium?
- What's the average days-on-market for RENTAL listings here right now (not sales)? A rising rental-DOM trend means longer vacancies and softer asking-rent achievability than the comps imply.
- What's the recent tenant-quality profile in this submarket — average credit score on applications, eviction rate, late-payment / NSF rate, and stable-employment percentage? A property-management company in the area should have these aggregated.
- How much new for-sale + rental construction is in the pipeline within 1–3 miles? Heavy new supply typically softens prices + rents 12–24 months out; constrained supply supports both.
Investment metrics
- 1% rule
- 1.13% ✓
- Cap rate
- 8.68%
- Cash-on-cash
- 8.52%
- DSCR
- 1.38
- GRM
- 7.4
CMA / ARV
No comps found within radius.
Projected returns pro-forma
5.98% appreciation · 3.0% rent growth · sell at horizon
- IRR
- 22.4%
- Equity multiple
- 2.48×
- Total profit
- $35,229
- Equity at exit
- $53,335
- IRR
- 21.3%
- Equity multiple
- 5.00×
- Total profit
- $95,244
- Equity at exit
- $96,635
Cash invested: $23,800 (down + closing). Projections, not guarantees.
Landlord ↔ Tenant lean methodology
- Overall (STATE)
- 83 Strongly Landlord-Friendly
- State Oklahoma
- 83 Strongly Landlord-Friendly · R+20
- County
- — inherits STATE
- City
- — inherits STATE
ZIP-level market 74442
- Home prices YoY
- 2.0%
- Active inventory
- 16
- Price-to-rent
- 7.4×
Monthly cashflow live
- Estimated rent
- $958 medium interval (Pro) →
- Mortgage (P&I)
- −$446
- Tax est. 1.5%
- −$106 /mo · $1,275/yr
- Insurance
- −$35
- HOA
- −$0
- Vacancy / Maint / Mgmt
- −$201
- Net cashflow
- $169
Break-even live
UW: 25.0% down · 7.5% · 30yr · 1.5% tax · 5.0% vac · 8.0% maint · 8.0% mgmt
Financing live
Cash to close
- Down payment
- $21,250
- Closing costs
- $2,550
- Reserves months
- —
- Total cash needed
- —
Loan-product check · same deal, 3 products live
Conventional
25% down · 7.5% · 30yr
- Down + closing
- —
- Monthly P&I
- —
- Monthly cashflow
- —
- DSCR
- —
- Eligible?
- —
Personal DTI + credit; lowest rate.
DSCR
20% down · 8.5% · 30yr
- Down + closing
- —
- Monthly P&I
- —
- Monthly cashflow
- —
- DSCR
- —
- Eligible?
- —
No personal income docs; deal must DSCR.
Hard money
10% down · 12.0% · 12mo
- Down + closing
- —
- Monthly P&I
- —
- Monthly cashflow
- —
- DSCR
- —
- Eligible?
- —
Short-term bridge; refi at stabilization.
Listing history 15 events
-
2026-06-18days on market $85,000 Active 184 DOM
-
2026-06-17days on market $85,000 Active 183 DOM
-
2026-06-16days on market $85,000 Active 182 DOM
-
2026-06-15days on market $85,000 Active 181 DOM
-
2026-06-13days on market $85,000 Active 179 DOM
-
2026-06-12days on market $85,000 Active 178 DOM
-
2026-06-09days on market $85,000 Active 175 DOM
-
2026-06-08days on market $85,000 Active 174 DOM
-
2026-06-08days on market $85,000 Active 173 DOM
-
2026-06-05days on market $85,000 Active 171 DOM
-
2026-06-04days on market $85,000 Active 169 DOM
-
2026-06-02days on market $85,000 Active 168 DOM
-
2026-06-01days on market $85,000 Active 167 DOM
-
2026-05-31days on market $85,000 Active 166 DOM
-
2025-12-16$85,000 Active
ⓘ Source: listings_history table (triggers on properties + properties_extension) + one-shot
backfill from property_details.listing_events for pre-trigger history.
Climate risk First Street
- Heat 6/10 Major
- Air quality 2/10 Low 1 unhealthy d/yr today · 1 by 30 yrs out
Nearby sold comps map
Loading sold comps map…
Walkable amenities ~0.75 mi
Loading nearby amenities…
Taxation est. · year 1
- Rental income
- $11,490
- − Mortgage interest
- −$4,761
- − Property taxes
- −$1,275
- − Insurance
- −$425
- − Repairs & maintenance
- −$919
- − Management
- −$919
- − Depreciation
- −$2,473
- Taxable income
- $718
- Est. tax owed @ 24.0%
- −$172
- After-tax cash flow
- $1,856/yr
For passive investors: Depreciation is non-cash, so a rental often shows a tax loss while cash-flowing — sheltering income. Rental losses are passive: they offset passive income freely, and up to $25,000/yr can offset ordinary (W-2) income if you actively participate and your MAGI is under $100k (phasing out to $0 by $150k); unused losses carry forward. On sale, claimed depreciation is recaptured at up to 25%, and gains may owe capital-gains tax (a 1031 exchange can defer both). Figures are a year-1 estimate at your 24.0% rate — not tax advice; consult a CPA.
Schools (NCES district)
- District
- Indianola
- NCES district ID
- 4015450
- Math proficiency
- 35% ▲ 5.00%
- Reading proficiency
- 30% ▼ -5.00%
- Median HH income
- $47,410
- Composite
- 30.77/100
- National rank
- #11397
- State rank
- #213 of 513 in OK
Livability — Indianola
- Score
- 54/100
- State rank
- #587
- US rank
- #24006
Category grades
Schools grade is shown separately in the Schools card above.
Census & demographics
- Population (ZIP)
- 721
Population outlook (Pittsburg County) Hauer SSP2
- Today (2025)
- 42,795 people
- By 2030
- 41,901 · -2.1%
- By 2040
- 40,680 · -4.9%
- By 2050
- 39,952 · -6.6%
- By 2075
- 38,858 · -9.2%
- By 2100
- 36,031 · -15.8%
Race, ethnicity, and origin ACS 2023
- Neighborhood character
- Predominantly White (69%)
- Race & ethnicity
- White 69% Two or more races 17% Native American 11%
- Common ancestry
- Serbian 2% Lithuanian 1% Slovak 1%
- Foreign-born
- 0%
Political lean MEDSL · Pittsburg
- 2024 margin
- Solid R (+59.0) · D 19.8% · R 78.8% · Other 1.5%
- 2008→2024 swing
- -22.4pp toward R · 2008: -36.6pp · 2024: -59.0pp
- All cycles
- 2024: R+59.0 2020: R+56.3 2016: R+52.4 2012: R+38.3 2008: R+36.6
Not yet ingested
- Civics
- —
Market trends
- HPI YoY
- ▲ 5.98%
- Current HPI
- 303.9319
- Rent YoY
- —
- Metro
- —
- State GDP YoY
- ▲ 1.55%
- F500 in state
- 6
Industry mix (Fortune 500 HQ in OK)
| Industry | F500 HQs | Revenue |
|---|---|---|
| Energy | 3 | $48B |
|
||
Price history
1 event — show timeline
- 2025-12-16 Listed $85,000 MLS Technology, Inc.
Cash-flow waterfall
monthlySold comps — $/sqft
last 12 mo · ≤1 miLoading sold comps…