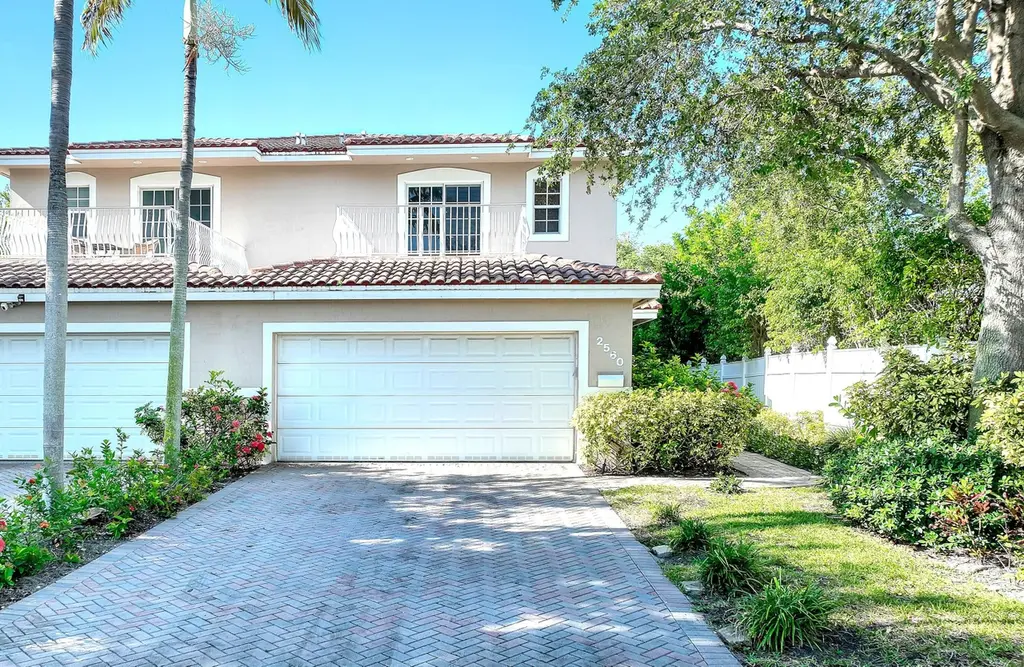
2560 NE 11th St · Pompano Beach, FL
Flood risk 6/10 · Moderate
- FEMA flood zone
- X (shaded)
- Chance of flooding over 30 yrs
- 0.54%
- Est. flood insurance / yr
- $507 – $1,088
Fire risk 1/10 · Minimal
- Est. fire insurance / yr
- $947 – $1,759
Heat risk 10/10 · Severe
- Hot days now (above 106°F)
- 7 days/yr
- Hot days in 30 yrs
- 26 days/yr
Wind risk 10/10 · Severe
- Chance of severe wind over 30 yrs
- 99.0%
Air-quality risk 2/10 · Minimal
- Unhealthy air days now
- 1 days/yr
- Unhealthy air days in 30 yrs
- 2 days/yr
Risk factors via First Street. Map © Google.
Why this score? — see what drove the D+ grade
The composite is a weighted blend of 9 inputs, each scored 0–100. Each bar is that input's sub-score; the figure is the points it added to the 100-point composite (weight × sub-score).
- ARV discount +15.0/15.0
- Cash flow +13.5/30.0
- DSCR +4.1/10.0
- Schools +4.1/10.0
- Livability +3.7/5.0
- 1% rule +2.9/10.0
- Condition / age +2.5/5.0
- Rent growth +2.4/5.0
- Appreciation +0.0/10.0
$675,000
🖨 Deal sheet (PDF) 📄 Offer letter ✓ Due diligence
Key facts
- 2 garage spots
- Built 2006
- Listed 75 days
Property features AI
Finance
- Other: Pets allowed with no restrictions
Exterior
- Parking: Attached 2-car garage (total 4 parking spaces, 2 covered)
- Security: Security system
- Utilities: Public water; Public sewer and private sewer options; Water connected
- Home design: Townhouse; 2 stories; Accessible central living area; Faces north
- Construction: CBS construction; Shingle roof
- Exterior features: Open porch; Porch
Interior
- Kitchen: Dishwasher; Microwave; Refrigerator
- Bedrooms: Main level bedrooms not indicated
- Flooring: Tile flooring
- Bathrooms: 2 full bathrooms and 1 half bathroom
- Heating & cooling: Central heating; Central air conditioning
- Interior features: Kitchen island; Walk-in closets; Closet cabinetry; French doors; Unfurnished
- Laundry & utility: Laundry area inside
Neighborhood map
What this means for you Summary
Snapshot
- This is a 3-bed/3.0-bath single-family listed at $675k.
Deal economics
- At list price, monthly cash flow is $25 ($305/yr) — positive.
- The deal already cash-flows at list — no discount required.
- To meet the 1% rule (rent ≥ 1% of price), the offer needs to be $532k (21.1% below list).
- Recommended offer: $532k (21.1% below list) — sets the bar for 1% rule.
- Cap rate 6.3% vs local median 3.1% in Pompano Beach — top-decile yield for the area; either an underpriced asset or a hidden risk that comps aren't pricing in. Stress-test before assuming the spread holds.
Location & tenants
- Location reads 74/100 on livability (#284 in FL, #4,541 nationally) — a middle-class / working-renter tenant base. Strengths: commute A+, housing A+, cost of living B+; Watch: employment D+, amenities F.
- Broward (suburban): math 42% / reading 53% proficiency, ranked #46 of 73 in FL (top 63%) — families likely to look elsewhere, expect single-tenant / working-renter base with shorter leases.
- Zoned schools: Pompano Beach Elementary School (math 32% / reading 37%, grade F, #1,709 of 2,144 statewide, top 81%, 486 students, 83% FRL); Pompano Beach Middle School (math 29% / reading 40%, grade F, #421 of 571 statewide, top 74%, 1,040 students, 73% FRL); Blanche Ely High School (math 7% / reading 29%, grade F, #570 of 667 statewide, top 86%, 1,906 students, 75% FRL) — zoned schools average 77% FRL vs 51% district-wide (26 pts higher); higher-poverty schools than district average — tighter screening recommended.
- Zoned-school proficiency averages 29% at this address vs 48% district-wide (-18 pts) — the specific schools serving this property underperform the Broward average; the district grade overstates school quality for this exact location.
- Market conditions: Rents soft (-0.4%/yr); 851 active listings in the ZIP; 40 comparable units currently listed for rent nearby; rentals at typical pace (median 26d on market — plan ~3-4 weeks tenant-placement turnaround); solid renter incomes; 2,111 units permitted in Broward County in 2024 (1,265 in 5+ unit buildings).
- At $5,323/mo this rent would consume 76% of the median local household income ($84k/yr) (locally 1298% of renters already pay >50% of income on rent) — very limited rent-growth headroom before tenants either downsize or default.
Forward outlook
- Local home prices are declining (-3.0%/yr); year-one equity from $5k of loan paydown is wiped out by about $20k of value loss. Plan a longer hold.
- Broward County population projected at +34% by 2050 — long-run rental-demand tailwind backs the buy-and-hold thesis.
Negotiation context
- It's been on market 76 days — a 6% lower offer ($634k) is reasonable based on typical stale-listing flexibility.
- 3 sale attempts with the ask held roughly flat each time — persistent listings suggest the price (not the market) is what's stuck; bring a comps-based counter.
- Current owner paid $345k; list at $675k implies a 96% gain — meaningful room to come down on a strong offer.
Risks & watch-outs
- Climate carrying-cost: major flood risk; severe wind risk, 99% chance of damaging wind over 30y; extreme-heat days projected 7→26/yr by 2055 (HVAC capex compounding) — expect insurance premiums to compound above CPI over the hold.
Questions for the listing agent
- It's been on market 76 days. Have you received any prior offers? Is the seller open to a 21% concession, seller financing, or rate buy-down credit?
- Why hasn't it sold? Are there any deal-killer items the seller is aware of (foundation, flood, title, zoning, code violations)?
- Is there a deadline driving the sale (1031 exchange, divorce, estate, relocation)? That informs how much negotiation room exists.
- Schools are D-rated, which usually means shorter tenancies and higher turnover. Who's the typical renter profile here, and what's been the actual vacancy rate?
- The area grade is low — what's the realistic commute time and amenity access for the typical tenant pool here? Any planned neighborhood developments (good or bad) we should know about?
- What's the average days-on-market for RENTAL listings here right now (not sales)? A rising rental-DOM trend means longer vacancies and softer asking-rent achievability than the comps imply.
- What's the recent tenant-quality profile in this submarket — average credit score on applications, eviction rate, late-payment / NSF rate, and stable-employment percentage? A property-management company in the area should have these aggregated.
- How much new for-sale + rental construction is in the pipeline within 1–3 miles? Heavy new supply typically softens prices + rents 12–24 months out; constrained supply supports both.
Investment metrics
- 1% rule
- 0.79% ✗
- Cap rate
- 6.34%
- Cash-on-cash
- 0.16%
- DSCR
- 1.01
- GRM
- 10.6
CMA / ARV
- ARV (on-the-fly)
- $1,004,400
- Comps found
- 3
Show comp detail 3 sales within ~0.75 mi
| Address | Dist | Beds/Ba | Sqft | Sold | Price | $/sf | Match |
|---|---|---|---|---|---|---|---|
| 1320 NE 27th Ave | 0.36mi | 3/3.0 | 1,981 (-8%) | 3mo | $619,000 | $312 | 67 |
| 1650 NE 27th Ave | 0.66mi | 4/3.0 (+1) | 2,132 (-1%) | 2mo | $1,125,000 | $528 | 60 |
| 2751 NE 7th St | 0.44mi | 2/2.0 (-1) | 1,926 (-11%) | 19mo | $895,000 | $465 | 37 |
Match score weights: distance 35% · size 25% · config 20% · recency 20%. Top-matched comps best support the ARV.
Projected returns pro-forma
-3.0% appreciation · 0.0% rent growth · sell at horizon
- IRR
- -19.2%
- Equity multiple
- 0.35×
- Total profit
- $-123,576
- Equity at exit
- $100,645
- IRR
- -18.6%
- Equity multiple
- 0.12×
- Total profit
- $-166,692
- Equity at exit
- $58,362
Cash invested: $189,000 (down + closing). Projections, not guarantees.
Landlord ↔ Tenant lean methodology
- Overall (STATE)
- 87 Strongly Landlord-Friendly
- State Florida
- 87 Strongly Landlord-Friendly · R+3
- County
- — inherits STATE
- City
- — inherits STATE
ZIP-level market 33062
- Rents YoY
- -0.4%
- Active inventory
- 851
- Price-to-rent
- 10.6×
Monthly cashflow live
- Estimated rent
- $5,323 high interval (Pro) →
- Mortgage (P&I)
- −$3,540
- Tax from tax record
- −$359 /mo · $4,303/yr
- Insurance
- −$281
- HOA
- −$0
- Vacancy / Maint / Mgmt
- −$1,118
- Net cashflow
- $25
Break-even live
Sensitivity live
| Price | -10% $408 | -5% $216 | +0% $25 | +5% $-166 | +10% $-357 |
|---|---|---|---|---|---|
| Rent | -10% $-395 | -5% $-185 | +0% $25 | +5% $236 | +10% $446 |
| Rate | -1.0pp $365 | -0.5pp $197 | base $25 | +0.5pp $-149 | +1.0pp $-327 |
UW: 25.0% down · 7.5% · 30yr · 1.5% tax · 5.0% vac · 8.0% maint · 8.0% mgmt
Financing live
Cash to close
- Down payment
- $168,750
- Closing costs
- $20,250
- Reserves months
- —
- Total cash needed
- —
Loan-product check · same deal, 3 products live
Conventional
25% down · 7.5% · 30yr
- Down + closing
- —
- Monthly P&I
- —
- Monthly cashflow
- —
- DSCR
- —
- Eligible?
- —
Personal DTI + credit; lowest rate.
DSCR
20% down · 8.5% · 30yr
- Down + closing
- —
- Monthly P&I
- —
- Monthly cashflow
- —
- DSCR
- —
- Eligible?
- —
No personal income docs; deal must DSCR.
Hard money
10% down · 12.0% · 12mo
- Down + closing
- —
- Monthly P&I
- —
- Monthly cashflow
- —
- DSCR
- —
- Eligible?
- —
Short-term bridge; refi at stabilization.
Rent comps 40 comps
| Address | Beds | Baths | Sqft | Rent | $/sqft | DOM | Units | Dist |
|---|---|---|---|---|---|---|---|---|
| 1016 NE 26th Ave Unit 1016 Pompano Beach, FL | 3.0 | 2.0 | 1624 | $10,500 | $6.47 | 26d | 1 | 0.04mi |
| 1151 NE 26th Ave Pompano Beach, FL | 2.0 | 2.0 | 2291 | $2,650 | $1.16 | 26d | 1 | 0.10mi |
| 954 NE 26th Ave Pompano Beach, FL | 2.0 | 2.0 | 1566 | $3,500 | $2.23 | 17d | 1 | 0.10mi |
| 1120 NE 24th Ave Unit 2 Pompano Beach, FL | 2.0 | 1.0 | 2948 | $2,800 | $0.95 | 26d | 1 | 0.11mi |
| 925 NE 26th Ave Unit 925 Pompano Beach, FL | 3.0 | 2.5 | 1822 | $4,800 | $2.63 | 22d | 1 | 0.17mi |
| 925 NE 25th Ave Pompano Beach, FL | 3.0 | 2.0 | 1642 | $5,000 | $3.05 | 26d | 1 | 0.17mi |
| 925 NE 25th Ave Pompano Beach, FL | 3.0 | 2.0 | 1642 | $5,000 | $3.05 | 17d | 1 | 0.17mi |
| 1211 NE 27th Ave Pompano Beach, FL | 2.0 | 2.0 | 1438 | $2,900 | $2.02 | 26d | 1 | 0.23mi |
| 2601 NE 8th Ct Pompano Beach, FL | 3.0 | 2.0 | 1647 | $5,800 | $3.52 | 26d | 1 | 0.27mi |
| 1240 NE 27th Ter Pompano Beach, FL | 4.0 | 4.0 | 2412 | $20,000 | $8.29 | 26d | 1 | 0.30mi |
| 2770 NE 8th Ct Pompano Beach, FL | 3.0 | 2.0 | 1777 | $7,000 | $3.94 | 5d | 1 | 0.34mi |
| 2770 NE 8th Ct Pompano Beach, FL | 3.0 | 2.0 | 1777 | $6,800 | $3.83 | 26d | 1 | 0.34mi |
| 708 NE 24th Ave Pompano Beach, FL | 3.0 | 2.0 | 1435 | $3,595 | $2.51 | 24d | 1 | 0.37mi |
| 2445 NE 14th St Unit 5-509 Pompano Beach, FL | 3.0 | 3.5 | 1728 | $3,500 | $2.03 | 26d | 1 | 0.48mi |
| 433 NE 24th Ave Unit 1541798P Pompano Beach, FL | 4.0 | 3.0 | 1862 | $6,243 | $3.35 | 5d | 1 | 0.50mi |
| 2612 NE 5th St Pompano Beach, FL | 3.0 | 2.5 | 1799 | $8,000 | $4.45 | 26d | 1 | 0.54mi |
| 3208 NE 8th Ct Unit 1 Pompano Beach, FL | 2.0 | 2.0 | 1552 | $2,300 | $1.48 | 26d | 1 | 0.55mi |
| 505 N Ocean Blvd Pompano Beach, FL | 2.0 | 2.0 | 1500 | $5,000 | $3.33 | 26d | 1 | 0.64mi |
| 299 N Riverside Dr #1006 Pompano Beach, FL | 2.0 | 2.0 | 1400 | $2,600 | $1.86 | 7d | 1 | 0.65mi |
| 299 N Riverside Dr #604 Pompano Beach, FL | 2.0 | 2.0 | 1400 | $3,000 | $2.14 | 0d | 1 | 0.65mi |
| 730 N Ocean Blvd #1201 Pompano Beach, FL | 2.0 | 2.5 | 1760 | $9,800 | $5.57 | 26d | 1 | 0.66mi |
| 2811 NE 16th St Pompano Beach, FL | 3.0 | 2.0 | 1794 | $5,250 | $2.93 | 16d | 1 | 0.69mi |
| 2752 NE 3rd St Pompano Beach, FL | 3.0 | 2.0 | 2077 | $7,000 | $3.37 | 26d | 1 | 0.71mi |
| 900 N Ocean Blvd Unit MPH04 Pompano Beach, FL | 3.0 | 3.5 | 2500 | $20,000 | $8.00 | 26d | 1 | 0.71mi |
| 900 N Ocean Blvd Pompano Beach, FL | 1.0–3.0 | 1.5–3.5 | 1834 | $18,500 | $10.09 | 6d | 6 | 0.72mi |
| 231 NE 20th Ave Pompano Beach, FL | 3.0 | 2.0 | 1650 | $2,950 | $1.79 | 26d | 1 | 0.74mi |
| 275 N Federal Hwy Pompano Beach, FL | 1.0–3.0 | 1.0–2.0 | 1117 | $3,655 | $3.27 | 0d | 8 | 0.74mi |
| 1116 N Ocean Blvd #1102 Pompano Beach, FL | 2.0 | 2.5 | 1923 | $15,000 | $7.80 | 26d | 1 | 0.75mi |
| 1116 N Ocean Blvd #1606 Pompano Beach, FL | 3.0 | 3.5 | 2593 | $18,000 | $6.94 | 26d | 1 | 0.75mi |
| 1116 N Ocean Blvd #304 Pompano Beach, FL | 3.0 | 3.5 | 2293 | $17,500 | $7.63 | 26d | 1 | 0.75mi |
| 2691 NE 18th St Pompano Beach, FL | 3.0 | 2.0 | 1509 | $4,800 | $3.18 | 26d | 1 | 0.77mi |
| 1367 N Ocean Blvd Pompano Beach, FL | 4.0 | 3.5 | 2092 | $8,500 | $4.06 | 26d | 1 | 0.79mi |
| 1371 N Ocean Blvd Pompano Beach, FL | 4.0 | 3.5 | 2092 | $7,000 | $3.35 | 26d | 1 | 0.81mi |
| 133 N Pompano Beach Blvd Pompano Beach, FL | 1.0–2.0 | 1.5–2.5 | 1065 | $4,300 | $4.04 | 26d | 6 | 0.82mi |
| 133 N Pompano Beach Blvd Pompano Beach, FL | 1.0–2.0 | 1.5–2.5 | 1065 | $4,300 | $4.04 | 6d | 7 | 0.82mi |
| 111 N Pompano Beach Blvd Pompano Beach, FL | 2.0 | 2.0 | 1368 | $2,898 | $2.12 | 26d | 2 | 0.85mi |
| 1717 N Riverside Dr Pompano Beach, FL | 4.0 | 3.0 | 1842 | $6,300 | $3.42 | 26d | 1 | 0.88mi |
| 1 N Ocean Blvd #1004 Pompano Beach, FL | 2.0 | 2.5 | 1967 | $8,000 | $4.07 | 26d | 1 | 0.91mi |
| 1 N Ocean Blvd #1214 Pompano Beach, FL | 2.0 | 2.0 | 1470 | $7,500 | $5.10 | 26d | 1 | 0.91mi |
| 1 N Ocean Blvd #1411 Pompano Beach, FL | 2.0 | 2.0 | 1442 | $5,900 | $4.09 | 26d | 1 | 0.91mi |
Listing history 25 events
-
2026-06-21days on market $675,000 Active 76 DOM
-
2026-06-18days on market $675,000 Active 73 DOM
-
2026-06-17days on market $675,000 Active 72 DOM
-
2026-06-16days on market $675,000 Active 71 DOM
-
2026-06-15days on market $675,000 Active 70 DOM
-
2026-06-13days on market $675,000 Active 68 DOM
-
2026-06-09days on market $675,000 Active 64 DOM
-
2026-06-08days on market $675,000 Active 63 DOM
-
2026-06-07days on market $675,000 Active 62 DOM
-
2026-06-04days on market $675,000 Active 59 DOM
-
2026-06-03days on market $675,000 Active 58 DOM
-
2026-06-02days on market $675,000 Active 57 DOM
-
2026-06-01days on market $675,000 Active 56 DOM
-
2026-05-31days on market $675,000 Active 55 DOM
-
2026-05-10price $675,000
-
2026-04-03$689,000 Active
-
2026-02-24historical $4,250
-
2026-01-17price $699,000
-
2025-12-11price $4,250
-
2025-12-04$5,000
-
2025-12-03historical $5,000
-
2025-12-03$5,000
-
2025-11-06price $725,000
-
2025-09-03price $749,000
-
2008-07-28soldstatus $345,000
ⓘ Source: listings_history table (triggers on properties + properties_extension) + one-shot
backfill from property_details.listing_events for pre-trigger history.
Tax reassessment forecast FL · Resets to sale price
- Current annual tax
- $4,303 · $359/mo
- Projected year-2 tax
- $5,602 · $467/mo
- Expected delta
- +$1,299/yr (+$108/mo · 30.2%)
ⓘ Screening estimate from a state-policy table — verify with the county assessor before closing.
Climate risk First Street
- Flood 6/10 Major FEMA zone X (shaded) · 54% chance over 30 yrs
- Wildfire 1/10 Low
- Heat 10/10 Extreme 7 d/yr ≥106°F today · 26 d/yr by 30 yrs out
- Wind 10/10 Extreme 99% chance of damaging wind over 30 yrs
- Air quality 2/10 Low 1 unhealthy d/yr today · 2 by 30 yrs out
Nearby sold comps map
Loading sold comps map…
Walkable amenities ~0.75 mi
Loading nearby amenities…
Taxation est. · year 1
- Rental income
- $63,874
- − Mortgage interest
- −$37,810
- − Property taxes
- −$4,303
- − Insurance
- −$3,375
- − Repairs & maintenance
- −$5,110
- − Management
- −$5,110
- − Depreciation
- −$19,636
- Taxable loss
- −$11,471
- Est. tax savings @ 24.0%
- +$2,753
- After-tax cash flow
- $3,058/yr
For passive investors: Depreciation is non-cash, so a rental often shows a tax loss while cash-flowing — sheltering income. Rental losses are passive: they offset passive income freely, and up to $25,000/yr can offset ordinary (W-2) income if you actively participate and your MAGI is under $100k (phasing out to $0 by $150k); unused losses carry forward. On sale, claimed depreciation is recaptured at up to 25%, and gains may owe capital-gains tax (a 1031 exchange can defer both). Figures are a year-1 estimate at your 24.0% rate — not tax advice; consult a CPA.
Schools (NCES district)
- District
- Broward
- NCES district ID
- 1200180
- Math proficiency
- 42% ▼ -18.00%
- Reading proficiency
- 53% ▼ -5.00%
- Median HH income
- $52,139
- Composite
- 40.88/100
- National rank
- #3621
- State rank
- #46 of 73 in FL
Livability — Pompano Beach
- Score
- 74/100
- State rank
- #284
- US rank
- #4541
Category grades
Schools grade is shown separately in the Schools card above.
Census & demographics
- Census place
- Pompano Beach, FL
- County
- Broward County · 1,963,430 people
- City population
- 155,861
- Metro
- Miami-Fort Lauderdale-Pompano Beach, FL
- Population (ZIP)
- 24,920
- Household income
- $83,582
- Rent vs Own
- Severe rent burden
- 1298.0
Population outlook (Broward County) Hauer SSP2
- Today (2025)
- 2,207,033 people
- By 2030
- 2,360,704 · +7.0%
- By 2040
- 2,661,208 · +20.6%
- By 2050
- 2,946,698 · +33.5%
- By 2075
- 3,602,273 · +63.2%
- By 2100
- 3,970,984 · +79.9%
Race, ethnicity, and origin ACS 2023
- Neighborhood character
- Predominantly White (76%)
- Race & ethnicity
- White 76% Hispanic / Latino 16% Two or more races 12% Black 3%
- Hispanic origin (detail)
- Puerto Rican 4% Cuban 3%
- Common ancestry
- Romanian 4% Italian 3% Scotch-Irish 2%
- Foreign-born
- 22% · Canada, Jamaica, Dominican Republic
- Languages at home
- 74% English-only · Spanish 14% Other Indo-European 4% Russian/Polish/Slavic 2%
Political lean MEDSL · Broward
- 2024 margin
- D (+17.0) · D 58.0% · R 41.0%
- 2008→2024 swing
- -17.8pp toward R · 2008: 34.7pp · 2024: 17.0pp
- All cycles
- 2024: D+17.0 2020: D+29.8 2016: D+35.0 2012: D+34.9 2008: D+34.7
Not yet ingested
- Civics
- —
Market trends
- HPI YoY
- ▼ -427.01%
- Current HPI
- 342.9461
- Rent YoY
- ▼ -0.36%
- Metro
- Miami-Fort Lauderdale-Pompano Beach, FL
- State GDP YoY
- ▲ 3.28%
- F500 in state
- 36
Industry mix (Fortune 500 HQ in FL)
| Industry | F500 HQs | Revenue |
|---|---|---|
| Industrial Technology | 2 | $29B |
|
||
| Insurance | 2 | $17B |
|
||
| Retail | 1 | $60B |
|
||
| Technology Distribution | 1 | $58B |
|
||
| Homebuilding | 1 | $35B |
|
||
| Technology Manufacturing | 1 | $35B |
|
||
Price history
+95.7% since first listed11 events — show timeline
- 2026-05-10 Price Changed $675,000 Beaches MLS
- 2026-04-03 Listed $689,000 Beaches MLS
- 2026-02-24 Rental Removed $4,250 GFLMLS
- 2026-01-17 Price Changed $699,000 Beaches MLS
- 2025-12-11 Price Changed $4,250 GFLMLS
- 2025-12-04 Listed for Rent $5,000 GFLMLS
- 2025-12-03 Rental Removed $5,000 RMLSFL
- 2025-12-03 Listed for Rent $5,000 RMLSFL
- 2025-11-06 Price Changed $725,000 Beaches MLS
- 2025-09-03 Price Changed $749,000 Beaches MLS
- 2008-07-28 Sold (Public Records) $345,000 Public Records
Property tax history
+0.6%/yrLatest (2025): $4,303 · +3.7% YoY. Source: county tax records.
Cash-flow waterfall
monthlySold comps — $/sqft
last 12 mo · ≤1 miLoading sold comps…