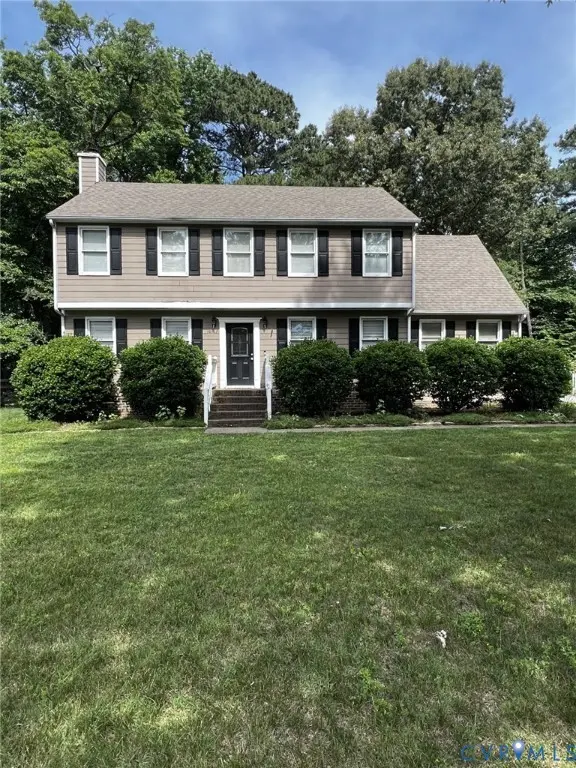
10167 Drawbridge Ct · Mechanicsville, VA
Flood risk 1/10 · Minimal
- FEMA flood zone
- X (unshaded)
- Chance of flooding over 30 yrs
- 0.0%
- Est. flood insurance / yr
- $507 – $1,088
Fire risk 3/10 · Minor
- Est. fire insurance / yr
- $666 – $1,236
Heat risk 7/10 · Major
- Hot days now (above 103°F)
- 7 days/yr
- Hot days in 30 yrs
- 17 days/yr
Wind risk 6/10 · Moderate
- Chance of severe wind over 30 yrs
- 27.0%
Air-quality risk 2/10 · Minimal
- Unhealthy air days now
- 0 days/yr
- Unhealthy air days in 30 yrs
- 1 days/yr
Risk factors via First Street. Map © Google.
Why this score? — see what drove the D+ grade
The composite is a weighted blend of 9 inputs, each scored 0–100. Each bar is that input's sub-score; the figure is the points it added to the 100-point composite (weight × sub-score).
- ARV discount +15.0/15.0
- Cash flow +11.5/30.0
- Schools +7.0/10.0
- Livability +3.7/5.0
- DSCR +3.4/10.0
- 1% rule +2.8/10.0
- Rent growth +2.5/5.0
- Condition / age +2.5/5.0
- Appreciation +0.0/10.0
$369,000
🖨 Deal sheet (PDF) 📄 Offer letter ✓ Due diligence
Listing remarks MLS
Don't wait to see this 4 bdrm, 2.5 bath, Colonial. This homes' features include a rear staircase, a wood burning fireplace in the family rm, & berber carpeting that's just 2 yrs old. The kitchen has a breakfast area w/ skylights. 1 car garage & a lg storage shed with elec. Lg, double wide, black top drive. Gutters and fenced rear yard.
Key facts
- Sliding glass doors
- Sunny morning room
- Screened porch
Tags
Property features AI
Exterior
- Parking: Attached garage (1 car); Driveway parking; Off-street paved parking; Garage with door opener
- Utilities: Public water; Public sewer; Electric service
- Home design: Two-story home; Resale property; Composition roof; Brick, block, hardboard and drywall construction
- Construction: Built using brick, block, hardboard and drywall; Composition roof
- Exterior features: Deck; Rear screened porch; Storage shed; Paved driveway; Fenced backyard; Level topography; Landscaped; Cul-de-sac lot
Interior
- Kitchen: Refrigerator; Oven; Electric cooking; Dishwasher; Pantry; Laminate counters; Eat-in kitchen
- Bedrooms: Includes primary bedroom with private bath
- Flooring: Laminate; Linoleum; Partially carpeted; Wood
- Bathrooms: 2 full bathrooms; 1 half bathroom
- Heating & cooling: Heat pump heating; Electric heating; Central air conditioning; Electric cooling
- Interior features: Ceiling fans; Cathedral ceilings; Separate/formal dining room; Eat-in kitchen; Fireplace (wood burning); Laminate counters; Pantry; Skylights; Walk-in closet(s); Sliding doors; Skylight(s)
- Laundry & utility: Electric water heater
Neighborhood map
What this means for you Summary
Snapshot
- This is a 4-bed/2.5-bath single-family listed at $369k.
Deal economics
- At list price, monthly cash flow is $-119 ($-1k/yr) — negative.
- To cash-flow at today's rent, offer at most $348k (5.7% below list).
- To meet the 1% rule (rent ≥ 1% of price), the offer needs to be $286k (22.4% below list).
- Recommended offer: $286k (22.4% below list) — sets the bar for 1% rule.
- Cap rate 5.9% vs local median 3.1% in Mechanicsville — top-decile yield for the area; either an underpriced asset or a hidden risk that comps aren't pricing in. Stress-test before assuming the spread holds.
Location & tenants
- Location reads 73/100 on livability (#165 in VA) — a middle-class / working-renter tenant base. Strengths: schools A+, employment A+, housing A+; Watch: amenities F, commute F.
- Hanover County Public School District (suburban): math 79% / reading 81% proficiency, ranked #5 of 131 in VA (top 4%) — strong family-tenant draw, lease renewals of 3-5y typical; only 15% free/reduced lunch — higher-income household profile.
- Market conditions: 183 active listings in the ZIP; 2 comparable units currently listed for rent nearby; high-income renter base; 447 units permitted in Hanover County in 2024 (0 in 5+ unit buildings).
Forward outlook
- Local home prices are declining (-3.0%/yr); year-one equity from $3k of loan paydown is wiped out by about $11k of value loss. Plan a longer hold.
- Hanover County population projected at +11% by 2050 — modest demand growth; plan on rents tracking national, not racing it.
Negotiation context
- Only 8 days on market — expect competitive offers; lowballing is unlikely to land.
- 3 sale attempts since 22y ago with the ask held roughly flat each time — persistent listings suggest the price (not the market) is what's stuck; bring a comps-based counter.
- Current owner paid $210k; list at $369k implies a 76% gain — meaningful room to come down on a strong offer.
Risks & watch-outs
- Climate carrying-cost: major wind risk, 27% chance of damaging wind over 30y; extreme-heat days projected 7→17/yr by 2055 (HVAC capex compounding) — expect insurance premiums to compound above CPI over the hold.
Questions for the listing agent
- What do current leases actually rent for vs. the listed asking? Can we see a recent rent roll and the last 12 months of T-12 income?
- Is there a deadline driving the sale (1031 exchange, divorce, estate, relocation)? That informs how much negotiation room exists.
- Schools are A-rated — typically a magnet for longer-tenancy family renters. What's the average tenant stay here, and is there a school-zone premium baked into asking?
- The area grade is low — what's the realistic commute time and amenity access for the typical tenant pool here? Any planned neighborhood developments (good or bad) we should know about?
- What's the average days-on-market for RENTAL listings here right now (not sales)? A rising rental-DOM trend means longer vacancies and softer asking-rent achievability than the comps imply.
- What's the recent tenant-quality profile in this submarket — average credit score on applications, eviction rate, late-payment / NSF rate, and stable-employment percentage? A property-management company in the area should have these aggregated.
- How much new for-sale + rental construction is in the pipeline within 1–3 miles? Heavy new supply typically softens prices + rents 12–24 months out; constrained supply supports both.
Investment metrics
- 1% rule
- 0.78% ✗
- Cap rate
- 5.91%
- Cash-on-cash
- -1.38%
- DSCR
- 0.94
- GRM
- 10.7
CMA / ARV
- ARV (on-the-fly)
- $471,150
- Comps found
- 12
Show comp detail 12 sales within ~0.75 mi
| Address | Dist | Beds/Ba | Sqft | Sold | Price | $/sf | Match |
|---|---|---|---|---|---|---|---|
| 9322 Ravensworth Ct | 0.08mi | 4/2.5 | 2,127 (+2%) | 6mo | $475,000 | $223 | 89 |
| 10157 Peridot Ct | 0.11mi | 4/3.0 | 2,024 (-3%) | 0mo | $450,000 | $222 | 87 |
| 10072 Beechwood Dr | 0.37mi | 4/2.5 | 2,132 (+2%) | 3mo | $462,000 | $217 | 77 |
| 10052 Beechwood Dr | 0.45mi | 4/2.5 | 2,126 (+2%) | 2mo | $405,000 | $190 | 75 |
| 10247 Finlandia Ln | 0.36mi | 4/2.5 | 2,208 (+5%) | 3mo | $383,000 | $173 | 71 |
| 10288 Smythes Cottage Way | 0.49mi | 4/2.5 | 2,197 (+5%) | 3mo | $526,000 | $239 | 67 |
| 10292 Wanchese Way | 0.60mi | 4/2.5 | 2,079 (-1%) | 7mo | $469,950 | $226 | 65 |
| 9288 Kings Charter Dr | 0.52mi | 4/2.5 | 1,961 (-6%) | 0mo | $512,000 | $261 | 65 |
| 10288 Wanchese Way | 0.58mi | 4/2.5 | 2,066 (-1%) | 7mo | $470,000 | $227 | 64 |
| 10311 Aynhoe Ct | 0.66mi | 4/2.5 | 2,150 (+3%) | 4mo | $475,000 | $221 | 61 |
| 9315 Plymouth Pl | 0.18mi | 3/3.0 (-1) | 1,780 (-15%) | 1mo | $400,000 | $225 | 59 |
| 10101 Ashley Manor Ln | 0.62mi | 3/2.5 (-1) | 2,285 (+9%) | 3mo | $519,900 | $228 | 48 |
Match score weights: distance 35% · size 25% · config 20% · recency 20%. Top-matched comps best support the ARV.
Projected returns pro-forma
-3.0% appreciation · 3.0% rent growth · sell at horizon
- IRR
- -18.6%
- Equity multiple
- 0.35×
- Total profit
- $-67,430
- Equity at exit
- $55,019
- IRR
- -11.1%
- Equity multiple
- 0.33×
- Total profit
- $-68,719
- Equity at exit
- $31,904
Cash invested: $103,320 (down + closing). Projections, not guarantees.
Landlord ↔ Tenant lean methodology
- Overall (STATE)
- 55 Moderately Landlord-Leaning
- State Virginia
- 55 Moderately Landlord-Leaning · D+2
- County
- — inherits STATE
- City
- — inherits STATE
ZIP-level market 23116
- Home prices YoY
- -9.5%
- Active inventory
- 183
- Price-to-rent
- 10.7×
Monthly cashflow live
- Estimated rent
- $2,862 medium interval (Pro) →
- Mortgage (P&I)
- −$1,935
- Tax from tax record
- −$291 /mo · $3,497/yr
- Insurance
- −$154
- HOA
- −$0
- Vacancy / Maint / Mgmt
- −$601
- Net cashflow
- $-119
Break-even live
Sensitivity live
| Price | -10% $90 | -5% $-14 | +0% $-119 | +5% $-223 | +10% $-328 |
|---|---|---|---|---|---|
| Rent | -10% $-345 | -5% $-232 | +0% $-119 | +5% $-6 | +10% $107 |
| Rate | -1.0pp $67 | -0.5pp $-25 | base $-119 | +0.5pp $-215 | +1.0pp $-312 |
UW: 25.0% down · 7.5% · 30yr · 1.5% tax · 5.0% vac · 8.0% maint · 8.0% mgmt
Financing live
Cash to close
- Down payment
- $92,250
- Closing costs
- $11,070
- Reserves months
- —
- Total cash needed
- —
Loan-product check · same deal, 3 products live
Conventional
25% down · 7.5% · 30yr
- Down + closing
- —
- Monthly P&I
- —
- Monthly cashflow
- —
- DSCR
- —
- Eligible?
- —
Personal DTI + credit; lowest rate.
DSCR
20% down · 8.5% · 30yr
- Down + closing
- —
- Monthly P&I
- —
- Monthly cashflow
- —
- DSCR
- —
- Eligible?
- —
No personal income docs; deal must DSCR.
Hard money
10% down · 12.0% · 12mo
- Down + closing
- —
- Monthly P&I
- —
- Monthly cashflow
- —
- DSCR
- —
- Eligible?
- —
Short-term bridge; refi at stabilization.
Rent comps 2 comps
| Address | Beds | Baths | Sqft | Rent | $/sqft | DOM | Units | Dist |
|---|---|---|---|---|---|---|---|---|
| 9207 Abingdon Manor Ct Mechanicsville, VA | 4.0 | 3.0 | 2257 | $2,750 | $1.22 | 22d | 1 | 0.61mi |
| 10312 Colony Bee Pl Mechanicsville, VA | 3.0 | 2.5 | 2137 | $2,600 | $1.22 | 45d | 1 | 1.14mi |
Listing history 8 events
-
2026-06-18status $369,000 Pending 8 DOM
-
2026-06-17days on market $369,000 Active 8 DOM
-
2026-06-16days on market $369,000 Active 7 DOM
-
2026-06-15days on market $369,000 Active 6 DOM
-
2026-06-13days on market $369,000 Active 4 DOM
-
2026-06-13days on market $369,000 Active 3 DOM
-
2026-06-10remarks 699-char remark
-
2026-06-10$369,000 Active 1 DOM
ⓘ Source: listings_history table (triggers on properties + properties_extension) + one-shot
backfill from property_details.listing_events for pre-trigger history.
Tax reassessment forecast VA · Resets to sale price
- Current annual tax
- $3,497 · $291/mo
- Projected year-2 tax
- $3,497 · $291/mo
- Expected delta
- $0/yr ($0/mo · 0.0%)
ⓘ Screening estimate from a state-policy table — verify with the county assessor before closing.
Climate risk First Street
- Flood 1/10 Low FEMA zone X (unshaded) · 0% chance over 30 yrs
- Wildfire 3/10 Moderate
- Heat 7/10 Severe 7 d/yr ≥103°F today · 17 d/yr by 30 yrs out
- Wind 6/10 Major 27% chance of damaging wind over 30 yrs
- Air quality 2/10 Low 0 unhealthy d/yr today · 1 by 30 yrs out
Nearby sold comps map
Loading sold comps map…
Walkable amenities ~0.75 mi
Loading nearby amenities…
Taxation est. · year 1
- Rental income
- $34,349
- − Mortgage interest
- −$20,670
- − Property taxes
- −$3,497
- − Insurance
- −$1,845
- − Repairs & maintenance
- −$2,748
- − Management
- −$2,748
- − Depreciation
- −$10,735
- Taxable loss
- −$7,893
- Est. tax savings @ 24.0%
- +$1,894
- After-tax cash flow
- $467/yr
For passive investors: Depreciation is non-cash, so a rental often shows a tax loss while cash-flowing — sheltering income. Rental losses are passive: they offset passive income freely, and up to $25,000/yr can offset ordinary (W-2) income if you actively participate and your MAGI is under $100k (phasing out to $0 by $150k); unused losses carry forward. On sale, claimed depreciation is recaptured at up to 25%, and gains may owe capital-gains tax (a 1031 exchange can defer both). Figures are a year-1 estimate at your 24.0% rate — not tax advice; consult a CPA.
Schools (NCES district)
- District
- Hanover County Public School District
- NCES district ID
- 5101830
- Math proficiency
- 79% ▼ -11.00%
- Reading proficiency
- 81% ▼ -3.00%
- Median HH income
- $78,386
- Composite
- 70.37/100
- National rank
- #268
- State rank
- #5 of 131 in VA
Livability — Mechanicsville
- Score
- 73/100
- State rank
- #165
- US rank
- #5098
Category grades
Schools grade is shown separately in the Schools card above.
Census & demographics
- County
- Hanover County · 134,767 people
- City population
- 72,258
- Metro
- Richmond, VA
- Population (ZIP)
- 34,188
- Household income
- $141,711
- Rent vs Own
- Severe rent burden
- 193.0
Population outlook (Hanover County) Hauer SSP2
- Today (2025)
- 111,687 people
- By 2030
- 115,373 · +3.3%
- By 2040
- 120,828 · +8.2%
- By 2050
- 123,591 · +10.7%
- By 2075
- 132,168 · +18.3%
- By 2100
- 130,105 · +16.5%
Race, ethnicity, and origin ACS 2023
- Neighborhood character
- Predominantly White (83%)
- Race & ethnicity
- White 83% Black 7% Two or more races 5% Asian 2% Hispanic / Latino 2%
- Common ancestry
- Slovak 3% Lithuanian 3% Serbian 2%
- Foreign-born
- 3% · Canada, Philippines
- Languages at home
- 97% English-only · Spanish 1% Other Asian/Pacific 1% Other Indo-European 1%
Political lean MEDSL · Hanover
- 2024 margin
- Strong R (+25.8) · D 36.6% · R 62.4% · Other 1.1%
- 2008→2024 swing
- +7.8pp toward D · 2008: -33.6pp · 2024: -25.8pp
- All cycles
- 2024: R+25.8 2020: R+26.8 2016: R+32.5 2012: R+36.7 2008: R+33.6
Not yet ingested
- Civics
- —
Market trends
- HPI YoY
- ▼ -26.62%
- Current HPI
- 253.8652
- Rent YoY
- —
- Metro
- Richmond, VA
- State GDP YoY
- ▲ 2.40%
- F500 in state
- 50
Industry mix (Fortune 500 HQ in VA)
| Industry | F500 HQs | Revenue |
|---|---|---|
| Aerospace / Defense | 4 | $236B |
|
||
| Technology / Defense | 3 | $32B |
|
||
| Financial Services | 2 | $176B |
|
||
| Utilities | 2 | $27B |
|
||
| Insurance | 2 | $25B |
|
||
| Technology | 2 | $15B |
|
||
Price history
+218.1% since first listed9 events — show timeline
- 2026-06-07 Listed $369,000 CVRMLS
- 2004-07-15 Sold (Public Records) $210,000 Public Records
- 2004-07-09 Sold (MLS) $210,000 CVRMLS
- 2004-07-09 Sold (MLS) $210,000 CVRMLS
- 2004-06-23 Listed $210,000 CVRMLS
- 2004-06-23 Listed $210,000 CVRMLS
- 2001-12-04 Sold (Public Records) $174,000 Public Records
- 1996-05-01 Sold (Public Records) $142,000 Public Records
- 1989-08-01 Sold (Public Records) $116,000 Public Records
Property tax history
+5.8%/yrLatest (2026): $3,497 · +8.7% YoY. Source: county tax records.
Cash-flow waterfall
monthlySold comps — $/sqft
last 12 mo · ≤1 miLoading sold comps…