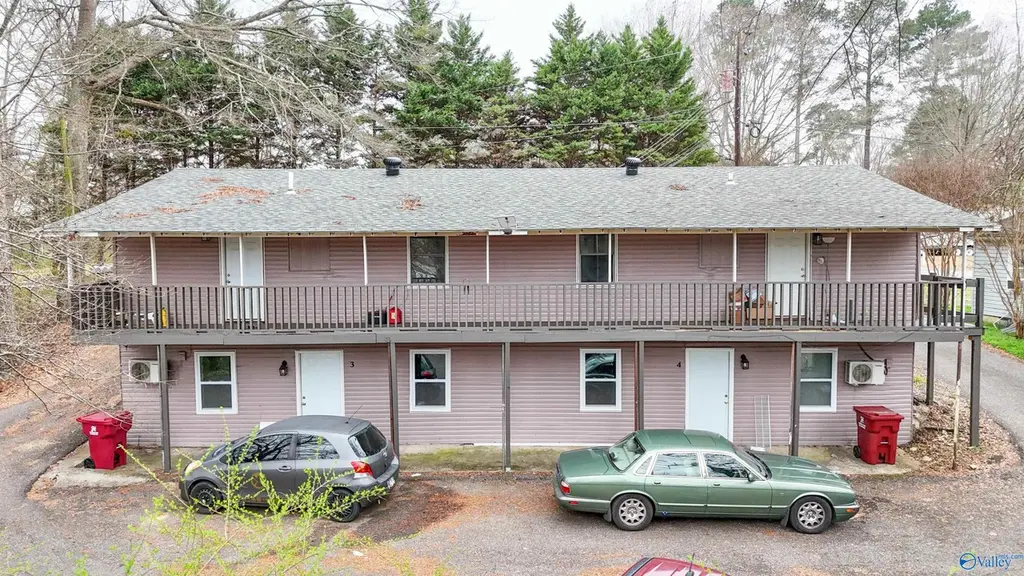
 Fourplex
415 2nd Ave SE · Hamilton, AL
Flood risk 1/10 · Minimal
- FEMA flood zone
- X (unshaded)
- Chance of flooding over 30 yrs
- 0.0%
- Est. flood insurance / yr
- $473 – $860
Fire risk 4/10 · Minor
- Est. fire insurance / yr
- $916 – $1,700
Heat risk 6/10 · Moderate
- Hot days now (above 108°F)
- 7 days/yr
- Hot days in 30 yrs
- 20 days/yr
Wind risk 6/10 · Moderate
- Chance of severe wind over 30 yrs
- 27.0%
Air-quality risk 2/10 · Minimal
- Unhealthy air days now
- 0 days/yr
- Unhealthy air days in 30 yrs
- 1 days/yr
Risk factors via First Street. Map © Google.
Why this score? — see what drove the C grade
The composite is a weighted blend of 9 inputs, each scored 0–100. Each bar is that input's sub-score; the figure is the points it added to the 100-point composite (weight × sub-score).
- Cash flow +23.1/30.0
- ARV discount +7.5/15.0
- DSCR +7.4/10.0
- 1% rule +6.0/10.0
- Livability +3.2/5.0
- Schools +2.8/10.0
- Rent growth +2.5/5.0
- Condition / age +2.5/5.0
- Appreciation +0.0/10.0
$280,000
🖨 Deal sheet (PDF) 📄 Offer letter ✓ Due diligence
Multi-family units
County records classify this as Multi-Family (5+ Unit). Listing-text estimate: 4 units. estimate disagrees with records
5+ unit building — per-unit beds/baths from public records are typically unavailable; the breakdown below (if shown) is an estimate from the listing text.
Listing remarks MLS
This fully renovated 4-plex is an investor’s goldmine. Here’s what makes this property special: All 4 units are rented out. Each units features 2-bedroom, 1-bath with open floor plans. Complete renovations: new HVAC, electrical, plumbing, flooring, updated kitchens, bathrooms, and 4-year-old shingle roof. Each unit comes fully equipped: washer, dryer, stove, refrigerator. This is turnkey income production at its finest with maximum cash flow potential. All units are currently rented with a total monthly income of $3,100.
Key facts
- 0.8 acre lot
- 4 parking spots
- Listed 104 days
Neighborhood map
What this means for you Summary
Snapshot
- This is a 4 × 2-bed/1-bath units multifamily listed at $280k.
Deal economics
- At list price, monthly cash flow is $505 ($6k/yr) — positive. Per door: $126/mo.
- The deal already cash-flows at list — no discount required.
- Meets the 1% rule at list price ($3k rent vs $280k).
- Recommended offer: $255k (9.0% below list) — sets the bar for market timing.
- Cap rate 8.5% vs local median 2.9% in Hamilton — top-decile yield for the area; either an underpriced asset or a hidden risk that comps aren't pricing in. Stress-test before assuming the spread holds.
Location & tenants
- Location reads 63/100 on livability (#190 in AL) — a middle-class / working-renter tenant base. Strengths: cost of living A+, housing A+, crime B; Watch: schools D, amenities F, commute F.
- Marion County (rural): math 20% / reading 48% proficiency, ranked #56 of 129 in AL (top 43%) — families likely to look elsewhere, expect single-tenant / working-renter base with shorter leases.
- Market conditions: 93 active listings in the ZIP; 1 units permitted in Marion County in 2024 (0 in 5+ unit buildings).
Forward outlook
- Local home prices are declining (-3.0%/yr); year-one equity from $2k of loan paydown is wiped out by about $8k of value loss. Plan a longer hold.
- Marion County population projected at -16% by 2050 — secular population decline; favor cash flow + early exit over multi-decade hold.
Negotiation context
- It's been on market 104 days — a 9% lower offer ($255k) is reasonable based on typical stale-listing flexibility.
- 2 sale attempts since 4y ago; this cycle's ask has dropped $20k (7%) from the opening price — seller is motivated, your offer sets the floor, not the list.
- Current owner paid $75k; list at $280k implies a 273% gain — meaningful room to come down on a strong offer.
Risks & watch-outs
- Climate carrying-cost: major wind risk, 27% chance of damaging wind over 30y; extreme-heat days projected 7→20/yr by 2055 (HVAC capex compounding) — expect insurance premiums to compound above CPI over the hold.
Questions for the listing agent
- It's been on market 104 days. Have you received any prior offers? Is the seller open to a 9% concession, seller financing, or rate buy-down credit?
- Can we see the unit-by-unit rent roll, current vacancy, and any below-market leases? What's the average tenancy length?
- What capital expenditures (roof, boiler, parking lot, exteriors) have been made in the last 5 years, and what's planned in the next 2?
- Why hasn't it sold? Are there any deal-killer items the seller is aware of (foundation, flood, title, zoning, code violations)?
- Is there a deadline driving the sale (1031 exchange, divorce, estate, relocation)? That informs how much negotiation room exists.
- Schools are D-rated, which usually means shorter tenancies and higher turnover. Who's the typical renter profile here, and what's been the actual vacancy rate?
- What's the average days-on-market for RENTAL listings here right now (not sales)? A rising rental-DOM trend means longer vacancies and softer asking-rent achievability than the comps imply.
- What's the recent tenant-quality profile in this submarket — average credit score on applications, eviction rate, late-payment / NSF rate, and stable-employment percentage? A property-management company in the area should have these aggregated.
- How much new apartment / multifamily construction is in the pipeline within 1–3 miles? Heavy new supply (>2% of stock underway) typically softens rents 12–24 months out; light construction supports rent growth.
Investment metrics
- 1% rule
- 1.10% ✓
- Cap rate
- 8.46%
- Cash-on-cash
- 7.72%
- DSCR
- 1.34
- GRM
- 7.6
CMA / ARV
- ARV (median comp)
- $136,933
- List price
- $280,000
- Delta
- 104.48%
- Verdict
- OVERPRICED
- Comps
- 1 within 2.0 mi
Projected returns pro-forma
-3.0% appreciation · 3.0% rent growth · sell at horizon
- IRR
- -4.5%
- Equity multiple
- 0.83×
- Total profit
- $-13,193
- Equity at exit
- $41,749
- IRR
- 5.2%
- Equity multiple
- 1.38×
- Total profit
- $30,076
- Equity at exit
- $24,209
Cash invested: $78,400 (down + closing). Projections, not guarantees.
Landlord ↔ Tenant lean methodology
- Overall (STATE)
- 90 Strongly Landlord-Friendly
- State Alabama
- 90 Strongly Landlord-Friendly · R+15
- County
- — inherits STATE
- City
- — inherits STATE
ZIP-level market 35570
- Home prices YoY
- -7.8%
- Active inventory
- 93
- Price-to-rent
- 30.2×
Monthly cashflow live
- Estimated rent
- $3,088 medium interval (Pro) →
- Mortgage (P&I)
- −$1,468
- Tax est. 1.5%
- −$350 /mo · $4,200/yr
- Insurance
- −$117
- HOA
- −$0
- Vacancy / Maint / Mgmt
- −$648
- Net cashflow
- $505
Break-even live
Sensitivity live
| Price | -10% $698 | -5% $601 | +0% $505 | +5% $408 | +10% $311 |
|---|---|---|---|---|---|
| Rent | -10% $261 | -5% $383 | +0% $505 | +5% $626 | +10% $748 |
| Rate | -1.0pp $646 | -0.5pp $576 | base $505 | +0.5pp $432 | +1.0pp $358 |
4-unit breakdown (identical units grouped — click to expand)
| Units | Beds | Baths | Est. rent |
|---|---|---|---|
| 4× units | 2 | 1 | $3,088 |
| #1 | 2 | 1 | $772 |
| #2 | 2 | 1 | $772 |
| #3 | 2 | 1 | $772 |
| #4 | 2 | 1 | $772 |
| Total (4 units) | $3,088 | ||
UW: 25.0% down · 7.5% · 30yr · 1.5% tax · 5.0% vac · 8.0% maint · 8.0% mgmt
Financing live
Cash to close
- Down payment
- $70,000
- Closing costs
- $8,400
- Reserves months
- —
- Total cash needed
- —
Loan-product check · same deal, 3 products live
Conventional
25% down · 7.5% · 30yr
- Down + closing
- —
- Monthly P&I
- —
- Monthly cashflow
- —
- DSCR
- —
- Eligible?
- —
Personal DTI + credit; lowest rate.
DSCR
20% down · 8.5% · 30yr
- Down + closing
- —
- Monthly P&I
- —
- Monthly cashflow
- —
- DSCR
- —
- Eligible?
- —
No personal income docs; deal must DSCR.
Hard money
10% down · 12.0% · 12mo
- Down + closing
- —
- Monthly P&I
- —
- Monthly cashflow
- —
- DSCR
- —
- Eligible?
- —
Short-term bridge; refi at stabilization.
Listing history 22 events
-
2026-06-21days on market $280,000 Active 104 DOM
-
2026-06-19days on market $280,000 Active 102 DOM
-
2026-06-18days on market $280,000 Active 101 DOM
-
2026-06-17days on market $280,000 Active 100 DOM
-
2026-06-16days on market $280,000 Active 99 DOM
-
2026-06-15days on market $280,000 Active 98 DOM
-
2026-06-14days on market $280,000 Active 96 DOM
-
2026-06-12days on market $280,000 Active 95 DOM
-
2026-06-09days on market $280,000 Active 92 DOM
-
2026-06-08days on market $280,000 Active 91 DOM
-
2026-06-07days on market $280,000 Active 90 DOM
-
2026-06-04days on market $280,000 Active 86 DOM
-
2026-06-02days on market $280,000 Active 85 DOM
-
2026-06-01days on market $280,000 Active 84 DOM
-
2026-05-31days on market $280,000 Active 83 DOM
-
2026-05-31days on market $280,000 Active 82 DOM
-
2026-04-27price $280,000 541-char remark
Show marketing remark (541 chars)
This fully renovated 4-plex is an investor’s goldmine. Here’s what makes this property special: All 4 units are rented out. Each units features 2-bedroom, 1-bath with open floor plans. Complete renovations: new HVAC, electrical, plumbing, flooring, updated kitchens, bathrooms, and 4-year-old shingle roof. Each unit comes fully equipped: washer, dryer, stove, refrigerator. This is turnkey income production at its finest with maximum cash flow potential. All units are currently rented with a total monthly income of $3,100.
-
2026-03-26price $290,000 541-char remark
Show marketing remark (541 chars)
This fully renovated 4-plex is an investor’s goldmine. Here’s what makes this property special: All 4 units are rented out. Each units features 2-bedroom, 1-bath with open floor plans. Complete renovations: new HVAC, electrical, plumbing, flooring, updated kitchens, bathrooms, and 4-year-old shingle roof. Each unit comes fully equipped: washer, dryer, stove, refrigerator. This is turnkey income production at its finest with maximum cash flow potential. All units are currently rented with a total monthly income of $3,100.
-
2026-03-09$300,000 Active 541-char remark
Show marketing remark (541 chars)
This fully renovated 4-plex is an investor’s goldmine. Here’s what makes this property special: All 4 units are rented out. Each units features 2-bedroom, 1-bath with open floor plans. Complete renovations: new HVAC, electrical, plumbing, flooring, updated kitchens, bathrooms, and 4-year-old shingle roof. Each unit comes fully equipped: washer, dryer, stove, refrigerator. This is turnkey income production at its finest with maximum cash flow potential. All units are currently rented with a total monthly income of $3,100.
-
2022-06-23soldstatus $75,000 217-char remark
Show marketing remark (217 chars)
INVESTMENT OPPORTUNITY. This property is 1 of 37 properties that can be purchased individually or as a package. It is sold "AS IS WHERE AS". All information and property facts to be verified by Purchaser.
-
2022-06-23soldstatus $75,000
Show marketing remark (217 chars)
INVESTMENT OPPORTUNITY. This property is 1 of 37 properties that can be purchased individually or as a package. It is sold "AS IS WHERE AS". All information and property facts to be verified by Purchaser.
-
2022-04-02$75,000 217-char remark
Show marketing remark (217 chars)
INVESTMENT OPPORTUNITY. This property is 1 of 37 properties that can be purchased individually or as a package. It is sold "AS IS WHERE AS". All information and property facts to be verified by Purchaser.
ⓘ Source: listings_history table (triggers on properties + properties_extension) + one-shot
backfill from property_details.listing_events for pre-trigger history.
Climate risk First Street
- Flood 1/10 Low FEMA zone X (unshaded) · 0% chance over 30 yrs
- Wildfire 4/10 Moderate
- Heat 6/10 Major 7 d/yr ≥108°F today · 20 d/yr by 30 yrs out
- Wind 6/10 Major 27% chance of damaging wind over 30 yrs
- Air quality 2/10 Low 0 unhealthy d/yr today · 1 by 30 yrs out
Nearby sold comps map
Loading sold comps map…
Walkable amenities ~0.75 mi
Loading nearby amenities…
Taxation est. · year 1
- Rental income
- $37,056
- − Mortgage interest
- −$15,684
- − Property taxes
- −$4,200
- − Insurance
- −$1,400
- − Repairs & maintenance
- −$2,964
- − Management
- −$2,964
- − Depreciation
- −$8,145
- Taxable income
- $1,697
- Est. tax owed @ 24.0%
- −$407
- After-tax cash flow
- $5,647/yr
For passive investors: Depreciation is non-cash, so a rental often shows a tax loss while cash-flowing — sheltering income. Rental losses are passive: they offset passive income freely, and up to $25,000/yr can offset ordinary (W-2) income if you actively participate and your MAGI is under $100k (phasing out to $0 by $150k); unused losses carry forward. On sale, claimed depreciation is recaptured at up to 25%, and gains may owe capital-gains tax (a 1031 exchange can defer both). Figures are a year-1 estimate at your 24.0% rate — not tax advice; consult a CPA.
Schools (NCES district)
- District
- Marion County
- NCES district ID
- 0102310
- Math proficiency
- 20% ▼ -29.00%
- Reading proficiency
- 48% ▬ 0.00%
- Median HH income
- $32,048
- Composite
- 27.69/100
- National rank
- #6911
- State rank
- #56 of 129 in AL
Livability — Hamilton
- Score
- 63/100
- State rank
- #190
- US rank
- #15568
Category grades
Schools grade is shown separately in the Schools card above.
Census & demographics
- Census place
- Hamilton, AL
- City population
- 10,621
- Population (ZIP)
- 10,621
Population outlook (Marion County) Hauer SSP2
- Today (2025)
- 28,759 people
- By 2030
- 27,834 · -3.2%
- By 2040
- 25,974 · -9.7%
- By 2050
- 24,129 · -16.1%
- By 2075
- 20,179 · -29.8%
- By 2100
- 16,341 · -43.2%
Race, ethnicity, and origin ACS 2023
- Neighborhood character
- Predominantly White (88%)
- Race & ethnicity
- White 88% Two or more races 6% Black 5% Hispanic / Latino 2%
- Common ancestry
- Italian 2% Slovak 1% Serbian 1%
- Foreign-born
- 0% · Canada
- Languages at home
- 99% English-only · Spanish 1%
Political lean MEDSL · Marion
- 2024 margin
- Solid R (+81.7) · D 8.8% · R 90.5%
- 2008→2024 swing
- -25.6pp toward R · 2008: -56.1pp · 2024: -81.7pp
- All cycles
- 2024: R+81.7 2020: R+77.8 2016: R+76.2 2012: R+61.5 2008: R+56.1
Not yet ingested
- Civics
- —
Market trends
- HPI YoY
- ▼ -13.98%
- Current HPI
- 166.1943
- Rent YoY
- —
- Metro
- —
- State GDP YoY
- ▲ 2.94%
- F500 in state
- 4
Industry mix (Fortune 500 HQ in AL)
| Industry | F500 HQs | Revenue |
|---|---|---|
| Financial Services | 1 | $8B |
|
||
| Healthcare | 1 | $5B |
|
||
Price history
+273.3% since first listed6 events — show timeline
- 2026-04-27 Price Changed $280,000 VMLS
- 2026-03-26 Price Changed $290,000 VMLS
- 2026-03-09 Listed $300,000 VMLS
- 2022-06-23 Sold (Public Records) $75,000 Public Records
- 2022-06-23 Sold (MLS) $75,000 VMLS
- 2022-04-02 Listed $75,000 VMLS
Property tax history
+3.2%/yrLatest (2025): $477 · +4.7% YoY. Source: county tax records.
Cash-flow waterfall
monthlySold comps — $/sqft
last 12 mo · ≤1 miLoading sold comps…