 🏷️ Likely Rental
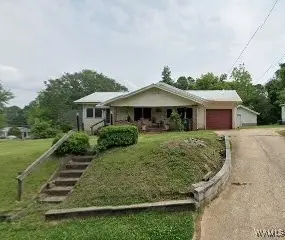
121 10th St NW · Fayette, AL
Flood risk 1/10 · Minimal
- FEMA flood zone
- X (unshaded)
- Chance of flooding over 30 yrs
- 0.0%
- Est. flood insurance / yr
- $507 – $1,088
Fire risk 3/10 · Minor
- Est. fire insurance / yr
- $916 – $1,700
Heat risk 6/10 · Moderate
- Hot days now (above 108°F)
- 7 days/yr
- Hot days in 30 yrs
- 20 days/yr
Wind risk 6/10 · Moderate
- Chance of severe wind over 30 yrs
- 27.0%
Air-quality risk 2/10 · Minimal
- Unhealthy air days now
- 1 days/yr
- Unhealthy air days in 30 yrs
- 2 days/yr
Risk factors via First Street. Map © Google.
Why this score? — see what drove the B- grade
The composite is a weighted blend of 9 inputs, each scored 0–100. Each bar is that input's sub-score; the figure is the points it added to the 100-point composite (weight × sub-score).
- Cash flow +30.0/30.0
- 1% rule +10.0/10.0
- DSCR +10.0/10.0
- ARV discount +7.5/15.0
- Livability +3.2/5.0
- Rent growth +2.5/5.0
- Schools +2.5/10.0
- Condition / age +2.5/5.0
- Appreciation +0.0/10.0
$64,900
🖨 Deal sheet 📄 Offer letter ✓ Due diligence
Listing remarks
Investment Opportunity – Income-Producing Property with Tenant in Place. This 3-bedroom, 1-bath home offers a spacious layout including a living room, dining room, and kitchen, plus a covered front porch and an attached 1-car garage. With fresh paint and a touch of TLC, this property has the potential to truly shine. Currently tenant-occupied, with the renter expressing interest in staying if the buyer agrees—making this a seamless transition for investors. The property may be purchased individually or bundled with the neighboring home, which also has a long-term tenant who wishes to remain. Whether you're looking to expand your portfolio or take the first step into real estate
Key facts
- Covered front porch
- Attached garage
- Spacious layout
Tags
Property features AI
Exterior
- Parking: Attached garage (1 car); Concrete driveway
- Utilities: Sewer connected
- Home design: Single-family residence; One level
- Construction: Frame construction; Metal roof; Crawl space foundation; Built as residential single-family
- Exterior features: Covered porch; Level lot; Paved road access
Interior
- Kitchen: Water heater included
- Bathrooms: One full bathroom
- Heating & cooling: Central heating; Central air conditioning
- Interior features: See remarks; No fireplace
- Laundry & utility: Laundry on main level
Neighborhood map
What this means for you Summary
Snapshot
- This is a 3-bed/1.0-bath single-family listed at $65k.
Deal economics
- At list price, monthly cash flow is $596 ($7k/yr) — positive.
- The deal already cash-flows at list — no discount required.
- Meets the 1% rule at list price ($1k rent vs $65k).
- Recommended offer: $57k (12.0% below list) — sets the bar for market timing.
- Cap rate 17.3% vs local median 6.0% in Fayette — top-decile yield for the area; either an underpriced asset or a hidden risk that comps aren't pricing in. Stress-test before assuming the spread holds.
Location & tenants
- Location reads 64/100 on livability (#158 in AL) — a middle-class / working-renter tenant base. Strengths: cost of living A+, housing A+, crime A-; Watch: health & safety D, amenities F, commute F.
- Fayette County (rural): math 17% / reading 44% proficiency, ranked #71 of 129 in AL (top 55%) — families likely to look elsewhere, expect single-tenant / working-renter base with shorter leases.
- Zoned schools: Fayette Elementary School (math 17% / reading 47%, grade F, #331 of 627 statewide, top 57%, 466 students, 75% FRL); Fayette Middle School (math 14% / reading 41%, grade F, #144 of 257 statewide, top 57%, 341 students, 76% FRL); Fayette County High School (math 27% / reading 27%, grade F, #90 of 305 statewide, top 35%, 387 students, 64% FRL) — zoned schools average 72% FRL vs 50% district-wide (22 pts higher); higher-poverty schools than district average — tighter screening recommended.
- Market conditions: 61 active listings in the ZIP.
Forward outlook
- Local home prices are declining (-3.0%/yr); year-one equity from $449 of loan paydown is wiped out by about $2k of value loss. Plan a longer hold.
- Fayette County population projected at -21% by 2050 — secular population decline; favor cash flow + early exit over multi-decade hold.
- At projected returns (-3.0% appreciation + 3.0% rent growth), your $18k cash investment doubles in ~3 years — after that, you're playing with house money.
Negotiation context
- It's been on market 210 days — a 12% lower offer ($57k) is reasonable based on typical stale-listing flexibility.
- 2 sale attempts; this cycle's ask has dropped $5k (7%) from the opening price — seller is motivated, your offer sets the floor, not the list.
Risks & watch-outs
- Watch-outs: built in 1947 — expect roof / HVAC / electrical / plumbing capex.
- Climate carrying-cost: major wind risk, 27% chance of damaging wind over 30y; extreme-heat days projected 7→20/yr by 2055 (HVAC capex compounding) — expect insurance premiums to compound above CPI over the hold.
Questions for the listing agent
- It's been on market 210 days. Have you received any prior offers? Is the seller open to a 12% concession, seller financing, or rate buy-down credit?
- Built in 1947 — when were the roof, HVAC, electrical panel, plumbing, and water heater last replaced?
- Why hasn't it sold? Are there any deal-killer items the seller is aware of (foundation, flood, title, zoning, code violations)?
- Is there a deadline driving the sale (1031 exchange, divorce, estate, relocation)? That informs how much negotiation room exists.
- Schools are D-rated, which usually means shorter tenancies and higher turnover. Who's the typical renter profile here, and what's been the actual vacancy rate?
- What's the average days-on-market for RENTAL listings here right now (not sales)? A rising rental-DOM trend means longer vacancies and softer asking-rent achievability than the comps imply.
- What's the recent tenant-quality profile in this submarket — average credit score on applications, eviction rate, late-payment / NSF rate, and stable-employment percentage? A property-management company in the area should have these aggregated.
- How much new for-sale + rental construction is in the pipeline within 1–3 miles? Heavy new supply typically softens prices + rents 12–24 months out; constrained supply supports both.
Investment metrics
- 1% rule
- 1.93% ✓
- Cap rate
- 17.31%
- Cash-on-cash
- 39.34%
- DSCR
- 2.75
- GRM
- 4.3
CMA / ARV
- ARV (on-the-fly)
- $131,840
- Comps found
- 6
Show comp detail 6 sales within ~0.75 mi
| Address | Dist | Beds/Ba | Sqft | Sold | Price | $/sf | Match |
|---|---|---|---|---|---|---|---|
| 202 NW 3rd St | 0.60mi | 2/1.0 (-1) | 1,272 (-1%) | 7mo | $119,000 | $94 | 61 |
| 332 5th St NE | 0.50mi | 2/2.0 (-1) | 1,280 (0%) | 11mo | $132,000 | $103 | 59 |
| 522 NE 6th St | 0.50mi | 3/1.0 | 1,450 (+13%) | 5mo | $100,000 | $69 | 51 |
| 932 3rd Ave NE | 0.25mi | 2/2.0 (-1) | 1,128 (-12%) | 18mo | $10,000 | $9 | 44 |
| 329 NW 14th St | 0.63mi | 3/1.0 | 1,125 (-12%) | 17mo | $122,900 | $109 | 36 |
| 342 NE 5th St | 0.51mi | 3/1.0 | 1,092 (-15%) | 21mo | $138,900 | $127 | 34 |
Match score weights: distance 35% · size 25% · config 20% · recency 20%. Top-matched comps best support the ARV.
Projected returns pro-forma
-3.0% appreciation · 3.0% rent growth · sell at horizon
- IRR
- 35.6%
- Equity multiple
- 2.51×
- Total profit
- $27,417
- Equity at exit
- $9,677
- IRR
- 42.3%
- Equity multiple
- 5.00×
- Total profit
- $72,683
- Equity at exit
- $5,611
Cash invested: $18,172 (down + closing). Projections, not guarantees.
Landlord ↔ Tenant lean methodology
- Overall (STATE)
- 90 Strongly Landlord-Friendly
- State Alabama
- 90 Strongly Landlord-Friendly · R+15
- County
- — inherits STATE
- City
- — inherits STATE
ZIP-level market 35555
- Home prices YoY
- -18.1%
- Active inventory
- 61
- Price-to-rent
- 4.3×
Monthly cashflow live
- Estimated rent
- $1,256 medium interval (Pro) →
- Mortgage (P&I)
- −$340
- Tax from tax record
- −$29 /mo · $345/yr
- Insurance
- −$27
- HOA
- −$0
- Vacancy / Maint / Mgmt
- −$264
- Net cashflow
- $596
Break-even live
UW: 25.0% down · 7.5% · 30yr · 1.5% tax · 5.0% vac · 8.0% maint · 8.0% mgmt
Financing live
Cash to close
- Down payment
- $16,225
- Closing costs
- $1,947
- Reserves months
- —
- Total cash needed
- —
Loan-product check · same deal, 3 products live
Conventional
25% down · 7.5% · 30yr
- Down + closing
- —
- Monthly P&I
- —
- Monthly cashflow
- —
- DSCR
- —
- Eligible?
- —
Personal DTI + credit; lowest rate.
DSCR
20% down · 8.5% · 30yr
- Down + closing
- —
- Monthly P&I
- —
- Monthly cashflow
- —
- DSCR
- —
- Eligible?
- —
No personal income docs; deal must DSCR.
Hard money
10% down · 12.0% · 12mo
- Down + closing
- —
- Monthly P&I
- —
- Monthly cashflow
- —
- DSCR
- —
- Eligible?
- —
Short-term bridge; refi at stabilization.
Listing history 19 events
-
2026-06-19days on market $64,900 Active 210 DOM
-
2026-06-18days on market $64,900 Active 209 DOM
-
2026-06-17days on market $64,900 Active 208 DOM
-
2026-06-16days on market $64,900 Active 207 DOM
-
2026-06-15days on market $64,900 Active 206 DOM
-
2026-06-14days on market $64,900 Active 204 DOM
-
2026-06-12days on market $64,900 Active 203 DOM
-
2026-06-09days on market $64,900 Active 200 DOM
-
2026-06-08days on market $64,900 Active 199 DOM
-
2026-06-07days on market $64,900 Active 198 DOM
-
2026-06-07days on market $64,900 Active 197 DOM
-
2026-06-04days on market $64,900 Active 194 DOM
-
2026-06-02days on market $64,900 Active 193 DOM
-
2026-06-01days on market $64,900 Active 192 DOM
-
2026-05-31days on market $64,900 Active 191 DOM
-
2026-05-31days on market $64,900 Active 190 DOM
-
2026-05-22price $64,900
-
2026-05-22status Active
-
2025-10-01$69,900 Active
ⓘ Source: listings_history table (triggers on properties + properties_extension) + one-shot
backfill from property_details.listing_events for pre-trigger history.
Tax reassessment forecast AL · Resets to sale price
- Current annual tax
- $345 · $29/mo
- Projected year-2 tax
- $345 · $29/mo
- Expected delta
- $0/yr ($0/mo · 0.0%)
ⓘ Screening estimate from a state-policy table — verify with the county assessor before closing.
Climate risk First Street
- Flood 1/10 Low FEMA zone X (unshaded) · 0% chance over 30 yrs
- Wildfire 3/10 Moderate
- Heat 6/10 Major 7 d/yr ≥108°F today · 20 d/yr by 30 yrs out
- Wind 6/10 Major 27% chance of damaging wind over 30 yrs
- Air quality 2/10 Low 1 unhealthy d/yr today · 2 by 30 yrs out
Nearby sold comps map
Loading sold comps map…
Walkable amenities ~0.75 mi
Loading nearby amenities…
Taxation est. · year 1
- Rental income
- $15,068
- − Mortgage interest
- −$3,635
- − Property taxes
- −$345
- − Insurance
- −$324
- − Repairs & maintenance
- −$1,205
- − Management
- −$1,205
- − Depreciation
- −$1,888
- Taxable income
- $6,464
- Est. tax owed @ 24.0%
- −$1,551
- After-tax cash flow
- $5,598/yr
For passive investors: Depreciation is non-cash, so a rental often shows a tax loss while cash-flowing — sheltering income. Rental losses are passive: they offset passive income freely, and up to $25,000/yr can offset ordinary (W-2) income if you actively participate and your MAGI is under $100k (phasing out to $0 by $150k); unused losses carry forward. On sale, claimed depreciation is recaptured at up to 25%, and gains may owe capital-gains tax (a 1031 exchange can defer both). Figures are a year-1 estimate at your 24.0% rate — not tax advice; consult a CPA.
Schools (NCES district)
- District
- Fayette County
- NCES district ID
- 0101470
- Math proficiency
- 17% ▼ -25.00%
- Reading proficiency
- 44% ▼ -1.00%
- Median HH income
- $34,767
- Composite
- 25.06/100
- National rank
- #7540
- State rank
- #71 of 129 in AL
Livability — Fayette
- Score
- 64/100
- State rank
- #158
- US rank
- #14298
Category grades
Schools grade is shown separately in the Schools card above.
Census & demographics
- Census place
- Fayette, AL
- Population (ZIP)
- 9,689
Population outlook (Fayette County) Hauer SSP2
- Today (2025)
- 15,631 people
- By 2030
- 14,975 · -4.2%
- By 2040
- 13,604 · -13.0%
- By 2050
- 12,302 · -21.3%
- By 2075
- 9,599 · -38.6%
- By 2100
- 7,282 · -53.4%
Race, ethnicity, and origin ACS 2023
- Neighborhood character
- Predominantly White (78%)
- Race & ethnicity
- White 78% Black 19% Two or more races 3%
- Common ancestry
- Slovak 1% Italian 1% Lithuanian 1%
- Foreign-born
- 1% · Canada
Political lean MEDSL · Fayette
- 2024 margin
- Solid R (+72.0) · D 13.7% · R 85.7%
- 2008→2024 swing
- -23.1pp toward R · 2008: -48.9pp · 2024: -72.0pp
- All cycles
- 2024: R+72.0 2020: R+67.4 2016: R+65.2 2012: R+53.5 2008: R+48.9
Not yet ingested
- Civics
- —
Market trends
- HPI YoY
- ▼ -42.04%
- Current HPI
- 190.5031
- Rent YoY
- —
- Metro
- —
- State GDP YoY
- ▲ 2.94%
- F500 in state
- 4
Industry mix (Fortune 500 HQ in AL)
| Industry | F500 HQs | Revenue |
|---|---|---|
| Financial Services | 1 | $8B |
|
||
| Healthcare | 1 | $5B |
|
||
Price history
-7.2% since first listed3 events — show timeline
- 2026-05-22 Price Changed $64,900 WAMLS
- 2026-05-22 Relisted — WAMLS
- 2025-10-01 Listed $69,900 WAMLS
Property tax history
+5.4%/yrLatest (2025): $345 · +0.0% YoY. Source: county tax records.
Cash-flow waterfall
monthlySold comps — $/sqft
last 12 mo · ≤1 miLoading sold comps…