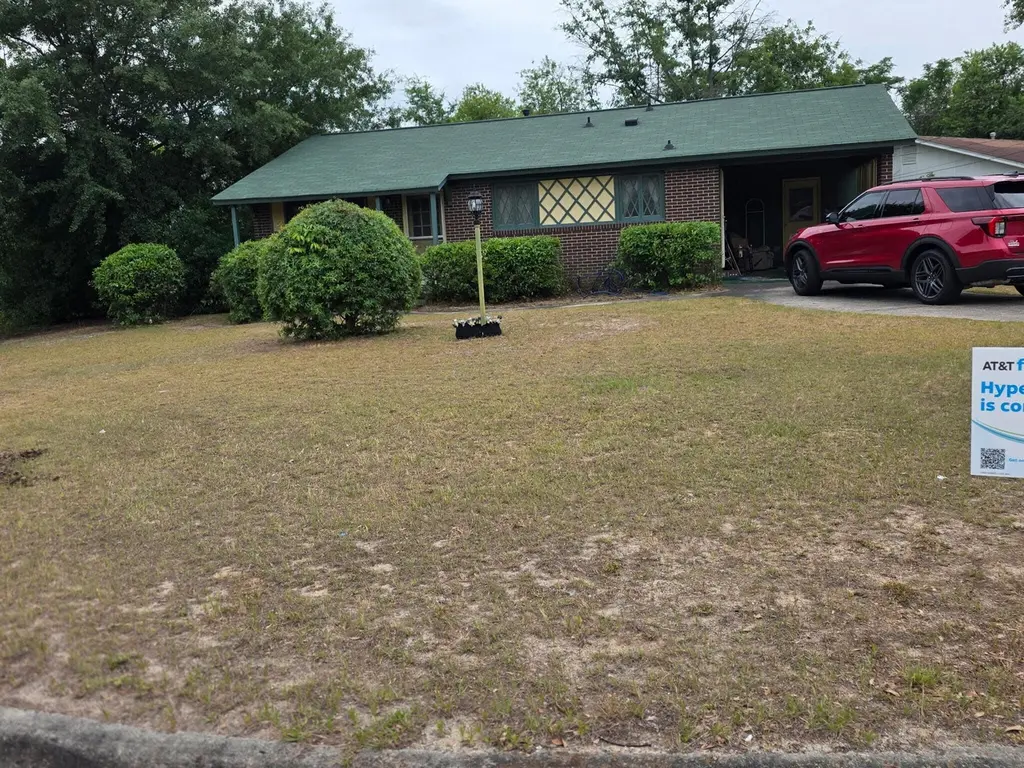
3000 Claudia Dr · Augusta-Richmond County consolidated government (balance), GA
Flood risk 1/10 · Minimal
- FEMA flood zone
- X (unshaded)
- Chance of flooding over 30 yrs
- 0.0%
- Est. flood insurance / yr
- $507 – $1,088
Fire risk 1/10 · Minimal
- Est. fire insurance / yr
- $963 – $1,789
Heat risk 7/10 · Major
- Hot days now (above 107°F)
- 7 days/yr
- Hot days in 30 yrs
- 17 days/yr
Wind risk 6/10 · Moderate
- Chance of severe wind over 30 yrs
- 66.0%
Air-quality risk 3/10 · Minor
- Unhealthy air days now
- 3 days/yr
- Unhealthy air days in 30 yrs
- 3 days/yr
Risk factors via First Street. Map © Google.
Why this score? — see what drove the B grade
The composite is a weighted blend of 9 inputs, each scored 0–100. Each bar is that input's sub-score; the figure is the points it added to the 100-point composite (weight × sub-score).
- Cash flow +30.0/30.0
- ARV discount +15.0/15.0
- 1% rule +10.0/10.0
- DSCR +10.0/10.0
- Livability +2.5/5.0
- Condition / age +2.5/5.0
- Rent growth +2.4/5.0
- Schools +1.3/10.0
- Appreciation +0.0/10.0
$80,000
🖨 Deal sheet (PDF) 📄 Offer letter ✓ Due diligence
Listing remarks
SOLD AS IS
Key facts
- 0.26 acre lot
- Garage
- Built 1963
Neighborhood map
What this means for you Summary
Snapshot
- This is a 3-bed/1.5-bath single-family listed at $80k.
Deal economics
- At list price, monthly cash flow is $384 ($5k/yr) — positive.
- The deal already cash-flows at list — no discount required.
- Meets the 1% rule at list price ($1k rent vs $80k).
- Cap rate 12.0% vs local median 5.3% in Augusta-Richmond County consolidated government (balance) — top-decile yield for the area; either an underpriced asset or a hidden risk that comps aren't pricing in. Stress-test before assuming the spread holds.
Location & tenants
- Location reads: area grade B — affects rentability + tenant quality, not the cash-flow math above.
- Richmond County (urban): math 12% / reading 20% proficiency, ranked #154 of 174 in GA (top 88%) — low school quality limits family demand, transient renter base, plan for 1-2y turnover; 72% free/reduced lunch — lower-income household profile, screen leases tightly.
- Zoned schools: Glenn Hills Elementary School (math 2% / reading 8%, grade F, #1,160 of 1,228 statewide, top 98%, 393 students, 98% FRL); Glenn Hills Middle School (math 2% / reading 6%, grade F, #467 of 470 statewide, top 99%, 762 students, 98% FRL); Glenn Hills High School (math 2% / reading 2%, grade F, #421 of 424 statewide, top 100%, 883 students, 98% FRL) — zoned schools average 98% FRL vs 72% district-wide (26 pts higher); higher-poverty schools than district average — tighter screening recommended.
- Zoned-school proficiency averages 4% at this address vs 16% district-wide (-12 pts) — the specific schools serving this property underperform the Richmond County average; the district grade overstates school quality for this exact location.
- Market conditions: Rents soft (-0.2%/yr); 367 active listings in the ZIP; 22 comparable units currently listed for rent nearby; rentals at typical pace (median 25d on market — plan ~3-4 weeks tenant-placement turnaround); 45% of comp listings sitting > 30 days — soft ceiling on asking rent; 561 units permitted in Richmond County in 2024 (0 in 5+ unit buildings).
- This rent runs 32% of the median local income ($46k/yr) — at the standard rent-burdened threshold; future hikes will face affordability resistance.
Forward outlook
- Local home prices are declining (-3.0%/yr); year-one equity from $553 of loan paydown is wiped out by about $2k of value loss. Plan a longer hold.
- Richmond County population projected to shrink 5% by 2050 — rents likely to lag national; underwrite the cash flow, not the appreciation.
- At projected returns (-3.0% appreciation + 0.0% rent growth), your $22k cash investment doubles in ~8 years — after that, you're playing with house money.
Negotiation context
- Only 12 days on market — expect competitive offers; lowballing is unlikely to land.
- 2 sale attempts with the ask held roughly flat each time — persistent listings suggest the price (not the market) is what's stuck; bring a comps-based counter.
Risks & watch-outs
- Climate carrying-cost: major wind risk, 66% chance of damaging wind over 30y; extreme-heat days projected 7→17/yr by 2055 (HVAC capex compounding) — expect insurance premiums to compound above CPI over the hold.
Questions for the listing agent
- Built in 1963 — when were the roof, HVAC, electrical panel, plumbing, and water heater last replaced?
- Is there a deadline driving the sale (1031 exchange, divorce, estate, relocation)? That informs how much negotiation room exists.
- What's the average days-on-market for RENTAL listings here right now (not sales)? A rising rental-DOM trend means longer vacancies and softer asking-rent achievability than the comps imply.
- What's the recent tenant-quality profile in this submarket — average credit score on applications, eviction rate, late-payment / NSF rate, and stable-employment percentage? A property-management company in the area should have these aggregated.
- How much new for-sale + rental construction is in the pipeline within 1–3 miles? Heavy new supply typically softens prices + rents 12–24 months out; constrained supply supports both.
Investment metrics
- 1% rule
- 1.51% ✓
- Cap rate
- 12.05%
- Cash-on-cash
- 20.55%
- DSCR
- 1.91
- GRM
- 5.5
CMA / ARV
- ARV (median comp)
- $99,670
- List price
- $80,000
- Delta
- -19.74%
- Verdict
- UNDERPRICED
- Comps
- 20 within 1.0 mi
Show comp detail 10 sales within ~0.75 mi
| Address | Dist | Beds/Ba | Sqft | Sold | Price | $/sf | Match |
|---|---|---|---|---|---|---|---|
| 3000 Claudia Dr | 0.00mi | 3/1.5 | 1,008 (0%) | 1mo | $80,000 | $79 | 99 |
| 2704 Deen Ave | 0.05mi | 3/1.0 | 975 (-3%) | 1mo | $100,000 | $103 | 90 |
| 2706 Deen Ave | 0.06mi | 3/1.5 | 988 (-2%) | 16mo | $95,000 | $96 | 80 |
| 3042 Acorn Rd | 0.49mi | 3/1.0 | 1,040 (+3%) | 4mo | $136,000 | $131 | 66 |
| 2508 South St | 0.10mi | 3/1.0 | 1,131 (+12%) | 15mo | $75,000 | $66 | 61 |
| 2506 South St | 0.11mi | 3/1.0 | 1,131 (+12%) | 17mo | $60,000 | $53 | 58 |
| 2355 Golden Camp Rd | 0.60mi | 4/1.5 (+1) | 1,080 (+7%) | 5mo | $128,000 | $119 | 51 |
| 3103 Fir Ct | 0.58mi | 3/1.5 | 1,122 (+11%) | 5mo | $82,500 | $74 | 50 |
| 3004 Acorn Rd | 0.57mi | 3/2.0 | 1,138 (+13%) | 2mo | $155,000 | $136 | 48 |
| 2511 Lumpkin Rd | 0.75mi | 3/1.0 | 1,026 (+2%) | 19mo | $125,000 | $122 | 44 |
Match score weights: distance 35% · size 25% · config 20% · recency 20%. Top-matched comps best support the ARV.
Projected returns pro-forma
-3.0% appreciation · 0.0% rent growth · sell at horizon
- IRR
- 9.4%
- Equity multiple
- 1.36×
- Total profit
- $7,952
- Equity at exit
- $11,928
- IRR
- 15.8%
- Equity multiple
- 2.11×
- Total profit
- $24,796
- Equity at exit
- $6,917
Cash invested: $22,400 (down + closing). Projections, not guarantees.
Landlord ↔ Tenant lean methodology
- Overall (STATE)
- 90 Strongly Landlord-Friendly
- State Georgia
- 90 Strongly Landlord-Friendly · R+3
- County
- — inherits STATE
- City
- — inherits STATE
ZIP-level market 30906
- Home prices YoY
- -21.6%
- Rents YoY
- -0.2%
- Active inventory
- 367
- Price-to-rent
- 5.5×
Monthly cashflow live
- Estimated rent
- $1,211 high interval (Pro) →
- Mortgage (P&I)
- −$420
- Tax from tax record
- −$120 /mo · $1,443/yr
- Insurance
- −$33
- HOA
- −$0
- Vacancy / Maint / Mgmt
- −$254
- Net cashflow
- $384
Break-even live
Sensitivity live
| Price | -10% $429 | -5% $406 | +0% $384 | +5% $361 | +10% $338 |
|---|---|---|---|---|---|
| Rent | -10% $288 | -5% $336 | +0% $384 | +5% $431 | +10% $479 |
| Rate | -1.0pp $424 | -0.5pp $404 | base $384 | +0.5pp $363 | +1.0pp $342 |
UW: 25.0% down · 7.5% · 30yr · 1.5% tax · 5.0% vac · 8.0% maint · 8.0% mgmt
Financing live
Cash to close
- Down payment
- $20,000
- Closing costs
- $2,400
- Reserves months
- —
- Total cash needed
- —
Loan-product check · same deal, 3 products live
Conventional
25% down · 7.5% · 30yr
- Down + closing
- —
- Monthly P&I
- —
- Monthly cashflow
- —
- DSCR
- —
- Eligible?
- —
Personal DTI + credit; lowest rate.
DSCR
20% down · 8.5% · 30yr
- Down + closing
- —
- Monthly P&I
- —
- Monthly cashflow
- —
- DSCR
- —
- Eligible?
- —
No personal income docs; deal must DSCR.
Hard money
10% down · 12.0% · 12mo
- Down + closing
- —
- Monthly P&I
- —
- Monthly cashflow
- —
- DSCR
- —
- Eligible?
- —
Short-term bridge; refi at stabilization.
Rent comps 22 comps
| Address | Beds | Baths | Sqft | Rent | $/sqft | DOM | Units | Dist |
|---|---|---|---|---|---|---|---|---|
| 2830 Lumpkin Rd Unit A Augusta, GA | 3.0 | 1.5 | 1000 | $900 | $0.90 | 24d | 1 | 0.48mi |
| 3126 Arcadia Dr Unit B Augusta, GA | 2.0 | 1.0 | 748 | $895 | $1.20 | 24d | 1 | 0.63mi |
| 3126 Arcadia Dr Unit B Augusta, GA | 2.0 | 1.0 | 748 | $1,025 | $1.37 | 45d | 1 | 0.63mi |
| 2544 Dover St Unit 2544 Augusta, GA | 3.0 | 1.0 | 888 | $900 | $1.01 | 45d | 1 | 0.64mi |
| 3018 Acorn Rd Augusta, GA | 2.0 | 1.0 | 962 | $1,115 | $1.16 | 24d | 1 | 0.66mi |
| 3012 Pinewood Dr Augusta, GA | 3.0 | 2.0 | 1465 | $1,100 | $0.75 | 45d | 1 | 0.83mi |
| 2438 Lumpkin Rd Augusta, GA | 3.0 | 1.0 | 864 | $1,500 | $1.74 | 24d | 1 | 0.97mi |
| 2851 Rocky Creek Rd Augusta, GA | 2.0 | 1.0 | 1171 | $1,100 | $0.94 | 45d | 1 | 1.03mi |
| 2851 Rocky Creek Rd Augusta, GA | 2.0 | 1.0 | 1171 | $1,100 | $0.94 | 24d | 1 | 1.03mi |
| 3412 Kensington Dr N Augusta, GA | 3.0 | 2.0 | 1225 | $1,350 | $1.10 | 24d | 1 | 1.03mi |
| 2826 Thomas Ln Augusta, GA | 2.0 | 1.0 | 1456 | $1,095 | $0.75 | 45d | 1 | 1.13mi |
| 2826 Thomas Ln Augusta, GA | 2.0 | 1.0 | 1456 | $1,095 | $0.75 | 24d | 1 | 1.13mi |
| 2824 Thomas Ln Augusta, GA | 2.0 | 2.0 | 960 | $950 | $0.99 | 45d | 1 | 1.15mi |
| 2818 Gordy Rd Augusta, GA | 2.0 | 1.0 | 888 | $825 | $0.93 | 45d | 1 | 1.16mi |
| 2820 Thomas Ln Augusta, GA | 2.0 | 2.0 | 960 | $950 | $0.99 | 45d | 1 | 1.19mi |
| 2816 Thomas Ln Augusta, GA | 2.0 | 2.0 | 960 | $950 | $0.99 | 15d | 1 | 1.22mi |
| 2663 Thomas Ln Augusta, GA | 2.0–3.0 | 2.0–2.5 | 1250 | $1,446 | $1.16 | 24d | 3 | 1.24mi |
| 3200 Deans Bridge Rd Augusta, GA | 1.0–4.0 | 1.0–1.5 | 1075 | $970 | $0.90 | 24d | 6 | 1.25mi |
| 2810 Thomas Ln Augusta, GA | 2.0 | 2.0 | 1030 | $975 | $0.95 | 45d | 6 | 1.28mi |
| 2941 Rollingwood Dr Augusta, GA | 3.0 | 2.0 | 1297 | $1,750 | $1.35 | 24d | 1 | 1.36mi |
| 2605 Shalimar Dr Augusta, GA | 4.0 | 2.0 | 1444 | $1,500 | $1.04 | 22d | 1 | 1.37mi |
| 2708 Blossom Dr Unit B Augusta, GA | 2.0 | 1.5 | 896 | $950 | $1.06 | 45d | 1 | 1.48mi |
Listing history 5 events
-
2026-05-11historical
-
2026-05-01$80,000 Active
-
2026-05-01$80,000 Active 10-char remark
-
2019-12-04soldstatus $73,800
-
1978-12-01soldstatus $25,500
ⓘ Source: listings_history table (triggers on properties + properties_extension) + one-shot
backfill from property_details.listing_events for pre-trigger history.
Tax reassessment forecast GA · Resets to sale price
- Current annual tax
- $1,443 · $120/mo
- Projected year-2 tax
- $1,443 · $120/mo
- Expected delta
- $0/yr ($0/mo · 0.0%)
ⓘ Screening estimate from a state-policy table — verify with the county assessor before closing.
Climate risk First Street
- Flood 1/10 Low FEMA zone X (unshaded) · 0% chance over 30 yrs
- Wildfire 1/10 Low
- Heat 7/10 Severe 7 d/yr ≥107°F today · 17 d/yr by 30 yrs out
- Wind 6/10 Major 66% chance of damaging wind over 30 yrs
- Air quality 3/10 Moderate 3 unhealthy d/yr today · 3 by 30 yrs out
Nearby sold comps map
Loading sold comps map…
Walkable amenities ~0.75 mi
Loading nearby amenities…
Taxation est. · year 1
- Rental income
- $14,533
- − Mortgage interest
- −$4,481
- − Property taxes
- −$1,443
- − Insurance
- −$400
- − Repairs & maintenance
- −$1,163
- − Management
- −$1,163
- − Depreciation
- −$2,327
- Taxable income
- $3,556
- Est. tax owed @ 24.0%
- −$853
- After-tax cash flow
- $3,750/yr
For passive investors: Depreciation is non-cash, so a rental often shows a tax loss while cash-flowing — sheltering income. Rental losses are passive: they offset passive income freely, and up to $25,000/yr can offset ordinary (W-2) income if you actively participate and your MAGI is under $100k (phasing out to $0 by $150k); unused losses carry forward. On sale, claimed depreciation is recaptured at up to 25%, and gains may owe capital-gains tax (a 1031 exchange can defer both). Figures are a year-1 estimate at your 24.0% rate — not tax advice; consult a CPA.
Schools (NCES district)
- District
- Richmond County
- NCES district ID
- 1304380
- Math proficiency
- 12% ▼ -9.00%
- Reading proficiency
- 20% ▼ -6.00%
- Median HH income
- $38,069
- Composite
- 13.43/100
- National rank
- #9524
- State rank
- #154 of 174 in GA
Livability — Augusta-Richmond County consolidated government (balance)
No livability data for this city. (Only ~50 U.S. cities are tracked.)
Census & demographics
- Census place
- Augusta-Richmond County consolidated government (balance), GA
- County
- Richmond County · 190,917 people
- City population
- 154,035
- Metro
- Augusta-Richmond County, GA-SC
- Population (ZIP)
- 60,423
- Household income
- $45,999
- Rent vs Own
- Severe rent burden
- 3363.0
Population outlook (Richmond County) Hauer SSP2
- Today (2025)
- 200,753 people
- By 2030
- 200,232 · -0.3%
- By 2040
- 196,813 · -2.0%
- By 2050
- 190,347 · -5.2%
- By 2075
- 172,496 · -14.1%
- By 2100
- 146,284 · -27.1%
Race, ethnicity, and origin ACS 2023
- Neighborhood character
- Majority Black (64%)
- Race & ethnicity
- Black 64% White 27% Two or more races 5% Hispanic / Latino 5%
- Common ancestry
- Lithuanian 1%
- Foreign-born
- 2% · Canada
- Languages at home
- 95% English-only · Spanish 3% German/W. Germanic 1%
Political lean MEDSL · Richmond
- 2024 margin
- Solid D (+36.1) · D 67.8% · R 31.7%
- 2008→2024 swing
- +4.3pp toward D · 2008: 31.8pp · 2024: 36.1pp
- All cycles
- 2024: D+36.1 2020: D+37.2 2016: D+32.4 2012: D+33.8 2008: D+31.8
Not yet ingested
- Civics
- —
Market trends
- HPI YoY
- ▼ -58.99%
- Current HPI
- 213.5733
- Rent YoY
- ▼ -0.25%
- Metro
- Augusta-Richmond County, GA-SC
- State GDP YoY
- ▲ 2.66%
- F500 in state
- 28
Industry mix (Fortune 500 HQ in GA)
| Industry | F500 HQs | Revenue |
|---|---|---|
| Paper / Packaging | 2 | $29B |
|
||
| Retail | 1 | $160B |
|
||
| Transportation / Logistics | 1 | $91B |
|
||
| Airlines | 1 | $62B |
|
||
| Consumer Goods | 1 | $47B |
|
||
| Utilities | 1 | $25B |
|
||
Price history
+213.7% since first listed7 events — show timeline
- 2026-05-28 Sold (MLS) $80,000 Hive MLS
- 2026-05-23 Pending — Hive MLS
- 2026-05-11 Listing Removed — Hive MLS
- 2026-05-01 Listed $80,000 Hive MLS
- 2026-05-01 Listed $80,000 Hive MLS
- 2019-12-04 Sold (Public Records) $73,800 Public Records
- 1978-12-01 Sold (Public Records) $25,500 Public Records
Property tax history
+2.6%/yrLatest (2025): $1,443 · +2.6% YoY. Source: county tax records.
Cash-flow waterfall
monthlySold comps — $/sqft
last 12 mo · ≤1 miLoading sold comps…