2038 N Beglis Pkwy N · Sulphur, LA
Flood risk 5/10 · Moderate
- FEMA flood zone
- X (unshaded)
- Chance of flooding over 30 yrs
- 0.5%
- Est. flood insurance / yr
- $507 – $1,088
Fire risk 3/10 · Minor
- Est. fire insurance / yr
- $1,269 – $2,357
Heat risk 9/10 · Severe
- Hot days now (above 109°F)
- 7 days/yr
- Hot days in 30 yrs
- 22 days/yr
Wind risk 9/10 · Severe
- Chance of severe wind over 30 yrs
- 99.0%
Air-quality risk 2/10 · Minimal
- Unhealthy air days now
- 1 days/yr
- Unhealthy air days in 30 yrs
- 1 days/yr
Risk factors via First Street. Map © Google.
Why this score? — see what drove the D- grade
The composite is a weighted blend of 9 inputs, each scored 0–100. Each bar is that input's sub-score; the figure is the points it added to the 100-point composite (weight × sub-score).
- ARV discount +13.9/15.0
- Cash flow +7.6/30.0
- Rent growth +4.4/5.0
- Livability +3.6/5.0
- Schools +3.1/10.0
- Condition / age +2.5/5.0
- DSCR +1.7/10.0
- 1% rule +1.4/10.0
- Appreciation +0.0/10.0
$268,900
🖨 Deal sheet (PDF) 📄 Offer letter ✓ Due diligence
Listing remarks MLS
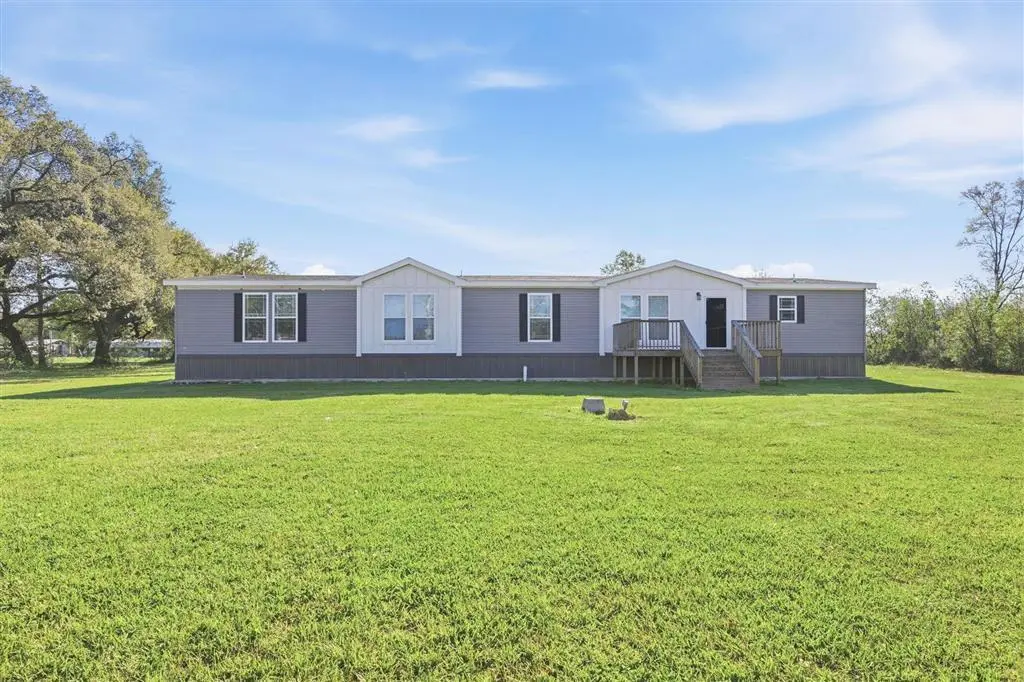
SPACIOUS CUSTOM DESIGNED 4-BEDROOM, 3 FULL BATH MANUFACTURED HOME SITUATED ON APPROXIMATELY 3 ACRES. FEATURES INCLUDE OPEN FLOOR PLAN WITH LARGE LIVING AREAS AND A SEPARATE GAME ROOM, OFFERING AMPLE SPACE FOR ENTERTAINING AND LIVING. INTERIOR INCLUDES LIGHT, NEUTRAL COLOR TONES THROUGHOUT. KITCHEN OFFERS AN ABUNDANCE OF CABINETS ALONG WITH A WALK IN PANTRY FOR ADDITIONAL STORAGE. PRIMARY BEDROOM FEATURES AN OVERSIZED BATH WITH A WALK-SHOWER AND LARGE TUB. OUTSIDE FEATURES A 10X16 FRONT PORCH WITH PLENTY OF SPACE FOR GARDENING, ACTIVITIES OR FUTURE IMPROVEMENTS. FLOOD ZONE X PER FEMA MAP. HOME IS SITTING ON A SLAB WITH ALL WHEELS AND TONGUE REMOVED AND HAS BEEN IMMOBILIZED. ALL MEASUREMENTS INCLUDING LAND M/L
Key facts
- Open floor plan
- Walk-shower
- Separate game room
Tags
Neighborhood map
What this means for you Summary
Snapshot
- This is a 4-bed/3.0-bath manufactured listed at $269k.
Deal economics
- At list price, monthly cash flow is $-321 ($-4k/yr) — negative.
- To cash-flow at today's rent, offer at most $212k (21.1% below list).
- To meet the 1% rule (rent ≥ 1% of price), the offer needs to be $171k (36.3% below list).
- Recommended offer: $171k (36.3% below list) — sets the bar for 1% rule.
- Cap rate 4.9% vs local median 8.8% in Sulphur — below-typical yield; the buyer is paying a premium for something (appreciation thesis, condition, location) that the cap rate doesn't capture.
Location & tenants
- Location reads 71/100 on livability (#48 in LA) — a middle-class / working-renter tenant base. Strengths: cost of living A+, housing A+, schools A; Watch: crime D-, amenities F, commute F.
- Calcasieu Parish (other): math 30% / reading 44% proficiency, ranked #29 of 98 in LA (top 30%) — families likely to look elsewhere, expect single-tenant / working-renter base with shorter leases.
- Market conditions: Rents rising fast (+7.7%/yr); 291 active listings in the ZIP; 1,298 units permitted in Calcasieu Parish in 2024 (526 in 5+ unit buildings).
- This rent runs 32% of the median local income ($65k/yr) — at the standard rent-burdened threshold; future hikes will face affordability resistance.
Forward outlook
- Local home prices are declining (-3.0%/yr); year-one equity from $2k of loan paydown is wiped out by about $8k of value loss. Plan a longer hold.
- Calcasieu County population projected at +11% by 2050 — modest demand growth; plan on rents tracking national, not racing it.
Negotiation context
- It's been on market 73 days — a 6% lower offer ($253k) is reasonable based on typical stale-listing flexibility.
- Current owner paid $68k; list at $269k implies a 295% gain — meaningful room to come down on a strong offer.
Risks & watch-outs
- Climate carrying-cost: moderate flood risk; severe wind risk, 99% chance of damaging wind over 30y; extreme-heat days projected 7→22/yr by 2055 (HVAC capex compounding) — expect insurance premiums to compound above CPI over the hold.
Questions for the listing agent
- What do current leases actually rent for vs. the listed asking? Can we see a recent rent roll and the last 12 months of T-12 income?
- It's been on market 73 days. Have you received any prior offers? Is the seller open to a 36% concession, seller financing, or rate buy-down credit?
- Why hasn't it sold? Are there any deal-killer items the seller is aware of (foundation, flood, title, zoning, code violations)?
- Is there a deadline driving the sale (1031 exchange, divorce, estate, relocation)? That informs how much negotiation room exists.
- Schools are A-rated — typically a magnet for longer-tenancy family renters. What's the average tenant stay here, and is there a school-zone premium baked into asking?
- Crime grade is D in this area — have there been break-ins, vandalism, or insurance claims at this property in the last 3 years? What carrier currently insures it and at what premium?
- The area grade is low — what's the realistic commute time and amenity access for the typical tenant pool here? Any planned neighborhood developments (good or bad) we should know about?
- What's the average days-on-market for RENTAL listings here right now (not sales)? A rising rental-DOM trend means longer vacancies and softer asking-rent achievability than the comps imply.
- What's the recent tenant-quality profile in this submarket — average credit score on applications, eviction rate, late-payment / NSF rate, and stable-employment percentage? A property-management company in the area should have these aggregated.
- How much new for-sale + rental construction is in the pipeline within 1–3 miles? Heavy new supply typically softens prices + rents 12–24 months out; constrained supply supports both.
Investment metrics
- 1% rule
- 0.64% ✗
- Cap rate
- 4.86%
- Cash-on-cash
- -5.11%
- DSCR
- 0.77
- GRM
- 13.1
CMA / ARV
- ARV (median comp)
- $313,644
- List price
- $268,900
- Delta
- -14.27%
- Verdict
- UNDERPRICED
- Comps
- 6 within 1.0 mi
Projected returns pro-forma
-3.0% appreciation · 7.65% rent growth · sell at horizon
- IRR
- -20.6%
- Equity multiple
- 0.26×
- Total profit
- $-55,683
- Equity at exit
- $40,094
- IRR
- -6.6%
- Equity multiple
- 0.51×
- Total profit
- $-37,214
- Equity at exit
- $23,250
Cash invested: $75,292 (down + closing). Projections, not guarantees.
Landlord ↔ Tenant lean methodology
- Overall (STATE)
- 90 Strongly Landlord-Friendly
- State Louisiana
- 90 Strongly Landlord-Friendly · R+12
- County
- — inherits STATE
- City
- — inherits STATE
ZIP-level market 70663
- Rents YoY
- 7.7%
- Active inventory
- 291
- Price-to-rent
- 13.1×
Monthly cashflow live
- Estimated rent
- $1,713 medium interval (Pro) →
- Mortgage (P&I)
- −$1,410
- Tax from tax record
- −$152 /mo · $1,824/yr
- Insurance
- −$112
- HOA
- −$0
- Vacancy / Maint / Mgmt
- −$360
- Net cashflow
- $-321
Break-even live
Sensitivity live
| Price | -10% $-168 | -5% $-244 | +0% $-321 | +5% $-397 | +10% $-473 |
|---|---|---|---|---|---|
| Rent | -10% $-456 | -5% $-388 | +0% $-321 | +5% $-253 | +10% $-185 |
| Rate | -1.0pp $-185 | -0.5pp $-252 | base $-321 | +0.5pp $-390 | +1.0pp $-461 |
UW: 25.0% down · 7.5% · 30yr · 1.5% tax · 5.0% vac · 8.0% maint · 8.0% mgmt
Financing live
Cash to close
- Down payment
- $67,225
- Closing costs
- $8,067
- Reserves months
- —
- Total cash needed
- —
Loan-product check · same deal, 3 products live
Conventional
25% down · 7.5% · 30yr
- Down + closing
- —
- Monthly P&I
- —
- Monthly cashflow
- —
- DSCR
- —
- Eligible?
- —
Personal DTI + credit; lowest rate.
DSCR
20% down · 8.5% · 30yr
- Down + closing
- —
- Monthly P&I
- —
- Monthly cashflow
- —
- DSCR
- —
- Eligible?
- —
No personal income docs; deal must DSCR.
Hard money
10% down · 12.0% · 12mo
- Down + closing
- —
- Monthly P&I
- —
- Monthly cashflow
- —
- DSCR
- —
- Eligible?
- —
Short-term bridge; refi at stabilization.
Listing history 7 events
-
2026-06-05statusdays on market $268,900 Pending 73 DOM
-
2026-06-02days on market $268,900 Active 71 DOM
-
2026-06-01days on market $268,900 Active 70 DOM
-
2026-05-31days on market $268,900 Active 69 DOM
-
2026-05-30days on market $268,900 Active 68 DOM
-
2026-03-23$268,900 Active 717-char remark
Show marketing remark (717 chars)
SPACIOUS CUSTOM DESIGNED 4-BEDROOM, 3 FULL BATH MANUFACTURED HOME SITUATED ON APPROXIMATELY 3 ACRES. FEATURES INCLUDE OPEN FLOOR PLAN WITH LARGE LIVING AREAS AND A SEPARATE GAME ROOM, OFFERING AMPLE SPACE FOR ENTERTAINING AND LIVING. INTERIOR INCLUDES LIGHT, NEUTRAL COLOR TONES THROUGHOUT. KITCHEN OFFERS AN ABUNDANCE OF CABINETS ALONG WITH A WALK IN PANTRY FOR ADDITIONAL STORAGE. PRIMARY BEDROOM FEATURES AN OVERSIZED BATH WITH A WALK-SHOWER AND LARGE TUB. OUTSIDE FEATURES A 10X16 FRONT PORCH WITH PLENTY OF SPACE FOR GARDENING, ACTIVITIES OR FUTURE IMPROVEMENTS. FLOOD ZONE X PER FEMA MAP. HOME IS SITTING ON A SLAB WITH ALL WHEELS AND TONGUE REMOVED AND HAS BEEN IMMOBILIZED. ALL MEASUREMENTS INCLUDING LAND M/L
-
2021-06-04soldstatus $68,000
ⓘ Source: listings_history table (triggers on properties + properties_extension) + one-shot
backfill from property_details.listing_events for pre-trigger history.
Tax reassessment forecast LA · Resets to sale price
- Current annual tax
- $1,824 · $152/mo
- Projected year-2 tax
- $1,824 · $152/mo
- Expected delta
- $0/yr ($0/mo · 0.0%)
ⓘ Screening estimate from a state-policy table — verify with the county assessor before closing.
Climate risk First Street
- Flood 5/10 Major FEMA zone X (unshaded) · 50% chance over 30 yrs
- Wildfire 3/10 Moderate
- Heat 9/10 Extreme 7 d/yr ≥109°F today · 22 d/yr by 30 yrs out
- Wind 9/10 Extreme 99% chance of damaging wind over 30 yrs
- Air quality 2/10 Low 1 unhealthy d/yr today · 1 by 30 yrs out
Nearby sold comps map
Loading sold comps map…
Walkable amenities ~0.75 mi
Loading nearby amenities…
Taxation est. · year 1
- Rental income
- $20,561
- − Mortgage interest
- −$15,063
- − Property taxes
- −$1,824
- − Insurance
- −$1,344
- − Repairs & maintenance
- −$1,645
- − Management
- −$1,645
- − Depreciation
- −$7,823
- Taxable loss
- −$8,782
- Est. tax savings @ 24.0%
- +$2,108
- After-tax cash flow
- $-1,739/yr
For passive investors: Depreciation is non-cash, so a rental often shows a tax loss while cash-flowing — sheltering income. Rental losses are passive: they offset passive income freely, and up to $25,000/yr can offset ordinary (W-2) income if you actively participate and your MAGI is under $100k (phasing out to $0 by $150k); unused losses carry forward. On sale, claimed depreciation is recaptured at up to 25%, and gains may owe capital-gains tax (a 1031 exchange can defer both). Figures are a year-1 estimate at your 24.0% rate — not tax advice; consult a CPA.
Schools (NCES district)
- District
- Calcasieu Parish
- NCES district ID
- 2200330
- Math proficiency
- 30% ▼ -39.00%
- Reading proficiency
- 44% ▼ -33.00%
- Median HH income
- $44,700
- Composite
- 31.45/100
- National rank
- #5979
- State rank
- #29 of 98 in LA
Livability — Sulphur
- Score
- 71/100
- State rank
- #48
- US rank
- #7164
Category grades
Schools grade is shown separately in the Schools card above.
Census & demographics
- County
- Calcasieu Parish · 170,889 people
- City population
- 27,799
- Metro
- Lake Charles, LA
- Population (ZIP)
- 27,799
- Household income
- $64,707
- Rent vs Own
- Severe rent burden
- 197.0
Population outlook (Calcasieu County) Hauer SSP2
- Today (2025)
- 212,179 people
- By 2030
- 218,199 · +2.8%
- By 2040
- 228,486 · +7.7%
- By 2050
- 236,208 · +11.3%
- By 2075
- 251,696 · +18.6%
- By 2100
- 247,848 · +16.8%
Race, ethnicity, and origin ACS 2023
- Neighborhood character
- Predominantly White (82%)
- Race & ethnicity
- White 82% Black 8% Hispanic / Latino 5% Two or more races 4%
- Common ancestry
- Lithuanian 13% Slovak 2% Scandinavian 1%
- Foreign-born
- 3% · Canada, Vietnam
- Languages at home
- 94% English-only · Spanish 2% French/Haitian/Cajun 2% Other Indo-European 1%
Political lean MEDSL · Calcasieu
- 2024 margin
- Solid R (+39.6) · D 29.5% · R 69.0% · Other 1.5%
- 2008→2024 swing
- -15.0pp toward R · 2008: -24.6pp · 2024: -39.6pp
- All cycles
- 2024: R+39.6 2020: R+35.2 2016: R+33.3 2012: R+28.7 2008: R+24.6
Not yet ingested
- Civics
- —
Market trends
- HPI YoY
- ▼ -104.29%
- Current HPI
- 100.0895
- Rent YoY
- ▲ 7.65%
- Metro
- Lake Charles, LA
- State GDP YoY
- ▲ 3.29%
- F500 in state
- 10
Industry mix (Fortune 500 HQ in LA)
| Industry | F500 HQs | Revenue |
|---|---|---|
| Telecommunications | 2 | $23B |
|
||
| Utilities | 1 | $12B |
|
||
| Wholesale / Distribution | 1 | $5B |
|
||
| Advertising | 1 | $2B |
|
||
Price history
+295.4% since first listed2 events — show timeline
- 2026-03-23 Listed $268,900 SWLAR
- 2021-06-04 Sold (Public Records) $68,000 Public Records
Property tax history
+18.8%/yrLatest (2025): $1,824 · -1.7% YoY. Source: county tax records.
Cash-flow waterfall
monthlySold comps — $/sqft
last 12 mo · ≤1 miLoading sold comps…