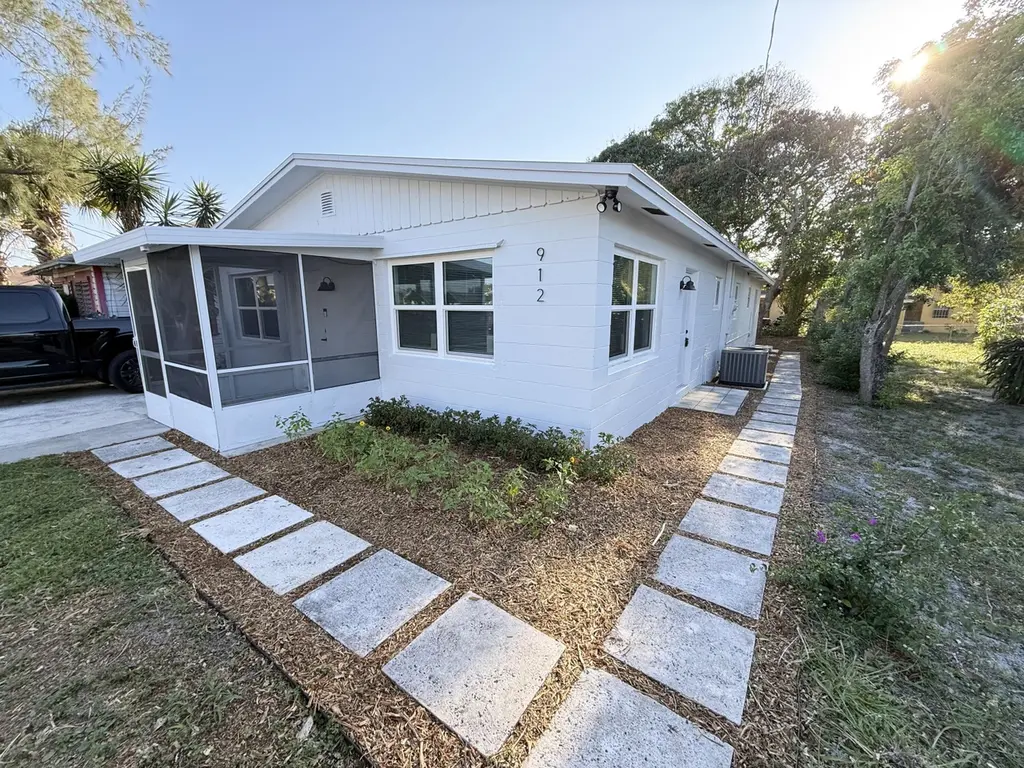
912 SE Tarpon Ave · Stuart, FL
Flood risk 4/10 · Minor
- FEMA flood zone
- X (unshaded)
- Chance of flooding over 30 yrs
- 0.13%
- Est. flood insurance / yr
- $507 – $1,088
Fire risk 1/10 · Minimal
- Est. fire insurance / yr
- $947 – $1,759
Heat risk 10/10 · Severe
- Hot days now (above 106°F)
- 7 days/yr
- Hot days in 30 yrs
- 24 days/yr
Wind risk 10/10 · Severe
- Chance of severe wind over 30 yrs
- 99.0%
Air-quality risk 2/10 · Minimal
- Unhealthy air days now
- 2 days/yr
- Unhealthy air days in 30 yrs
- 2 days/yr
Risk factors via First Street. Map © Google.
Why this score? — see what drove the C+ grade
The composite is a weighted blend of 9 inputs, each scored 0–100. Each bar is that input's sub-score; the figure is the points it added to the 100-point composite (weight × sub-score).
- Cash flow +21.7/30.0
- ARV discount +14.3/15.0
- DSCR +6.9/10.0
- 1% rule +4.9/10.0
- Schools +4.5/10.0
- Livability +4.2/5.0
- Condition / age +2.5/5.0
- Rent growth +2.3/5.0
- Appreciation +0.0/10.0
$288,000
🖨 Deal sheet 📄 Offer letter ✓ Due diligence
Listing remarks MLS
Excellent Investment Opportunity for this 3BR 2BA Concrete Block Home, located minutes from park. Home features a Granite Kitchen and Fresh Paint on inside. A lot of home for the money!
Key facts
- Updated bathrooms
- Newer central ac
- Updated kitchen
Tags
Property features AI
Exterior
- Parking: Concrete parking; 2 total parking spaces
- Utilities: Public water; Public sewer; Electricity available
- Home design: Single-family residence; One story; Faces east; Resale property
- Construction: Block and concrete construction; Shingle roof
- Exterior features: Fruit trees on lot; Lot measures approximately 43 ft x 43 ft; Not waterfront
Interior
- Kitchen: Electric range; Refrigerator
- Bedrooms: 4 main-level bedrooms
- Flooring: Tile
- Bathrooms: 2 full bathrooms (both on main level)
- Heating & cooling: Central heating; Central air conditioning
- Interior features: Blinds and storm windows; Unfurnished
- Laundry & utility: Laundry closet
Neighborhood map
What this means for you Summary
Snapshot
- This is a 3-bed/2.0-bath single-family listed at $288k.
Deal economics
- At list price, monthly cash flow is $441 ($5k/yr) — positive.
- The deal already cash-flows at list — no discount required.
- To meet the 1% rule (rent ≥ 1% of price), the offer needs to be $286k (0.8% below list).
- Recommended offer: $279k (3.0% below list) — sets the bar for market timing.
- Cap rate 8.1% vs local median 4.1% in Stuart — top-decile yield for the area; either an underpriced asset or a hidden risk that comps aren't pricing in. Stress-test before assuming the spread holds.
Location & tenants
- Location reads 84/100 on livability (#39 in FL, #790 nationally) — a professional / high-income tenant draw. Strengths: commute A+, housing A+, health & safety A+; Watch: crime C-, employment C-, amenities D.
- Martin (suburban): math 52% / reading 53% proficiency, ranked #24 of 73 in FL (top 33%) — acceptable for families but not a draw, mixed tenant base, ~2y average lease.
- Market conditions: Rents soft (-0.7%/yr); 256 active listings in the ZIP; 35 comparable units currently listed for rent nearby; rentals at typical pace (median 24d on market — plan ~3-4 weeks tenant-placement turnaround); 737 units permitted in Martin County in 2024 (167 in 5+ unit buildings).
- At $2,858/mo this rent would consume 55% of the median local household income ($63k/yr) (locally 1408% of renters already pay >50% of income on rent) — very limited rent-growth headroom before tenants either downsize or default.
Forward outlook
- Local home prices are declining (-3.0%/yr); year-one equity from $2k of loan paydown is wiped out by about $9k of value loss. Plan a longer hold.
- Martin County population projected at +19% by 2050 — long-run rental-demand tailwind backs the buy-and-hold thesis.
Negotiation context
- It's been on market 38 days — a 3% lower offer ($279k) is reasonable based on typical stale-listing flexibility.
- 13 sale attempts since 14y ago with the ask held roughly flat each time — persistent listings suggest the price (not the market) is what's stuck; bring a comps-based counter.
- Current owner paid $110k; list at $288k implies a 162% gain — meaningful room to come down on a strong offer.
Risks & watch-outs
- Climate carrying-cost: severe wind risk, 99% chance of damaging wind over 30y; extreme-heat days projected 7→24/yr by 2055 (HVAC capex compounding) — expect insurance premiums to compound above CPI over the hold.
Questions for the listing agent
- It's been on market 38 days. Have you received any prior offers? Is the seller open to a 3% concession, seller financing, or rate buy-down credit?
- Built in 1967 — when were the roof, HVAC, electrical panel, plumbing, and water heater last replaced?
- Is there a deadline driving the sale (1031 exchange, divorce, estate, relocation)? That informs how much negotiation room exists.
- Schools are A-rated — typically a magnet for longer-tenancy family renters. What's the average tenant stay here, and is there a school-zone premium baked into asking?
- What's the average days-on-market for RENTAL listings here right now (not sales)? A rising rental-DOM trend means longer vacancies and softer asking-rent achievability than the comps imply.
- What's the recent tenant-quality profile in this submarket — average credit score on applications, eviction rate, late-payment / NSF rate, and stable-employment percentage? A property-management company in the area should have these aggregated.
- How much new for-sale + rental construction is in the pipeline within 1–3 miles? Heavy new supply typically softens prices + rents 12–24 months out; constrained supply supports both.
Investment metrics
- 1% rule
- 0.99% ✗
- Cap rate
- 8.13%
- Cash-on-cash
- 6.57%
- DSCR
- 1.29
- GRM
- 8.4
CMA / ARV
- ARV (median comp)
- $339,036
- List price
- $288,000
- Delta
- -15.05%
- Verdict
- UNDERPRICED
- Comps
- 20 within 1.0 mi
Show comp detail 12 sales within ~0.75 mi
| Address | Dist | Beds/Ba | Sqft | Sold | Price | $/sf | Match |
|---|---|---|---|---|---|---|---|
| 905 SE 10th St | 0.16mi | 4/2.0 (+1) | 1,503 (+3%) | 0mo | $350,000 | $233 | 82 |
| 900 SE Lake St | 0.17mi | 3/2.0 | 1,592 (+9%) | 3mo | $330,000 | $207 | 75 |
| 819 SE Stypmann Blvd | 0.34mi | 3/2.0 | 1,306 (-11%) | 2mo | $492,500 | $377 | 65 |
| 912 SE Martin Luther King Jr Blvd | 0.27mi | 4/2.0 (+1) | 1,324 (-10%) | 4mo | $308,000 | $233 | 63 |
| 1017 SE 16th Ct | 0.62mi | 3/2.0 | 1,368 (-6%) | 8mo | $360,000 | $263 | 54 |
| 246 SE Ila St | 0.60mi | 3/2.0 | 1,581 (+8%) | 8mo | $470,000 | $297 | 52 |
| 804 SE Riverside Dr | 0.62mi | 2/2.5 (-1) | 1,372 (-6%) | 5mo | $765,000 | $558 | 50 |
| 715 SE Alamanda Way | 0.47mi | 3/2.0 | 1,677 (+15%) | 8mo | $449,000 | $268 | 47 |
| 221 SE Coconut Ave | 0.63mi | 3/2.5 | 1,641 (+12%) | 2mo | $738,000 | $450 | 46 |
| 724 SE Michaels Ct | 0.56mi | 3/2.0 | 1,678 (+15%) | 4mo | $470,000 | $280 | 46 |
| 1027 SE Osceola St | 0.62mi | 2/1.5 (-1) | 1,604 (+10%) | 3mo | $650,000 | $405 | 45 |
| 1305 SE Sea Oat Ln | 0.54mi | 4/2.0 (+1) | 1,654 (+13%) | 6mo | $557,000 | $337 | 43 |
Match score weights: distance 35% · size 25% · config 20% · recency 20%. Top-matched comps best support the ARV.
Projected returns pro-forma
-3.0% appreciation · 0.0% rent growth · sell at horizon
- IRR
- -9.4%
- Equity multiple
- 0.67×
- Total profit
- $-26,991
- Equity at exit
- $42,942
- IRR
- -4.3%
- Equity multiple
- 0.75×
- Total profit
- $-19,923
- Equity at exit
- $24,901
Cash invested: $80,640 (down + closing). Projections, not guarantees.
Landlord ↔ Tenant lean methodology
- Overall (STATE)
- 87 Strongly Landlord-Friendly
- State Florida
- 87 Strongly Landlord-Friendly · R+3
- County
- — inherits STATE
- City
- — inherits STATE
ZIP-level market 34994
- Home prices YoY
- -27.1%
- Rents YoY
- -0.7%
- Active inventory
- 256
- Price-to-rent
- 8.4×
Monthly cashflow live
- Estimated rent
- $2,858 high interval (Pro) →
- Mortgage (P&I)
- −$1,510
- Tax from tax record
- −$186 /mo · $2,229/yr
- Insurance
- −$120
- HOA
- −$0
- Vacancy / Maint / Mgmt
- −$600
- Net cashflow
- $441
Break-even live
UW: 25.0% down · 7.5% · 30yr · 1.5% tax · 5.0% vac · 8.0% maint · 8.0% mgmt
Financing live
Cash to close
- Down payment
- $72,000
- Closing costs
- $8,640
- Reserves months
- —
- Total cash needed
- —
Loan-product check · same deal, 3 products live
Conventional
25% down · 7.5% · 30yr
- Down + closing
- —
- Monthly P&I
- —
- Monthly cashflow
- —
- DSCR
- —
- Eligible?
- —
Personal DTI + credit; lowest rate.
DSCR
20% down · 8.5% · 30yr
- Down + closing
- —
- Monthly P&I
- —
- Monthly cashflow
- —
- DSCR
- —
- Eligible?
- —
No personal income docs; deal must DSCR.
Hard money
10% down · 12.0% · 12mo
- Down + closing
- —
- Monthly P&I
- —
- Monthly cashflow
- —
- DSCR
- —
- Eligible?
- —
Short-term bridge; refi at stabilization.
Rent comps 35 comps
| Address | Beds | Baths | Sqft | Rent | $/sqft | DOM | Units | Dist |
|---|---|---|---|---|---|---|---|---|
| 801 SE Central Ave Stuart, FL | 3.0 | 1.0 | 899 | $2,300 | $2.56 | 14d | 1 | 0.38mi |
| 1604 SE Apache Ave Stuart, FL | 4.0 | 2.0 | 1404 | $3,300 | $2.35 | 23d | 1 | 0.46mi |
| 217 SE Coconut Ave Stuart, FL | 2.0 | 1.0 | 1197 | $5,000 | $4.18 | 23d | 1 | 0.64mi |
| 400 SE Central Pkwy Stuart, FL | 1.0–2.0 | 1.0–2.0 | 918 | $2,640 | $2.87 | 14d | 16 | 0.72mi |
| 801 SE Central Pkwy #7 Stuart, FL | 2.0 | 2.0 | 1046 | $2,150 | $2.06 | 14d | 1 | 0.79mi |
| 310 SE Denver Ave Unit 2 Stuart, FL | 2.0 | 2.0 | 1300 | $2,900 | $2.23 | 14d | 1 | 0.79mi |
| 950 S Kanner Hwy Stuart, FL | 2.0 | 2.0 | 1019 | $1,888 | $1.85 | 21d | 3 | 0.79mi |
| 950 S Kanner Hwy Stuart, FL | 1.0–2.0 | 1.0–2.0 | 850 | $2,000 | $2.35 | 14d | 4 | 0.79mi |
| 950 S Kanner Hwy Stuart, FL | 1.0–2.0 | 1.0–2.5 | 1062 | $2,000 | $1.88 | 23d | 5 | 0.79mi |
| 345 SE Angler Dr Stuart, FL | 3.0 | 2.5 | 1475 | $2,650 | $1.80 | 21d | 1 | 0.83mi |
| 85 SE Hancock St Stuart, FL | 1.0–2.0 | 1.0–2.0 | 1278 | $2,300 | $1.80 | 14d | 2 | 0.87mi |
| 40 SE Sedona Cir #103 Stuart, FL | 3.0 | 2.5 | 1671 | $3,800 | $2.27 | 23d | 1 | 0.88mi |
| 905 SE Flamingo Ave Stuart, FL | 3.0 | 2.0 | 1520 | $4,500 | $2.96 | 23d | 1 | 0.95mi |
| 41 SW Seminole St Stuart, FL | 3.0 | 1.0–2.5 | 1353 | $18,000 | $13.30 | 23d | 3 | 1.00mi |
| 47 SW Osceola St Unit UN206 Stuart, FL | 2.0 | 2.0 | 1276 | $3,900 | $3.06 | 23d | 1 | 1.00mi |
| 47 SW Osceola St #206 Stuart, FL | 2.0 | 2.0 | 1276 | $4,000 | $3.13 | 23d | 1 | 1.00mi |
| 1900 S Kanner Hwy Unit 2-203 Stuart, FL | 2.0 | 2.0 | 1086 | $1,800 | $1.66 | 14d | 1 | 1.06mi |
| 201 SW Joan Jefferson Way Stuart, FL | 2.0–3.0 | 2.0 | 1400 | $3,295 | $2.35 | 14d | 10 | 1.06mi |
| 47 SE Sedona Cir #203 Stuart, FL | 3.0 | 2.5 | 1450 | $2,200 | $1.52 | 23d | 1 | 1.08mi |
| 44 SE Sedona Cir #201 Stuart, FL | 3.0 | 2.0 | 1443 | $2,200 | $1.52 | 23d | 1 | 1.08mi |
| 701 SW Bryant Ave Stuart, FL | 2.0 | 1.0 | 1295 | $3,300 | $2.55 | 14d | 1 | 1.08mi |
| 1871 SW Palm City Rd Unit G401 Stuart, FL | 3.0 | 2.0 | 1289 | $2,200 | $1.71 | 23d | 1 | 1.09mi |
| 2118 SE Edler Dr Unit B Stuart, FL | 2.0 | 2.0 | 876 | $1,995 | $2.28 | 23d | 1 | 1.15mi |
| 2124 SE Edler Dr Stuart, FL | 2.0 | 2.0 | 876 | $1,800 | $2.05 | 23d | 1 | 1.17mi |
| 514 SW North Carolina Dr Stuart, FL | 3.0 | 2.0 | 1836 | $3,695 | $2.01 | 14d | 1 | 1.19mi |
| 1215 SE Glenwood Dr Stuart, FL | 2.0 | 2.0 | 1089 | $1,859 | $1.71 | 14d | 10 | 1.27mi |
| 175 SE Saint Lucie Blvd Stuart, FL | 2.0 | 2.0–2.5 | 1300 | $2,600 | $2.00 | 23d | 4 | 1.32mi |
| 300 SE Saint Lucie Blvd Stuart, FL | 1.0–3.0 | 1.0–2.0 | 884 | $2,728 | $3.09 | 14d | 12 | 1.34mi |
| 1868 SW Palm City Rd Apt 202 Stuart, FL | 2.0 | 2.0 | 1191 | $2,900 | $2.43 | 23d | 1 | 1.36mi |
| 1950 SW Palm City Rd Stuart, FL | 2.0 | 2.0 | 1031 | $3,150 | $3.05 | 23d | 3 | 1.38mi |
| 1950 SW Palm City Rd Unit 4-4205 Stuart, FL | 2.0 | 2.0 | 938 | $2,400 | $2.56 | 14d | 1 | 1.38mi |
| 262 SE Monterey Ave Stuart, FL | 3.0 | 1.0 | 1001 | $3,500 | $3.50 | 23d | 1 | 1.44mi |
| 2600 S Kanner Hwy Stuart, FL | 1.0–2.0 | 1.5–2.0 | 890 | $1,950 | $2.19 | 14d | 3 | 1.45mi |
| 2600 SE Ocean Blvd Stuart, FL | 1.0–2.0 | 1.5–2.0 | 951 | $1,900 | $2.00 | 14d | 3 | 1.48mi |
| 150 SE Four Winds Dr Unit B303 Stuart, FL | 2.0 | 2.0 | 1359 | $2,500 | $1.84 | 23d | 1 | 1.50mi |
Listing history 49 events
-
2026-06-19price $288,000 Active 38 DOM
-
2026-06-18days on market $294,000 Active 38 DOM
-
2026-06-17days on market $294,000 Active 37 DOM
-
2026-06-16days on market $294,000 Active 36 DOM
-
2026-06-15days on market $294,000 Active 35 DOM
-
2026-06-14days on market $294,000 Active 33 DOM
-
2026-06-13days on market $294,000 Active 32 DOM
-
2026-06-10pricedays on market $294,000 Active 30 DOM
-
2026-06-09days on market $295,000 Active 29 DOM
-
2026-06-08days on market $295,000 Active 28 DOM
-
2026-06-07days on market $295,000 Active 27 DOM
-
2026-06-03days on market $295,000 Active 23 DOM
-
2026-06-02days on market $295,000 Active 22 DOM
-
2026-06-01days on market $295,000 Active 21 DOM
-
2026-05-31days on market $295,000 Active 20 DOM
-
2026-05-31days on market $295,000 Active 19 DOM
-
2026-05-11$295,000 Active 799-char remark
-
2026-02-09soldstatus $110,000
-
2017-12-28soldstatus $69,000
-
2017-12-20soldstatus $69,000 Closed 185-char remark
Show marketing remark (185 chars)
Excellent Investment Opportunity for this 3BR 2BA Concrete Block Home, located minutes from park. Home features a Granite Kitchen and Fresh Paint on inside. A lot of home for the money!
-
2017-12-12historical Contingent 185-char remark
Show marketing remark (185 chars)
Excellent Investment Opportunity for this 3BR 2BA Concrete Block Home, located minutes from park. Home features a Granite Kitchen and Fresh Paint on inside. A lot of home for the money!
-
2017-11-22price $77,000 185-char remark
Show marketing remark (185 chars)
Excellent Investment Opportunity for this 3BR 2BA Concrete Block Home, located minutes from park. Home features a Granite Kitchen and Fresh Paint on inside. A lot of home for the money!
-
2017-11-15status Active 185-char remark
Show marketing remark (185 chars)
Excellent Investment Opportunity for this 3BR 2BA Concrete Block Home, located minutes from park. Home features a Granite Kitchen and Fresh Paint on inside. A lot of home for the money!
-
2017-11-10historical Contingent 185-char remark
Show marketing remark (185 chars)
Excellent Investment Opportunity for this 3BR 2BA Concrete Block Home, located minutes from park. Home features a Granite Kitchen and Fresh Paint on inside. A lot of home for the money!
-
2017-10-30price $78,000 185-char remark
Show marketing remark (185 chars)
Excellent Investment Opportunity for this 3BR 2BA Concrete Block Home, located minutes from park. Home features a Granite Kitchen and Fresh Paint on inside. A lot of home for the money!
-
2017-10-12$79,900 Active 185-char remark
Show marketing remark (185 chars)
Excellent Investment Opportunity for this 3BR 2BA Concrete Block Home, located minutes from park. Home features a Granite Kitchen and Fresh Paint on inside. A lot of home for the money!
-
2017-09-28historical
-
2017-09-27status Active
-
2017-09-04historical Contingent
-
2017-07-20status Active
-
2017-07-14historical Contingent
-
2017-07-12status Active
-
2017-07-06historical Contingent
-
2017-06-26$89,900 Active
-
2015-04-17historical
-
2015-03-18status Active
-
2015-03-16historical Contingent
-
2015-03-05price $50,000
-
2014-12-16historical
-
2014-11-17$54,900 Active
-
2014-09-28historical
-
2014-05-31$65,000
-
2013-09-28$69,000
-
2013-04-04soldstatus $29,500
-
2013-03-29historical
-
2012-11-07$32,900
-
2012-10-22historical
-
2012-09-17$39,000
-
2004-05-05soldstatus $80,000
ⓘ Source: listings_history table (triggers on properties + properties_extension) + one-shot
backfill from property_details.listing_events for pre-trigger history.
Tax reassessment forecast FL · Resets to sale price
- Current annual tax
- $2,229 · $186/mo
- Projected year-2 tax
- $2,390 · $199/mo
- Expected delta
- +$162/yr (+$13/mo · 7.2%)
ⓘ Screening estimate from a state-policy table — verify with the county assessor before closing.
Climate risk First Street
- Flood 4/10 Moderate FEMA zone X (unshaded) · 13% chance over 30 yrs
- Wildfire 1/10 Low
- Heat 10/10 Extreme 7 d/yr ≥106°F today · 24 d/yr by 30 yrs out
- Wind 10/10 Extreme 99% chance of damaging wind over 30 yrs
- Air quality 2/10 Low 2 unhealthy d/yr today · 2 by 30 yrs out
Nearby sold comps map
Loading sold comps map…
Walkable amenities ~0.75 mi
Loading nearby amenities…
Taxation est. · year 1
- Rental income
- $34,291
- − Mortgage interest
- −$16,132
- − Property taxes
- −$2,229
- − Insurance
- −$1,440
- − Repairs & maintenance
- −$2,743
- − Management
- −$2,743
- − Depreciation
- −$8,378
- Taxable income
- $625
- Est. tax owed @ 24.0%
- −$150
- After-tax cash flow
- $5,147/yr
For passive investors: Depreciation is non-cash, so a rental often shows a tax loss while cash-flowing — sheltering income. Rental losses are passive: they offset passive income freely, and up to $25,000/yr can offset ordinary (W-2) income if you actively participate and your MAGI is under $100k (phasing out to $0 by $150k); unused losses carry forward. On sale, claimed depreciation is recaptured at up to 25%, and gains may owe capital-gains tax (a 1031 exchange can defer both). Figures are a year-1 estimate at your 24.0% rate — not tax advice; consult a CPA.
Schools (NCES district)
- District
- Martin
- NCES district ID
- 1201290
- Math proficiency
- 52% ▼ -14.00%
- Reading proficiency
- 53% ▼ -4.00%
- Median HH income
- $52,482
- Composite
- 45.1/100
- National rank
- #2690
- State rank
- #24 of 73 in FL
Livability — Stuart
- Score
- 84/100
- State rank
- #39
- US rank
- #790
Category grades
Schools grade is shown separately in the Schools card above.
Census & demographics
- Census place
- Stuart, FL
- County
- Martin County · 165,223 people
- City population
- 65,812
- Metro
- Port St. Lucie, FL
- Population (ZIP)
- 18,737
- Household income
- $62,533
- Rent vs Own
- Severe rent burden
- 1408.0
Population outlook (Martin County) Hauer SSP2
- Today (2025)
- 172,383 people
- By 2030
- 180,192 · +4.5%
- By 2040
- 194,114 · +12.6%
- By 2050
- 204,992 · +18.9%
- By 2075
- 229,641 · +33.2%
- By 2100
- 232,146 · +34.7%
Race, ethnicity, and origin ACS 2023
- Neighborhood character
- Majority White (65%)
- Race & ethnicity
- White 65% Hispanic / Latino 21% Two or more races 12% Black 11%
- Hispanic origin (detail)
- Mexican 6% Puerto Rican 5% Cuban 1%
- Common ancestry
- Romanian 5% Lithuanian 3% Slovak 2%
- Foreign-born
- 12% · Canada
- Languages at home
- 80% English-only · Spanish 16% Russian/Polish/Slavic 2% Other Indo-European 1%
Political lean MEDSL · Martin
- 2024 margin
- Solid R (+31.1) · D 34.1% · R 65.2%
- 2008→2024 swing
- -17.5pp toward R · 2008: -13.6pp · 2024: -31.1pp
- All cycles
- 2024: R+31.1 2020: R+24.6 2016: R+26.9 2012: R+22.9 2008: R+13.6
Not yet ingested
- Civics
- —
Market trends
- HPI YoY
- ▼ -130.08%
- Current HPI
- 349.7061
- Rent YoY
- ▼ -0.69%
- Metro
- Port St. Lucie, FL
- State GDP YoY
- ▲ 3.28%
- F500 in state
- 36
Industry mix (Fortune 500 HQ in FL)
| Industry | F500 HQs | Revenue |
|---|---|---|
| Industrial Technology | 2 | $29B |
|
||
| Insurance | 2 | $17B |
|
||
| Retail | 1 | $60B |
|
||
| Technology Distribution | 1 | $58B |
|
||
| Homebuilding | 1 | $35B |
|
||
| Technology Manufacturing | 1 | $35B |
|
||
Price history
+267.5% since first listed34 events — show timeline
- 2026-06-09 Price Changed $294,000 Beaches MLS
- 2026-05-11 Listed $295,000 Beaches MLS
- 2026-02-09 Sold (Public Records) $110,000 Public Records
- 2017-12-28 Sold (Public Records) $69,000 Public Records
- 2017-12-20 Sold (MLS) $69,000 Beaches MLS
- 2017-12-12 Contingent — Beaches MLS
- 2017-11-22 Price Changed $77,000 Beaches MLS
- 2017-11-15 Relisted — Beaches MLS
- 2017-11-10 Contingent — Beaches MLS
- 2017-10-30 Price Changed $78,000 Beaches MLS
- 2017-10-12 Listed $79,900 Beaches MLS
- 2017-09-28 Listing Removed — Beaches MLS
- 2017-09-27 Relisted — Beaches MLS
- 2017-09-04 Contingent — Beaches MLS
- 2017-07-20 Relisted — Beaches MLS
- 2017-07-14 Contingent — Beaches MLS
- 2017-07-12 Relisted — Beaches MLS
- 2017-07-06 Contingent — Beaches MLS
- 2017-06-26 Listed $89,900 Beaches MLS
- 2015-04-17 Listing Removed — Beaches MLS
- 2015-03-18 Relisted — Beaches MLS
- 2015-03-16 Contingent — Beaches MLS
- 2015-03-05 Price Changed $50,000 Beaches MLS
- 2014-12-16 Listing Removed — Beaches MLS
- 2014-11-17 Listed $54,900 Beaches MLS
- 2014-09-28 Listing Removed — MCRTC
- 2014-05-31 Listed $65,000 Beaches MLS
- 2013-09-28 Listed $69,000 MCRTC
- 2013-04-04 Sold (MLS) $29,500 Beaches MLS
- 2013-03-29 Listing Removed — Beaches MLS
- 2012-11-07 Listed $32,900 Beaches MLS
- 2012-10-22 Listing Removed — Beaches MLS
- 2012-09-17 Listed $39,000 Beaches MLS
- 2004-05-05 Sold (Public Records) $80,000 Public Records
Property tax history
+11.5%/yrLatest (2025): $2,229 · +4.1% YoY. Source: county tax records.
Cash-flow waterfall
monthlySold comps — $/sqft
last 12 mo · ≤1 miLoading sold comps…