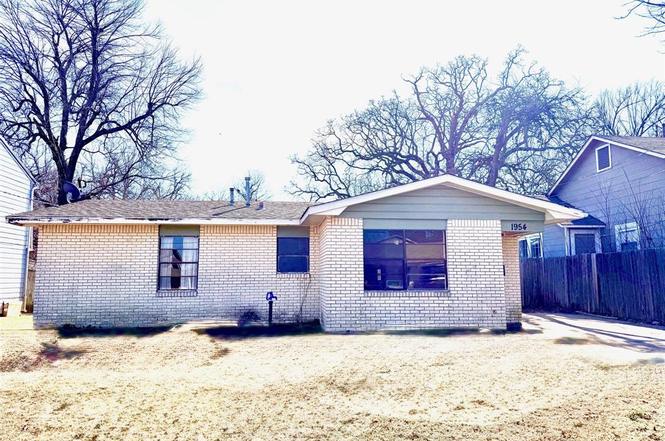
1954 E Booth St · Paris, TX
Flood risk 1/10 · Minimal
- FEMA flood zone
- X (unshaded)
- Chance of flooding over 30 yrs
- 0.0%
- Est. flood insurance / yr
- $507 – $1,088
Fire risk 5/10 · Moderate
- Est. fire insurance / yr
- $1,222 – $2,270
Heat risk 7/10 · Major
- Hot days now (above 110°F)
- 7 days/yr
- Hot days in 30 yrs
- 22 days/yr
Wind risk 4/10 · Minor
- Chance of severe wind over 30 yrs
- 23.0%
Air-quality risk 2/10 · Minimal
- Unhealthy air days now
- 0 days/yr
- Unhealthy air days in 30 yrs
- 1 days/yr
Risk factors via First Street. Map © Google.
Why this score? — see what drove the B+ grade
The composite is a weighted blend of 9 inputs, each scored 0–100. Each bar is that input's sub-score; the figure is the points it added to the 100-point composite (weight × sub-score).
- Cash flow +30.0/30.0
- ARV discount +15.0/15.0
- 1% rule +10.0/10.0
- DSCR +10.0/10.0
- Livability +3.1/5.0
- Schools +3.0/10.0
- Rent growth +2.5/5.0
- Condition / age +2.5/5.0
- Appreciation +0.0/10.0
$79,900
🖨 Deal sheet (PDF) 📄 Offer letter ✓ Due diligence
Listing remarks
Solid brick-veneer home offering 3 bedrooms, 1 bathroom, and 2 living areas. Gas log fireplace in cozy den, functional kitchen layout with stove and refrigerator conveying to new owner and ample space for everyday living or future updates. Exterior features a fenced backyard, providing privacy and room for outdoor activities. Ideal property for investors or buyers seeking a home with strong potential.
Key facts
- Gas log fireplace
- Brick veneer home
- Fenced backyard
Tags
Property features AI
Finance
- Financial info: Accepts cash and conventional financing
- HOA & community: No homeowners association
Exterior
- Parking: Concrete parking
- Utilities: City water; City sewer; Electricity connected; Individual gas meter; Natural gas available; Not in a municipal utility district
- Home design: Single-family residence; One story; Residential property
- Construction: Brick construction; Composition roof; Slab foundation; Built in 1965
- Exterior features: Back yard chain link fencing; Interior lot; Sandy loam soil
Interior
- Kitchen: Eat-in kitchen with breakfast bar; Dishwasher; Electric range; Refrigerator; Gas water heater
- Bedrooms: 3 bedrooms (all on main level)
- Bathrooms: 1 full bathroom
- Heating & cooling: Central heating; Gas jets/Natural gas; Central air conditioning; Ceiling fans
- Interior features: Cable TV available; Eat-in kitchen; High speed internet available; Two living areas; One dining area; Seven total rooms; One-level layout
- Laundry & utility: Full-size washer/dryer area; Washer hookup; Electric dryer hookup; Utility room
Neighborhood map
What this means for you Summary
Snapshot
- This is a 3-bed/1.0-bath single-family listed at $80k.
Deal economics
- At list price, monthly cash flow is $513 ($6k/yr) — positive.
- The deal already cash-flows at list — no discount required.
- Meets the 1% rule at list price ($1k rent vs $80k).
- Recommended offer: $70k (12.0% below list) — sets the bar for market timing.
- Cap rate 14.0% vs local median 3.7% in Paris — top-decile yield for the area; either an underpriced asset or a hidden risk that comps aren't pricing in. Stress-test before assuming the spread holds.
Location & tenants
- Location reads 61/100 on livability (#984 in TX) — a middle-class / working-renter tenant base. Strengths: cost of living A+, housing A+; Watch: crime F, amenities F, commute F.
- Paris ISD (town): math 36% / reading 37% proficiency, ranked #521 of 826 in TX (top 63%) — families likely to look elsewhere, expect single-tenant / working-renter base with shorter leases; 70% free/reduced lunch — lower-income household profile, screen leases tightly.
- Zoned schools: Givens Early Childhood Center (103 students, 93% FRL); Crockett Int (math 33% / reading 33%, grade F, #930 of 1,662 statewide, top 57%, 560 students, 79% FRL); Paris H S (math 60% / reading 51%, grade C, #364 of 1,632 statewide, top 23%, 934 students, 71% FRL).
- Market conditions: 277 active listings in the ZIP; 4 comparable units currently listed for rent nearby; rentals lingering (median 46d on market — plan ~5-8 weeks vacancy on turnover, expect pricing pressure); 100% of comp listings sitting > 30 days — soft ceiling on asking rent; 119 units permitted in Lamar County in 2024 (71 in 5+ unit buildings).
- This rent runs 35% of the median local income ($46k/yr) — at the standard rent-burdened threshold; future hikes will face affordability resistance.
Forward outlook
- Local home prices are declining (-3.0%/yr); year-one equity from $552 of loan paydown is wiped out by about $2k of value loss. Plan a longer hold.
- Lamar County population projected at -13% by 2050 — secular population decline; favor cash flow + early exit over multi-decade hold.
- At projected returns (-3.0% appreciation + 3.0% rent growth), your $22k cash investment doubles in ~5 years — after that, you're playing with house money.
Negotiation context
- It's been on market 153 days — a 12% lower offer ($70k) is reasonable based on typical stale-listing flexibility.
Risks & watch-outs
- Climate carrying-cost: moderate wildfire risk; extreme-heat days projected 7→22/yr by 2055 (HVAC capex compounding) — expect insurance premiums to compound above CPI over the hold.
Questions for the listing agent
- It's been on market 153 days. Have you received any prior offers? Is the seller open to a 12% concession, seller financing, or rate buy-down credit?
- Built in 1965 — when were the roof, HVAC, electrical panel, plumbing, and water heater last replaced?
- Why hasn't it sold? Are there any deal-killer items the seller is aware of (foundation, flood, title, zoning, code violations)?
- Is there a deadline driving the sale (1031 exchange, divorce, estate, relocation)? That informs how much negotiation room exists.
- Schools are D-rated, which usually means shorter tenancies and higher turnover. Who's the typical renter profile here, and what's been the actual vacancy rate?
- Crime grade is F in this area — have there been break-ins, vandalism, or insurance claims at this property in the last 3 years? What carrier currently insures it and at what premium?
- What's the average days-on-market for RENTAL listings here right now (not sales)? A rising rental-DOM trend means longer vacancies and softer asking-rent achievability than the comps imply.
- What's the recent tenant-quality profile in this submarket — average credit score on applications, eviction rate, late-payment / NSF rate, and stable-employment percentage? A property-management company in the area should have these aggregated.
- How much new for-sale + rental construction is in the pipeline within 1–3 miles? Heavy new supply typically softens prices + rents 12–24 months out; constrained supply supports both.
Investment metrics
- 1% rule
- 1.69% ✓
- Cap rate
- 13.99%
- Cash-on-cash
- 27.51%
- DSCR
- 2.22
- GRM
- 4.9
CMA / ARV
- ARV (on-the-fly)
- $140,650
- Comps found
- 12
Show comp detail 12 sales within ~0.75 mi
| Address | Dist | Beds/Ba | Sqft | Sold | Price | $/sf | Match |
|---|---|---|---|---|---|---|---|
| 1745 E Cherry | 0.13mi | 3/2.0 | 1,569 (+8%) | 2mo | $195,000 | $124 | 74 |
| 2430 Cypress Dr | 0.49mi | 3/1.0 | 1,390 (-4%) | 4mo | $140,000 | $101 | 67 |
| 230 NE 20th | 0.21mi | 2/1.0 (-1) | 1,328 (-8%) | 8mo | $119,500 | $90 | 65 |
| 2465 Highland Rd | 0.40mi | 3/2.0 | 1,566 (+8%) | 2mo | $219,900 | $140 | 62 |
| 2390 Ballard Dr | 0.47mi | 3/1.5 | 1,505 (+4%) | 10mo | $142,000 | $94 | 61 |
| 1347 E Houston St | 0.41mi | 2/2.0 (-1) | 1,542 (+6%) | 2mo | $79,000 | $51 | 60 |
| 2131 Hubbard St | 0.50mi | 2/1.0 (-1) | 1,369 (-6%) | 4mo | $95,000 | $69 | 59 |
| 2252 Cleveland St | 0.61mi | 3/1.5 | 1,508 (+4%) | 10mo | $139,900 | $93 | 54 |
| 2380 Beverly Dr | 0.63mi | 2/2.0 (-1) | 1,400 (-3%) | 3mo | $210,000 | $150 | 53 |
| 910 Van Zandt St | 0.68mi | 3/2.0 | 1,352 (-7%) | 0mo | $174,500 | $129 | 52 |
| 2240 Hubbard | 0.56mi | 3/1.0 | 1,644 (+13%) | 1mo | $159,900 | $97 | 51 |
| 365 24th St SE | 0.61mi | 3/2.0 | 1,278 (-12%) | 8mo | $74,900 | $59 | 41 |
Match score weights: distance 35% · size 25% · config 20% · recency 20%. Top-matched comps best support the ARV.
Projected returns pro-forma
-3.0% appreciation · 3.0% rent growth · sell at horizon
- IRR
- 21.6%
- Equity multiple
- 1.88×
- Total profit
- $19,737
- Equity at exit
- $11,913
- IRR
- 29.7%
- Equity multiple
- 3.65×
- Total profit
- $59,334
- Equity at exit
- $6,908
Cash invested: $22,372 (down + closing). Projections, not guarantees.
Landlord ↔ Tenant lean methodology
- Overall (STATE)
- 87 Strongly Landlord-Friendly
- State Texas
- 87 Strongly Landlord-Friendly · R+5
- County
- — inherits STATE
- City
- — inherits STATE
ZIP-level market 75460
- Active inventory
- 277
- Price-to-rent
- 4.9×
Monthly cashflow live
- Estimated rent
- $1,352 medium interval (Pro) →
- Mortgage (P&I)
- −$419
- Tax from tax record
- −$103 /mo · $1,232/yr
- Insurance
- −$33
- HOA
- −$0
- Vacancy / Maint / Mgmt
- −$284
- Net cashflow
- $513
Break-even live
Sensitivity live
| Price | -10% $558 | -5% $535 | +0% $513 | +5% $490 | +10% $468 |
|---|---|---|---|---|---|
| Rent | -10% $406 | -5% $459 | +0% $513 | +5% $566 | +10% $620 |
| Rate | -1.0pp $553 | -0.5pp $533 | base $513 | +0.5pp $492 | +1.0pp $471 |
UW: 25.0% down · 7.5% · 30yr · 1.5% tax · 5.0% vac · 8.0% maint · 8.0% mgmt
Financing live
Cash to close
- Down payment
- $19,975
- Closing costs
- $2,397
- Reserves months
- —
- Total cash needed
- —
Loan-product check · same deal, 3 products live
Conventional
25% down · 7.5% · 30yr
- Down + closing
- —
- Monthly P&I
- —
- Monthly cashflow
- —
- DSCR
- —
- Eligible?
- —
Personal DTI + credit; lowest rate.
DSCR
20% down · 8.5% · 30yr
- Down + closing
- —
- Monthly P&I
- —
- Monthly cashflow
- —
- DSCR
- —
- Eligible?
- —
No personal income docs; deal must DSCR.
Hard money
10% down · 12.0% · 12mo
- Down + closing
- —
- Monthly P&I
- —
- Monthly cashflow
- —
- DSCR
- —
- Eligible?
- —
Short-term bridge; refi at stabilization.
Rent comps 4 comps
| Address | Beds | Baths | Sqft | Rent | $/sqft | DOM | Units | Dist |
|---|---|---|---|---|---|---|---|---|
| 370 29th St NE Paris, TX | 3.0 | 1.0 | 1220 | $1,200 | $0.98 | 46d | 1 | 0.71mi |
| 2246 Simpson St Paris, TX | 3.0 | 1.0 | 1508 | $1,250 | $0.83 | 46d | 1 | 0.71mi |
| 649 E Price St Paris, TX | 2.0 | 1.0 | 900 | $1,100 | $1.22 | 46d | 1 | 0.81mi |
| 2121 Cedar St Paris, TX | 3.0 | 2.0 | 1394 | $2,000 | $1.43 | 46d | 1 | 1.00mi |
Listing history 22 events
-
2026-06-22days on market $79,900 Active 153 DOM
-
2026-06-21days on market $79,900 Active 152 DOM
-
2026-06-19days on market $79,900 Active 150 DOM
-
2026-06-18days on market $79,900 Active 149 DOM
-
2026-06-17price $79,900 Active 148 DOM
-
2026-06-17days on market $89,900 Active 148 DOM
-
2026-06-16days on market $89,900 Active 147 DOM
-
2026-06-15days on market $89,900 Active 146 DOM
-
2026-06-14days on market $89,900 Active 144 DOM
-
2026-06-12days on market $89,900 Active 143 DOM
-
2026-06-09days on market $89,900 Active 140 DOM
-
2026-06-08days on market $89,900 Active 139 DOM
-
2026-06-07days on market $89,900 Active 138 DOM
-
2026-06-03days on market $89,900 Active 134 DOM
-
2026-06-02days on market $89,900 Active 133 DOM
-
2026-06-01days on market $89,900 Active 132 DOM
-
2026-05-31days on market $89,900 Active 131 DOM
-
2026-05-31days on market $89,900 Active 130 DOM
-
2026-05-11price $89,900
-
2026-04-16price $99,900
-
2026-02-18price $104,900
-
2026-01-19$109,000 Active
ⓘ Source: listings_history table (triggers on properties + properties_extension) + one-shot
backfill from property_details.listing_events for pre-trigger history.
Tax reassessment forecast TX · Resets to sale price
- Current annual tax
- $1,232 · $103/mo
- Projected year-2 tax
- $1,462 · $122/mo
- Expected delta
- +$231/yr (+$19/mo · 18.7%)
ⓘ Screening estimate from a state-policy table — verify with the county assessor before closing.
Climate risk First Street
- Flood 1/10 Low FEMA zone X (unshaded) · 0% chance over 30 yrs
- Wildfire 5/10 Major
- Heat 7/10 Severe 7 d/yr ≥110°F today · 22 d/yr by 30 yrs out
- Wind 4/10 Moderate 23% chance of damaging wind over 30 yrs
- Air quality 2/10 Low 0 unhealthy d/yr today · 1 by 30 yrs out
Nearby sold comps map
Loading sold comps map…
Walkable amenities ~0.75 mi
Loading nearby amenities…
Taxation est. · year 1
- Rental income
- $16,219
- − Mortgage interest
- −$4,476
- − Property taxes
- −$1,232
- − Insurance
- −$400
- − Repairs & maintenance
- −$1,298
- − Management
- −$1,298
- − Depreciation
- −$2,324
- Taxable income
- $5,193
- Est. tax owed @ 24.0%
- −$1,246
- After-tax cash flow
- $4,908/yr
For passive investors: Depreciation is non-cash, so a rental often shows a tax loss while cash-flowing — sheltering income. Rental losses are passive: they offset passive income freely, and up to $25,000/yr can offset ordinary (W-2) income if you actively participate and your MAGI is under $100k (phasing out to $0 by $150k); unused losses carry forward. On sale, claimed depreciation is recaptured at up to 25%, and gains may owe capital-gains tax (a 1031 exchange can defer both). Figures are a year-1 estimate at your 24.0% rate — not tax advice; consult a CPA.
Schools (NCES district)
- District
- Paris ISD
- NCES district ID
- 4834290
- Math proficiency
- 36% ▼ -11.00%
- Reading proficiency
- 37% ▼ -1.00%
- Median HH income
- $31,515
- Composite
- 29.83/100
- National rank
- #6419
- State rank
- #521 of 826 in TX
Livability — Paris
- Score
- 61/100
- State rank
- #984
- US rank
- #17535
Category grades
Schools grade is shown separately in the Schools card above.
Census & demographics
- Census place
- Paris, TX
- County
- Lamar County · 23,426 people
- City population
- 23,426
- Metro
- Paris, TX
- Population (ZIP)
- 23,426
- Household income
- $46,473
- Rent vs Own
- Severe rent burden
- 1355.0
Population outlook (Lamar County) Hauer SSP2
- Today (2025)
- 48,319 people
- By 2030
- 47,160 · -2.4%
- By 2040
- 44,621 · -7.7%
- By 2050
- 42,024 · -13.0%
- By 2075
- 36,577 · -24.3%
- By 2100
- 30,580 · -36.7%
Race, ethnicity, and origin ACS 2023
- Neighborhood character
- Diverse neighborhood (Simpson 0.60)
- Race & ethnicity
- White 58% Black 22% Hispanic / Latino 13% Two or more races 8%
- Hispanic origin (detail)
- Mexican 12%
- Common ancestry
- Lithuanian 1% Slovak 1% Italian 1%
- Foreign-born
- 3% · Canada, China
- Languages at home
- 92% English-only · Spanish 7%
Political lean MEDSL · Lamar
- 2024 margin
- Solid R (+61.0) · D 19.2% · R 80.3%
- 2008→2024 swing
- -19.1pp toward R · 2008: -42.0pp · 2024: -61.0pp
- All cycles
- 2024: R+61.0 2020: R+57.4 2016: R+59.2 2012: R+50.3 2008: R+42.0
Not yet ingested
- Civics
- —
Market trends
- HPI YoY
- ▼ -201.50%
- Current HPI
- 145.3511
- Rent YoY
- —
- Metro
- Paris, TX
- State GDP YoY
- ▲ 3.95%
- F500 in state
- 110
Industry mix (Fortune 500 HQ in TX)
| Industry | F500 HQs | Revenue |
|---|---|---|
| Energy | 16 | $1,198B |
|
||
| Technology | 5 | $198B |
|
||
| Engineering / Construction | 4 | $72B |
|
||
| Energy Services | 3 | $60B |
|
||
| Utilities | 3 | $41B |
|
||
| Healthcare | 2 | $330B |
|
||
Price history
-17.5% since first listed4 events — show timeline
- 2026-05-11 Price Changed $89,900 NTREIS
- 2026-04-16 Price Changed $99,900 NTREIS
- 2026-02-18 Price Changed $104,900 NTREIS
- 2026-01-19 Listed $109,000 NTREIS
Property tax history
+2.9%/yrLatest (2025): $1,232 · +21.5% YoY. Source: county tax records.
Cash-flow waterfall
monthlySold comps — $/sqft
last 12 mo · ≤1 miLoading sold comps…