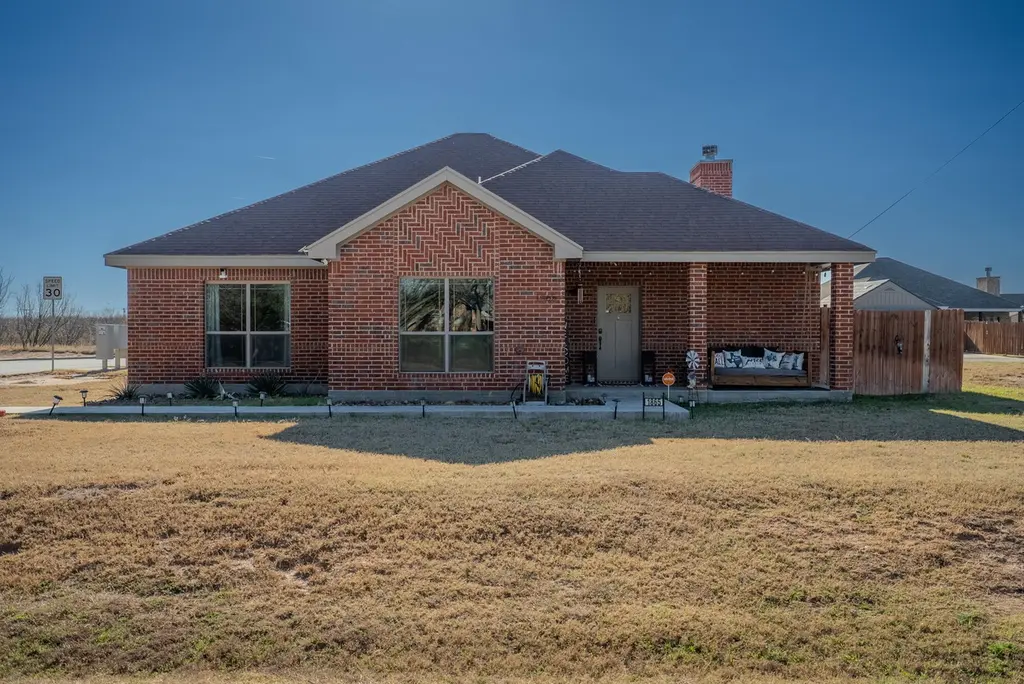
1865 S Concho Dr · San Angelo, TX
Flood risk 6/10 · Moderate
- FEMA flood zone
- X (unshaded)
- Chance of flooding over 30 yrs
- 0.45%
- Est. flood insurance / yr
- $507 – $1,088
Fire risk 7/10 · Major
- Est. fire insurance / yr
- $1,222 – $2,270
Heat risk 7/10 · Major
- Hot days now (above 104°F)
- 7 days/yr
- Hot days in 30 yrs
- 25 days/yr
Wind risk 4/10 · Minor
- Chance of severe wind over 30 yrs
- 17.0%
Air-quality risk 2/10 · Minimal
- Unhealthy air days now
- 0 days/yr
- Unhealthy air days in 30 yrs
- 1 days/yr
Risk factors via First Street. Map © Google.
Why this score? — see what drove the D- grade
The composite is a weighted blend of 9 inputs, each scored 0–100. Each bar is that input's sub-score; the figure is the points it added to the 100-point composite (weight × sub-score).
- Cash flow +11.5/30.0
- ARV discount +6.7/15.0
- 1% rule +4.0/10.0
- Rent growth +4.0/5.0
- Livability +3.7/5.0
- DSCR +3.4/10.0
- Schools +2.6/10.0
- Condition / age +2.5/5.0
- Appreciation +0.0/10.0
$325,000
🖨 Deal sheet 📄 Offer letter ✓ Due diligence
Listing remarks MLS
Awesome location! This 3-bedroom, 2-bath home sits on a desirable corner lot in Lakeshore Estates, directly across the street from beautiful Lake Nasworthy. Enjoy convenient lake access while living in one of San Angelo's most sought-after new neighborhoods. The home features a comfortable layout with plenty of natural light and space to make it your own. The corner lot offers additional yard space and flexibility for outdoor living. Outside, you'll find two storage buildings, providing plenty of room for tools, lake gear, hobbies, or extra storage. A rare bonus for buyers—this property offers an assumable VA loan for qualified buyers with an incredible 2.8% interest rate, creating a unique opportunity to secure a significantly lower rate than most loans available today. Whether you're looking for a primary residence, a weekend lake retreat, or an investment opportunity near the water, this property offers location, value, and a unique financing advantage near Lake Nasworthy.
Key facts
- Lake access
- Corner lot
- Outdoor living
Tags
Neighborhood map
What this means for you Summary
Snapshot
- This is a 3-bed/2.0-bath single-family listed at $325k.
Deal economics
- At list price, monthly cash flow is $-104 ($-1k/yr) — negative.
- To cash-flow at today's rent, offer at most $307k (5.7% below list).
- To meet the 1% rule (rent ≥ 1% of price), the offer needs to be $292k (10.3% below list).
- Recommended offer: $292k (10.3% below list) — sets the bar for 1% rule.
- Cap rate 5.9% vs local median 3.8% in San Angelo — top-decile yield for the area; either an underpriced asset or a hidden risk that comps aren't pricing in. Stress-test before assuming the spread holds.
Location & tenants
- Location reads 73/100 on livability (#199 in TX) — a middle-class / working-renter tenant base. Strengths: cost of living A+, housing A+, health & safety A+; Watch: employment C-, schools F, amenities F.
- San Angelo ISD (urban): math 27% / reading 33% proficiency, ranked #627 of 826 in TX (top 76%) — families likely to look elsewhere, expect single-tenant / working-renter base with shorter leases.
- Market conditions: Rents rising fast (+6.0%/yr); 521 active listings in the ZIP; 2 comparable units currently listed for rent nearby; solid renter incomes; 233 units permitted in Tom Green County in 2024 (0 in 5+ unit buildings).
- This rent runs 43% of the median local income ($82k/yr) — at the standard rent-burdened threshold; future hikes will face affordability resistance.
Forward outlook
- Local home prices are declining (-3.0%/yr); year-one equity from $2k of loan paydown is wiped out by about $10k of value loss. Plan a longer hold.
- Tom Green County population projected at +35% by 2050 — long-run rental-demand tailwind backs the buy-and-hold thesis.
Negotiation context
- It's been on market 63 days — a 6% lower offer ($306k) is reasonable based on typical stale-listing flexibility.
- 2 sale attempts since 6y ago with the ask held roughly flat each time — persistent listings suggest the price (not the market) is what's stuck; bring a comps-based counter.
Risks & watch-outs
- Climate carrying-cost: major flood risk; major wildfire risk; extreme-heat days projected 7→25/yr by 2055 (HVAC capex compounding) — expect insurance premiums to compound above CPI over the hold.
Questions for the listing agent
- What do current leases actually rent for vs. the listed asking? Can we see a recent rent roll and the last 12 months of T-12 income?
- It's been on market 63 days. Have you received any prior offers? Is the seller open to a 10% concession, seller financing, or rate buy-down credit?
- What does the HOA fee cover, when was the last increase, and are there any pending special assessments or reserve-fund shortfalls?
- Why hasn't it sold? Are there any deal-killer items the seller is aware of (foundation, flood, title, zoning, code violations)?
- Is there a deadline driving the sale (1031 exchange, divorce, estate, relocation)? That informs how much negotiation room exists.
- Schools are F-rated, which usually means shorter tenancies and higher turnover. Who's the typical renter profile here, and what's been the actual vacancy rate?
- The area grade is low — what's the realistic commute time and amenity access for the typical tenant pool here? Any planned neighborhood developments (good or bad) we should know about?
- What's the average days-on-market for RENTAL listings here right now (not sales)? A rising rental-DOM trend means longer vacancies and softer asking-rent achievability than the comps imply.
- What's the recent tenant-quality profile in this submarket — average credit score on applications, eviction rate, late-payment / NSF rate, and stable-employment percentage? A property-management company in the area should have these aggregated.
- How much new for-sale + rental construction is in the pipeline within 1–3 miles? Heavy new supply typically softens prices + rents 12–24 months out; constrained supply supports both.
Investment metrics
- 1% rule
- 0.90% ✗
- Cap rate
- 5.91%
- Cash-on-cash
- -1.38%
- DSCR
- 0.94
- GRM
- 9.3
CMA / ARV
- ARV (median comp)
- $319,458
- List price
- $325,000
- Delta
- 1.73%
- Verdict
- FAIR
- Comps
- 20 within 1.0 mi
Show comp detail 12 sales within ~0.75 mi
| Address | Dist | Beds/Ba | Sqft | Sold | Price | $/sf | Match |
|---|---|---|---|---|---|---|---|
| 1902 Case Ave | 0.08mi | 3/2.0 | 1,755 (+0%) | 4mo | $335,000 | $191 | 92 |
| 1905 Chesney Ln | 0.17mi | 3/2.0 | 1,751 (-0%) | 4mo | $314,900 | $180 | 89 |
| 1901 Case Ave | 0.11mi | 4/2.0 (+1) | 1,769 (+1%) | 4mo | $335,000 | $189 | 85 |
| 1902 Lamplighter Ln | 0.03mi | 4/3.0 (+1) | 1,866 (+6%) | 6mo | $346,143 | $186 | 74 |
| 1926 Lamplighter Ln | 0.09mi | 4/3.0 (+1) | 1,881 (+7%) | 3mo | $348,925 | $185 | 72 |
| 1909 S Concho Dr | 0.14mi | 4/3.0 (+1) | 1,866 (+6%) | 2mo | $346,143 | $186 | 72 |
| 1969 S Concho Dr | 0.31mi | 4/3.0 (+1) | 1,866 (+6%) | 2mo | $346,143 | $186 | 64 |
| 1926 Lake Shore Blvd | 0.28mi | 3/2.0 | 1,499 (-14%) | 1mo | $309,900 | $207 | 62 |
| 7413 Easton Ave | 0.31mi | 4/3.0 (+1) | 1,866 (+6%) | 6mo | $346,143 | $186 | 61 |
| 1614 Lake Shore Blvd | 0.20mi | 4/4.0 (+1) | 1,558 (-11%) | 4mo | $285,000 | $183 | 56 |
| 2274 Joy Rd | 0.73mi | 3/2.5 | 1,845 (+5%) | 7mo | $550,000 | $298 | 50 |
| 2218 Joy Rd | 0.64mi | 3/3.0 | 1,559 (-11%) | 5mo | $425,000 | $273 | 43 |
Match score weights: distance 35% · size 25% · config 20% · recency 20%. Top-matched comps best support the ARV.
Projected returns pro-forma
-3.0% appreciation · 6.03% rent growth · sell at horizon
- IRR
- -14.9%
- Equity multiple
- 0.45×
- Total profit
- $-50,008
- Equity at exit
- $48,459
- IRR
- -1.6%
- Equity multiple
- 0.87×
- Total profit
- $-11,534
- Equity at exit
- $28,100
Cash invested: $91,000 (down + closing). Projections, not guarantees.
Landlord ↔ Tenant lean methodology
- Overall (STATE)
- 87 Strongly Landlord-Friendly
- State Texas
- 87 Strongly Landlord-Friendly · R+5
- County
- — inherits STATE
- City
- — inherits STATE
ZIP-level market 76904
- Rents YoY
- 6.0%
- Active inventory
- 521
- Price-to-rent
- 9.3×
Monthly cashflow live
- Estimated rent
- $2,915 medium interval (Pro) →
- Mortgage (P&I)
- −$1,704
- Tax from tax record
- −$559 /mo · $6,713/yr
- Insurance
- −$135
- HOA
- −$8
- Vacancy / Maint / Mgmt
- −$612
- Net cashflow
- $-104
Break-even live
UW: 25.0% down · 7.5% · 30yr · 1.5% tax · 5.0% vac · 8.0% maint · 8.0% mgmt
Financing live
Cash to close
- Down payment
- $81,250
- Closing costs
- $9,750
- Reserves months
- —
- Total cash needed
- —
Loan-product check · same deal, 3 products live
Conventional
25% down · 7.5% · 30yr
- Down + closing
- —
- Monthly P&I
- —
- Monthly cashflow
- —
- DSCR
- —
- Eligible?
- —
Personal DTI + credit; lowest rate.
DSCR
20% down · 8.5% · 30yr
- Down + closing
- —
- Monthly P&I
- —
- Monthly cashflow
- —
- DSCR
- —
- Eligible?
- —
No personal income docs; deal must DSCR.
Hard money
10% down · 12.0% · 12mo
- Down + closing
- —
- Monthly P&I
- —
- Monthly cashflow
- —
- DSCR
- —
- Eligible?
- —
Short-term bridge; refi at stabilization.
Rent comps 2 comps
| Address | Beds | Baths | Sqft | Rent | $/sqft | DOM | Units | Dist |
|---|---|---|---|---|---|---|---|---|
| 2330 Fishermans Rd San Angelo, TX | 3.0 | 2.0 | 1347 | $3,500 | $2.60 | 21d | 1 | 0.99mi |
| 2830 Red Bluff Cir San Angelo, TX | 2.0 | 2.0 | 1600 | $5,300 | $3.31 | 21d | 1 | 1.46mi |
HOA detail
- Monthly dues
- $8 · $96/yr
- Likely covers
- water
Listing history 5 events
-
2026-05-19status Pending 996-char remark
Show marketing remark (996 chars)
Awesome location! This 3-bedroom, 2-bath home sits on a desirable corner lot in Lakeshore Estates, directly across the street from beautiful Lake Nasworthy. Enjoy convenient lake access while living in one of San Angelo's most sought-after new neighborhoods. The home features a comfortable layout with plenty of natural light and space to make it your own. The corner lot offers additional yard space and flexibility for outdoor living. Outside, you'll find two storage buildings, providing plenty of room for tools, lake gear, hobbies, or extra storage. A rare bonus for buyers—this property offers an assumable VA loan for qualified buyers with an incredible 2.8% interest rate, creating a unique opportunity to secure a significantly lower rate than most loans available today. Whether you're looking for a primary residence, a weekend lake retreat, or an investment opportunity near the water, this property offers location, value, and a unique financing advantage near Lake Nasworthy.
-
2026-04-02price $325,000 996-char remark
Show marketing remark (996 chars)
Awesome location! This 3-bedroom, 2-bath home sits on a desirable corner lot in Lakeshore Estates, directly across the street from beautiful Lake Nasworthy. Enjoy convenient lake access while living in one of San Angelo's most sought-after new neighborhoods. The home features a comfortable layout with plenty of natural light and space to make it your own. The corner lot offers additional yard space and flexibility for outdoor living. Outside, you'll find two storage buildings, providing plenty of room for tools, lake gear, hobbies, or extra storage. A rare bonus for buyers—this property offers an assumable VA loan for qualified buyers with an incredible 2.8% interest rate, creating a unique opportunity to secure a significantly lower rate than most loans available today. Whether you're looking for a primary residence, a weekend lake retreat, or an investment opportunity near the water, this property offers location, value, and a unique financing advantage near Lake Nasworthy.
-
2026-03-11$331,000 Active 996-char remark
Show marketing remark (996 chars)
Awesome location! This 3-bedroom, 2-bath home sits on a desirable corner lot in Lakeshore Estates, directly across the street from beautiful Lake Nasworthy. Enjoy convenient lake access while living in one of San Angelo's most sought-after new neighborhoods. The home features a comfortable layout with plenty of natural light and space to make it your own. The corner lot offers additional yard space and flexibility for outdoor living. Outside, you'll find two storage buildings, providing plenty of room for tools, lake gear, hobbies, or extra storage. A rare bonus for buyers—this property offers an assumable VA loan for qualified buyers with an incredible 2.8% interest rate, creating a unique opportunity to secure a significantly lower rate than most loans available today. Whether you're looking for a primary residence, a weekend lake retreat, or an investment opportunity near the water, this property offers location, value, and a unique financing advantage near Lake Nasworthy.
-
2020-12-01soldstatus 530-char remark
Show marketing remark (530 chars)
This quaint neighborhood is nestled behind the hustle and bustle of your daily life. Lakeshore Estates offers something for everyone. YOUR new home is a stones throw away from Lake Park Picnic area which features fantastic fishing and an easy to access boat ramp. In less than 1 1/2 miles you have the Greens of Bentwood Country Club and a short drive to Lamar Elementary & Glenn Middle School. This warm and welcoming community is ready for you with unique homes that are beautifully crafted and landscaped. Large Backyard!
-
2020-10-05$244,524 530-char remark
Show marketing remark (530 chars)
This quaint neighborhood is nestled behind the hustle and bustle of your daily life. Lakeshore Estates offers something for everyone. YOUR new home is a stones throw away from Lake Park Picnic area which features fantastic fishing and an easy to access boat ramp. In less than 1 1/2 miles you have the Greens of Bentwood Country Club and a short drive to Lamar Elementary & Glenn Middle School. This warm and welcoming community is ready for you with unique homes that are beautifully crafted and landscaped. Large Backyard!
ⓘ Source: listings_history table (triggers on properties + properties_extension) + one-shot
backfill from property_details.listing_events for pre-trigger history.
Tax reassessment forecast TX · Resets to sale price
- Current annual tax
- $6,713 · $559/mo
- Projected year-2 tax
- $6,713 · $559/mo
- Expected delta
- $0/yr ($0/mo · 0.0%)
ⓘ Screening estimate from a state-policy table — verify with the county assessor before closing.
Climate risk First Street
- Flood 6/10 Major FEMA zone X (unshaded) · 45% chance over 30 yrs
- Wildfire 7/10 Severe
- Heat 7/10 Severe 7 d/yr ≥104°F today · 25 d/yr by 30 yrs out
- Wind 4/10 Moderate 17% chance of damaging wind over 30 yrs
- Air quality 2/10 Low 0 unhealthy d/yr today · 1 by 30 yrs out
Nearby sold comps map
Loading sold comps map…
Walkable amenities ~0.75 mi
Loading nearby amenities…
Taxation est. · year 1
- Rental income
- $34,980
- − Mortgage interest
- −$18,205
- − Property taxes
- −$6,713
- − Insurance
- −$1,625
- − Repairs & maintenance
- −$2,798
- − Management
- −$2,798
- − HOA
- −$96
- − Depreciation
- −$9,455
- Taxable loss
- −$6,710
- Est. tax savings @ 24.0%
- +$1,610
- After-tax cash flow
- $359/yr
For passive investors: Depreciation is non-cash, so a rental often shows a tax loss while cash-flowing — sheltering income. Rental losses are passive: they offset passive income freely, and up to $25,000/yr can offset ordinary (W-2) income if you actively participate and your MAGI is under $100k (phasing out to $0 by $150k); unused losses carry forward. On sale, claimed depreciation is recaptured at up to 25%, and gains may owe capital-gains tax (a 1031 exchange can defer both). Figures are a year-1 estimate at your 24.0% rate — not tax advice; consult a CPA.
Schools (NCES district)
- District
- San Angelo ISD
- NCES district ID
- 4838700
- Math proficiency
- 27% ▼ -9.00%
- Reading proficiency
- 33% ▼ -3.00%
- Median HH income
- $43,501
- Composite
- 25.56/100
- National rank
- #7427
- State rank
- #627 of 826 in TX
Livability — San Angelo
- Score
- 73/100
- State rank
- #199
- US rank
- #5030
Category grades
Schools grade is shown separately in the Schools card above.
Census & demographics
- Census place
- San Angelo, TX
- County
- Tom Green County · 113,188 people
- City population
- 81,357
- Metro
- San Angelo, TX
- Population (ZIP)
- 36,954
- Household income
- $81,833
- Rent vs Own
- Severe rent burden
- 778.0
Population outlook (Tom Green County) Hauer SSP2
- Today (2025)
- 135,110 people
- By 2030
- 144,090 · +6.6%
- By 2040
- 162,561 · +20.3%
- By 2050
- 182,158 · +34.8%
- By 2075
- 232,274 · +71.9%
- By 2100
- 268,218 · +98.5%
Race, ethnicity, and origin ACS 2023
- Neighborhood character
- Majority White (60%)
- Race & ethnicity
- White 60% Hispanic / Latino 30% Two or more races 17% Black 4% Asian 3%
- Hispanic origin (detail)
- Mexican 26%
- Common ancestry
- Slovak 2% Lithuanian 2% Italian 1%
- Foreign-born
- 5% · Canada
- Languages at home
- 82% English-only · Spanish 15% Tagalog/Filipino 1%
Political lean MEDSL · Tom Green
- 2024 margin
- Solid R (+48.0) · D 25.5% · R 73.5% · Other 1.0%
- 2008→2024 swing
- -6.3pp toward R · 2008: -41.7pp · 2024: -48.0pp
- All cycles
- 2024: R+48.0 2020: R+44.4 2016: R+47.9 2012: R+47.9 2008: R+41.7
Not yet ingested
- Civics
- —
Market trends
- HPI YoY
- ▼ -299.76%
- Current HPI
- 176.0366
- Rent YoY
- ▲ 6.03%
- Metro
- San Angelo, TX
- State GDP YoY
- ▲ 3.95%
- F500 in state
- 110
Industry mix (Fortune 500 HQ in TX)
| Industry | F500 HQs | Revenue |
|---|---|---|
| Energy | 16 | $1,198B |
|
||
| Technology | 5 | $198B |
|
||
| Engineering / Construction | 4 | $72B |
|
||
| Energy Services | 3 | $60B |
|
||
| Utilities | 3 | $41B |
|
||
| Healthcare | 2 | $330B |
|
||
Price history
+32.9% since first listed5 events — show timeline
- 2026-05-19 Pending — SAAR TX
- 2026-04-02 Price Changed $325,000 SAAR TX
- 2026-03-11 Listed $331,000 SAAR TX
- 2020-12-01 Sold (MLS) — SAAR TX
- 2020-10-05 Listed $244,524 SAAR TX
Property tax history
+49.1%/yrLatest (2025): $6,713 · +20.2% YoY. Source: county tax records.
Cash-flow waterfall
monthlySold comps — $/sqft
last 12 mo · ≤1 miLoading sold comps…