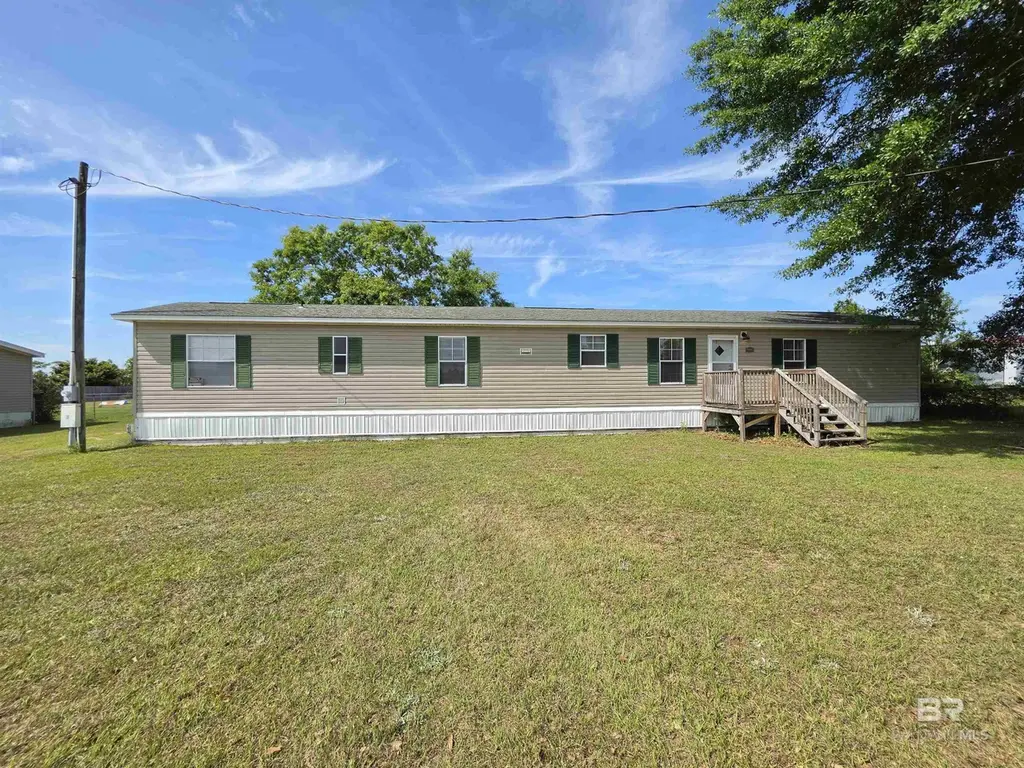
33163 Gilley Rd · Lillian, AL
Flood risk 1/10 · Minimal
- FEMA flood zone
- X (unshaded)
- Chance of flooding over 30 yrs
- 0.0%
- Est. flood insurance / yr
- $507 – $1,088
Fire risk 4/10 · Minor
- Est. fire insurance / yr
- $916 – $1,700
Heat risk 10/10 · Severe
- Hot days now (above 105°F)
- 7 days/yr
- Hot days in 30 yrs
- 23 days/yr
Wind risk 9/10 · Severe
- Chance of severe wind over 30 yrs
- 99.0%
Air-quality risk 1/10 · Minimal
- Unhealthy air days now
- 0 days/yr
- Unhealthy air days in 30 yrs
- 0 days/yr
Risk factors via First Street. Map © Google.
Why this score? — see what drove the D+ grade
The composite is a weighted blend of 9 inputs, each scored 0–100. Each bar is that input's sub-score; the figure is the points it added to the 100-point composite (weight × sub-score).
- Cash flow +22.6/30.0
- DSCR +7.3/10.0
- 1% rule +5.9/10.0
- Schools +3.9/10.0
- Livability +3.3/5.0
- Rent growth +2.5/5.0
- Condition / age +2.5/5.0
- ARV discount +0.4/15.0
- Appreciation +0.0/10.0
$175,000
🖨 Deal sheet (PDF) 📄 Offer letter ✓ Due diligence
Listing remarks
This well-maintained 3-bedroom, 2-bath home sits on almost one acre, offering plenty of space to enjoy peaceful country living. The property features a large open yard with mature trees, room for outdoor entertaining, gardening, pets, or parking your boat, RV, or trailers. NO HOA. Inside, you will find a spacious kitchen with abundant cabinet and counter space, and an open layout that flows easily into the main living areas. The split-bedroom floor plan offers privacy. If you are looking for more land and privacy, this property offers a great combination of indoor comfort and outdoor space. Enjoy quiet surroundings, wide-open views, and room to make it your own. Buyer to verify all informa
Key facts
- Outdoor entertaining
- Open yard
- Wide-open views
Tags
Property features AI
Finance
- Other: Property listing handled by Coastal Luxe Realty Group
- HOA & community: No transfer fees; No community amenities
Exterior
- Utilities: Well water; Septic tank; Electric service: Baldwin EMC
- Home design: One story; Resale property
- Construction: Vinyl siding; Metal roof; Other foundation; Built area recorded as 1216 (assessor)
- Exterior features: Rear porch; Less than 1 acre lot; No waterfront; Whole/Full ownership
Interior
- Kitchen: Dishwasher; Disposal; Electric range; Refrigerator
- Flooring: Carpet; Tile
- Bathrooms: 2 full bathrooms
- Heating & cooling: Central heating; Central electric cooling
- Interior features: Ceiling fan(s); No fireplace
Neighborhood map
What this means for you Summary
Snapshot
- This is a 3-bed/2.0-bath manufactured listed at $175k.
Deal economics
- At list price, monthly cash flow is $298 ($4k/yr) — positive.
- The deal already cash-flows at list — no discount required.
- Meets the 1% rule at list price ($2k rent vs $175k).
- Cap rate 8.3% vs local median 4.2% in Lillian — top-decile yield for the area; either an underpriced asset or a hidden risk that comps aren't pricing in. Stress-test before assuming the spread holds.
Location & tenants
- Location reads 66/100 on livability (#97 in AL) — a middle-class / working-renter tenant base. Strengths: crime A+, housing A+, cost of living A-; Watch: amenities F, commute F, health & safety F.
- Baldwin County (rural): math 33% / reading 57% proficiency, ranked #18 of 129 in AL (top 14%) — families likely to look elsewhere, expect single-tenant / working-renter base with shorter leases.
- Zoned schools: Elberta Elementary School (math 47% / reading 65%, grade C+, #83 of 627 statewide, top 13%, 884 students, 58% FRL); Elberta Middle School (math 21% / reading 67%, grade D, #42 of 257 statewide, top 17%, 267 students, 63% FRL); Elberta High School (math 32% / reading 37%, grade F, #47 of 305 statewide, top 17%, 784 students, 60% FRL) — zoned schools average 60% FRL vs 38% district-wide (22 pts higher); higher-poverty schools than district average — tighter screening recommended.
- Market conditions: 154 active listings in the ZIP; 3,883 units permitted in Baldwin County in 2024 (481 in 5+ unit buildings).
Forward outlook
- Local home prices are declining (-3.0%/yr); year-one equity from $1k of loan paydown is wiped out by about $5k of value loss. Plan a longer hold.
- Baldwin County population projected at +42% by 2050 — long-run rental-demand tailwind backs the buy-and-hold thesis.
Negotiation context
- Only 8 days on market — expect competitive offers; lowballing is unlikely to land.
- 2 sale attempts with the ask held roughly flat each time — persistent listings suggest the price (not the market) is what's stuck; bring a comps-based counter.
- Current owner paid $34k; list at $175k implies a 422% gain — meaningful room to come down on a strong offer.
Risks & watch-outs
- Climate carrying-cost: severe wind risk, 99% chance of damaging wind over 30y; extreme-heat days projected 7→23/yr by 2055 (HVAC capex compounding) — expect insurance premiums to compound above CPI over the hold.
Questions for the listing agent
- Is there a deadline driving the sale (1031 exchange, divorce, estate, relocation)? That informs how much negotiation room exists.
- The area grade is low — what's the realistic commute time and amenity access for the typical tenant pool here? Any planned neighborhood developments (good or bad) we should know about?
- What's the average days-on-market for RENTAL listings here right now (not sales)? A rising rental-DOM trend means longer vacancies and softer asking-rent achievability than the comps imply.
- What's the recent tenant-quality profile in this submarket — average credit score on applications, eviction rate, late-payment / NSF rate, and stable-employment percentage? A property-management company in the area should have these aggregated.
- How much new for-sale + rental construction is in the pipeline within 1–3 miles? Heavy new supply typically softens prices + rents 12–24 months out; constrained supply supports both.
Investment metrics
- 1% rule
- 1.09% ✓
- Cap rate
- 8.34%
- Cash-on-cash
- 7.31%
- DSCR
- 1.33
- GRM
- 7.6
CMA / ARV
- ARV (median comp)
- $151,154
- List price
- $175,000
- Delta
- 15.78%
- Verdict
- OVERPRICED
- Comps
- 4 within 1.0 mi
Show comp detail 1 sale within ~0.75 mi
| Address | Dist | Beds/Ba | Sqft | Sold | Price | $/sf | Match |
|---|---|---|---|---|---|---|---|
| 33118 Gilley Rd | 0.06mi | 3/2.0 | 1,216 (0%) | 13mo | $155,000 | $127 | 86 |
Match score weights: distance 35% · size 25% · config 20% · recency 20%. Top-matched comps best support the ARV.
Projected returns pro-forma
-3.0% appreciation · 3.0% rent growth · sell at horizon
- IRR
- -5.1%
- Equity multiple
- 0.81×
- Total profit
- $-9,322
- Equity at exit
- $26,093
- IRR
- 4.6%
- Equity multiple
- 1.34×
- Total profit
- $16,474
- Equity at exit
- $15,131
Cash invested: $49,000 (down + closing). Projections, not guarantees.
Landlord ↔ Tenant lean methodology
- Overall (STATE)
- 90 Strongly Landlord-Friendly
- State Alabama
- 90 Strongly Landlord-Friendly · R+15
- County
- — inherits STATE
- City
- — inherits STATE
ZIP-level market 36549
- Home prices YoY
- -7.6%
- Active inventory
- 154
- Price-to-rent
- 7.6×
Monthly cashflow live
- Estimated rent
- $1,909 medium interval (Pro) →
- Mortgage (P&I)
- −$918
- Tax est. 1.5%
- −$219 /mo · $2,625/yr
- Insurance
- −$73
- HOA
- −$0
- Vacancy / Maint / Mgmt
- −$401
- Net cashflow
- $298
Break-even live
Sensitivity live
| Price | -10% $419 | -5% $359 | +0% $298 | +5% $238 | +10% $177 |
|---|---|---|---|---|---|
| Rent | -10% $148 | -5% $223 | +0% $298 | +5% $374 | +10% $449 |
| Rate | -1.0pp $387 | -0.5pp $343 | base $298 | +0.5pp $253 | +1.0pp $207 |
UW: 25.0% down · 7.5% · 30yr · 1.5% tax · 5.0% vac · 8.0% maint · 8.0% mgmt
Financing live
Cash to close
- Down payment
- $43,750
- Closing costs
- $5,250
- Reserves months
- —
- Total cash needed
- —
Loan-product check · same deal, 3 products live
Conventional
25% down · 7.5% · 30yr
- Down + closing
- —
- Monthly P&I
- —
- Monthly cashflow
- —
- DSCR
- —
- Eligible?
- —
Personal DTI + credit; lowest rate.
DSCR
20% down · 8.5% · 30yr
- Down + closing
- —
- Monthly P&I
- —
- Monthly cashflow
- —
- DSCR
- —
- Eligible?
- —
No personal income docs; deal must DSCR.
Hard money
10% down · 12.0% · 12mo
- Down + closing
- —
- Monthly P&I
- —
- Monthly cashflow
- —
- DSCR
- —
- Eligible?
- —
Short-term bridge; refi at stabilization.
Listing history 19 events
-
2026-06-21days on market $175,000 Active 8 DOM
-
2026-06-19days on market $175,000 Active 6 DOM
-
2026-06-18days on market $175,000 Active 5 DOM
-
2026-06-17days on market $175,000 Active 4 DOM
-
2026-06-16days on market $175,000 Active 3 DOM
-
2026-06-15days on market $175,000 Active 2 DOM
-
2026-06-14days on market $175,000 Active 1 DOM
-
2026-06-10days on market $175,000 Active 49 DOM
-
2026-06-09days on market $175,000 Active 48 DOM
-
2026-06-08days on market $175,000 Active 47 DOM
-
2026-06-07days on market $175,000 Active 46 DOM
-
2026-06-05days on market $175,000 Active 43 DOM
-
2026-06-03days on market $175,000 Active 42 DOM
-
2026-06-02days on market $175,000 Active 41 DOM
-
2026-06-01days on market $175,000 Active 40 DOM
-
2026-05-31days on market $175,000 Active 39 DOM
-
2026-05-30days on market $175,000 Active 38 DOM
-
2026-04-22$175,000 Active 776-char remark
-
2006-12-06soldstatus $33,500
ⓘ Source: listings_history table (triggers on properties + properties_extension) + one-shot
backfill from property_details.listing_events for pre-trigger history.
Climate risk First Street
- Flood 1/10 Low FEMA zone X (unshaded) · 0% chance over 30 yrs
- Wildfire 4/10 Moderate
- Heat 10/10 Extreme 7 d/yr ≥105°F today · 23 d/yr by 30 yrs out
- Wind 9/10 Extreme 99% chance of damaging wind over 30 yrs
- Air quality 1/10 Low 0 unhealthy d/yr today · 0 by 30 yrs out
Nearby sold comps map
Loading sold comps map…
Walkable amenities ~0.75 mi
Loading nearby amenities…
Taxation est. · year 1
- Rental income
- $22,903
- − Mortgage interest
- −$9,803
- − Property taxes
- −$2,625
- − Insurance
- −$875
- − Repairs & maintenance
- −$1,832
- − Management
- −$1,832
- − Depreciation
- −$5,091
- Taxable income
- $845
- Est. tax owed @ 24.0%
- −$203
- After-tax cash flow
- $3,378/yr
For passive investors: Depreciation is non-cash, so a rental often shows a tax loss while cash-flowing — sheltering income. Rental losses are passive: they offset passive income freely, and up to $25,000/yr can offset ordinary (W-2) income if you actively participate and your MAGI is under $100k (phasing out to $0 by $150k); unused losses carry forward. On sale, claimed depreciation is recaptured at up to 25%, and gains may owe capital-gains tax (a 1031 exchange can defer both). Figures are a year-1 estimate at your 24.0% rate — not tax advice; consult a CPA.
Schools (NCES district)
- District
- Baldwin County
- NCES district ID
- 0100270
- Math proficiency
- 33% ▼ -26.00%
- Reading proficiency
- 57% ▲ 1.00%
- Median HH income
- $50,677
- Composite
- 38.61/100
- National rank
- #4157
- State rank
- #18 of 129 in AL
Livability — Lillian
- Score
- 66/100
- State rank
- #97
- US rank
- #11371
Category grades
Schools grade is shown separately in the Schools card above.
Census & demographics
- City population
- 6,152
- Population (ZIP)
- 6,152
Population outlook (Baldwin County) Hauer SSP2
- Today (2025)
- 248,264 people
- By 2030
- 270,315 · +8.9%
- By 2040
- 312,967 · +26.1%
- By 2050
- 352,262 · +41.9%
- By 2075
- 438,841 · +76.8%
- By 2100
- 487,736 · +96.5%
Race, ethnicity, and origin ACS 2023
- Neighborhood character
- Predominantly White (92%)
- Race & ethnicity
- White 92% Two or more races 5% Hispanic / Latino 4%
- Common ancestry
- Lithuanian 7% Italian 3% Serbian 2%
- Foreign-born
- 2% · Canada
- Languages at home
- 96% English-only · Spanish 3%
Political lean MEDSL · Baldwin
- 2024 margin
- Solid R (+58.2) · D 20.5% · R 78.7%
- 2008→2024 swing
- -6.7pp toward R · 2008: -51.5pp · 2024: -58.2pp
- All cycles
- 2024: R+58.2 2020: R+53.8 2016: R+57.8 2012: R+55.8 2008: R+51.5
Not yet ingested
- Civics
- —
Market trends
- HPI YoY
- ▼ -23.45%
- Current HPI
- 285.5902
- Rent YoY
- —
- Metro
- —
- State GDP YoY
- ▲ 2.94%
- F500 in state
- 4
Industry mix (Fortune 500 HQ in AL)
| Industry | F500 HQs | Revenue |
|---|---|---|
| Financial Services | 1 | $8B |
|
||
| Healthcare | 1 | $5B |
|
||
Price history
+422.4% since first listed4 events — show timeline
- 2026-06-12 Delisted — BCAR
- 2026-06-12 Listed $175,000 BCAR
- 2026-04-22 Listed $175,000 BCAR
- 2006-12-06 Sold (Public Records) $33,500 Public Records
Property tax history
+4.8%/yrLatest (2025): $267 · +49.2% YoY. Source: county tax records.
Cash-flow waterfall
monthlySold comps — $/sqft
last 12 mo · ≤1 miLoading sold comps…