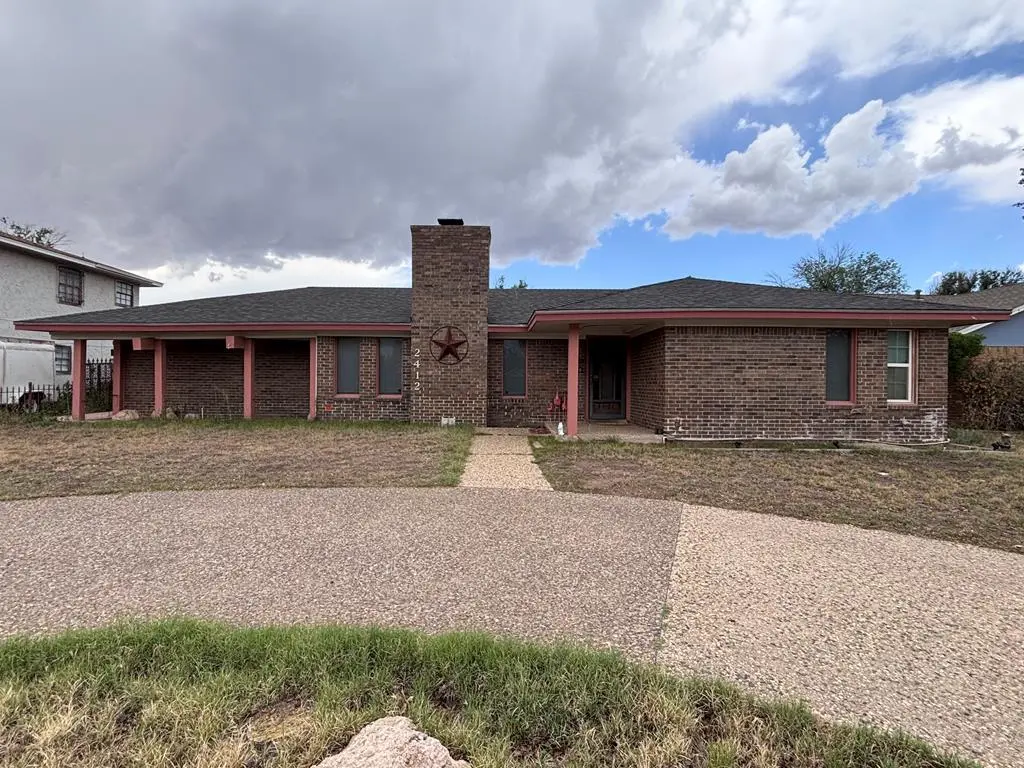
2412 Northtown Ct · Midland, TX
Flood risk 1/10 · Minimal
- FEMA flood zone
- X
- Chance of flooding over 30 yrs
- 0.0%
- Est. flood insurance / yr
- $507 – $1,088
Fire risk 7/10 · Major
- Est. fire insurance / yr
- $1,222 – $2,270
Heat risk 6/10 · Moderate
- Hot days now (above 102°F)
- 7 days/yr
- Hot days in 30 yrs
- 22 days/yr
Wind risk 2/10 · Minimal
- Chance of severe wind over 30 yrs
- 3.0%
Air-quality risk 1/10 · Minimal
- Unhealthy air days now
- 0 days/yr
- Unhealthy air days in 30 yrs
- 0 days/yr
Risk factors via First Street. Map © Google.
Why this score? — see what drove the D grade
The composite is a weighted blend of 9 inputs, each scored 0–100. Each bar is that input's sub-score; the figure is the points it added to the 100-point composite (weight × sub-score).
- Cash flow +14.3/30.0
- ARV discount +7.5/15.0
- DSCR +4.3/10.0
- 1% rule +4.0/10.0
- Livability +4.0/5.0
- Schools +3.2/10.0
- Rent growth +3.1/5.0
- Condition / age +2.5/5.0
- Appreciation +0.0/10.0
$297,000
🖨 Deal sheet (PDF) 📄 Offer letter ✓ Due diligence
Listing remarks MLS
Warm & inviting home full of charm! Featuring 2 spacious living areas, 3 large bedrooms and a very cozy feel throughout. Situated on a large lot with a circle drive and low-maintenance turf in the backyard, perfect for relaxing or entertaining. Recent roof replacement within the last 3 years adds peace of mind. Conveniently located near restaurants, shopping and schools. This home offers comfort, space and convenience all in one!
Key facts
- Low-maintenance turf
- Circle drive
- Large lot
Tags
Property features AI
Exterior
- Parking: Attached 2-car garage with garage door opener; Circular driveway; Additional open parking (total 2 parking spaces)
- Utilities: Public water; Public sewer; Propane service
- Home design: Single-family residence; Residential property
- Construction: Brick veneer construction; Composition roof; Slab foundation; Built in 2026
- Exterior features: Cul-de-sac lot; Paved road access; Solar panels
Interior
- Kitchen: Electric cooktop; Oven; Gas water heater
- Flooring: Carpet; Tile
- Bathrooms: 2 full bathrooms
- Heating & cooling: Central heating; Central air conditioning
- Interior features: Blinds on windows; Living room fireplace
Neighborhood map
What this means for you Summary
Snapshot
- This is a 3-bed/2.0-bath single-family listed at $297k.
Deal economics
- At list price, monthly cash flow is $53 ($638/yr) — positive.
- The deal already cash-flows at list — no discount required.
- To meet the 1% rule (rent ≥ 1% of price), the offer needs to be $268k (9.7% below list).
- Recommended offer: $268k (9.7% below list) — sets the bar for 1% rule.
- Cap rate 6.5% vs local median 4.7% in Midland — top-decile yield for the area; either an underpriced asset or a hidden risk that comps aren't pricing in. Stress-test before assuming the spread holds.
Location & tenants
- Location reads 79/100 on livability (#57 in TX, #2,192 nationally) — a middle-class / working-renter tenant base. Strengths: employment A+, housing A+, health & safety A+; Watch: crime C-, commute D+, amenities D.
- Midland ISD (urban): math 34% / reading 36% proficiency, ranked #477 of 826 in TX (top 58%) — families likely to look elsewhere, expect single-tenant / working-renter base with shorter leases.
- Zoned schools: Emerson El (math 52% / reading 54%, grade C, #705 of 4,322 statewide, top 17%, 489 students, 51% FRL); Goddard J H (math 23% / reading 32%, grade F, #1,156 of 1,662 statewide, top 71%, 1,024 students, 58% FRL, charter); Midland H S (math 37% / reading 7%, grade F, #1,366 of 1,632 statewide, top 84%, 2,492 students, 44% FRL) — zoned schools at 51% FRL track the district average.
- Market conditions: Rents rising (+2.6%/yr); 452 active listings in the ZIP; 28 comparable units currently listed for rent nearby; rentals at typical pace (median 23d on market — plan ~3-4 weeks tenant-placement turnaround); solid renter incomes; 1,504 units permitted in Midland County in 2024 (0 in 5+ unit buildings).
- This rent runs 31% of the median local income ($105k/yr) — at the standard rent-burdened threshold; future hikes will face affordability resistance.
Forward outlook
- Local home prices are declining (-3.0%/yr); year-one equity from $2k of loan paydown is wiped out by about $9k of value loss. Plan a longer hold.
- Midland County population projected at +83% by 2050 — long-run rental-demand tailwind backs the buy-and-hold thesis.
Negotiation context
- Only 7 days on market — expect competitive offers; lowballing is unlikely to land.
- 2 sale attempts with the ask held roughly flat each time — persistent listings suggest the price (not the market) is what's stuck; bring a comps-based counter.
Risks & watch-outs
- Climate carrying-cost: major wildfire risk; extreme-heat days projected 7→22/yr by 2055 (HVAC capex compounding) — expect insurance premiums to compound above CPI over the hold.
Questions for the listing agent
- Built in 1976 — when were the roof, HVAC, electrical panel, plumbing, and water heater last replaced?
- Is there a deadline driving the sale (1031 exchange, divorce, estate, relocation)? That informs how much negotiation room exists.
- The area grade is low — what's the realistic commute time and amenity access for the typical tenant pool here? Any planned neighborhood developments (good or bad) we should know about?
- What's the average days-on-market for RENTAL listings here right now (not sales)? A rising rental-DOM trend means longer vacancies and softer asking-rent achievability than the comps imply.
- What's the recent tenant-quality profile in this submarket — average credit score on applications, eviction rate, late-payment / NSF rate, and stable-employment percentage? A property-management company in the area should have these aggregated.
- How much new for-sale + rental construction is in the pipeline within 1–3 miles? Heavy new supply typically softens prices + rents 12–24 months out; constrained supply supports both.
Investment metrics
- 1% rule
- 0.90% ✗
- Cap rate
- 6.51%
- Cash-on-cash
- 0.77%
- DSCR
- 1.03
- GRM
- 9.2
CMA / ARV
No comps found within radius.
Projected returns pro-forma
-3.0% appreciation · 2.56% rent growth · sell at horizon
- IRR
- -15.6%
- Equity multiple
- 0.45×
- Total profit
- $-45,872
- Equity at exit
- $44,284
- IRR
- -7.8%
- Equity multiple
- 0.52×
- Total profit
- $-40,192
- Equity at exit
- $25,679
Cash invested: $83,160 (down + closing). Projections, not guarantees.
Landlord ↔ Tenant lean methodology
- Overall (STATE)
- 87 Strongly Landlord-Friendly
- State Texas
- 87 Strongly Landlord-Friendly · R+5
- County
- — inherits STATE
- City
- — inherits STATE
ZIP-level market 79705
- Rents YoY
- 2.6%
- Active inventory
- 452
- Price-to-rent
- 9.2×
Monthly cashflow live
- Estimated rent
- $2,683 high interval (Pro) →
- Mortgage (P&I)
- −$1,558
- Tax from tax record
- −$385 /mo · $4,624/yr
- Insurance
- −$124
- HOA
- −$0
- Vacancy / Maint / Mgmt
- −$563
- Net cashflow
- $53
Break-even live
Sensitivity live
| Price | -10% $221 | -5% $137 | +0% $53 | +5% $-31 | +10% $-115 |
|---|---|---|---|---|---|
| Rent | -10% $-159 | -5% $-53 | +0% $53 | +5% $159 | +10% $265 |
| Rate | -1.0pp $203 | -0.5pp $129 | base $53 | +0.5pp $-24 | +1.0pp $-102 |
UW: 25.0% down · 7.5% · 30yr · 1.5% tax · 5.0% vac · 8.0% maint · 8.0% mgmt
Financing live
Cash to close
- Down payment
- $74,250
- Closing costs
- $8,910
- Reserves months
- —
- Total cash needed
- —
Loan-product check · same deal, 3 products live
Conventional
25% down · 7.5% · 30yr
- Down + closing
- —
- Monthly P&I
- —
- Monthly cashflow
- —
- DSCR
- —
- Eligible?
- —
Personal DTI + credit; lowest rate.
DSCR
20% down · 8.5% · 30yr
- Down + closing
- —
- Monthly P&I
- —
- Monthly cashflow
- —
- DSCR
- —
- Eligible?
- —
No personal income docs; deal must DSCR.
Hard money
10% down · 12.0% · 12mo
- Down + closing
- —
- Monthly P&I
- —
- Monthly cashflow
- —
- DSCR
- —
- Eligible?
- —
Short-term bridge; refi at stabilization.
Rent comps 28 comps
| Address | Beds | Baths | Sqft | Rent | $/sqft | DOM | Units | Dist |
|---|---|---|---|---|---|---|---|---|
| 2404 Northtown Ct Midland, TX | 3.0 | 2.0 | 1994 | $2,700 | $1.35 | 15d | 1 | 0.06mi |
| 2404 Goddard Ct Midland, TX | 3.0 | 2.0 | 1894 | $3,100 | $1.64 | 23d | 1 | 0.07mi |
| 2615 Haynes Ave Unit B Midland, TX | 3.0 | 2.0 | 1635 | $1,950 | $1.19 | 15d | 1 | 0.32mi |
| 2801 Exeter Ave Midland, TX | 4.0 | 2.5 | 2394 | $2,900 | $1.21 | 45d | 1 | 0.33mi |
| 4601 Lanham St #11 Midland, TX | 3.0 | 2.5 | 1420 | $2,500 | $1.76 | 23d | 1 | 0.47mi |
| 2900 Goddard Pl Midland, TX | 4.0 | 3.0 | 2570 | $3,400 | $1.32 | 15d | 1 | 0.55mi |
| 2900 Goddard Pl Midland, TX | 4.0 | 3.0 | 2570 | $3,400 | $1.32 | 23d | 1 | 0.55mi |
| 2818 West Loop 250 N Midland, TX | 1.0–3.0 | 1.0–2.0 | 1176 | $2,268 | $1.93 | 15d | 16 | 0.64mi |
| 4801 Whitman Dr Midland, TX | 4.0 | 2.5 | 2158 | $2,800 | $1.30 | 23d | 1 | 0.65mi |
| 4801 Whitman Dr Midland, TX | 4.0 | 2.5 | 2158 | $3,000 | $1.39 | 45d | 1 | 0.65mi |
| 4801 Whitman Dr Midland, TX | 4.0 | 2.5 | 2158 | $2,800 | $1.30 | 15d | 1 | 0.65mi |
| 3134 Tealwood Pl Midland, TX | 3.0 | 2.0 | 1974 | $2,500 | $1.27 | 23d | 1 | 0.66mi |
| 2603 W Wadley Ave Midland, TX | 3.0 | 2.0 | 1600 | $1,900 | $1.19 | 23d | 1 | 0.69mi |
| 2100 W Wadley Ave Unit L1 Midland, TX | 3.0 | 3.0 | 1854 | $2,300 | $1.24 | 45d | 1 | 0.71mi |
| 2606 Keswick Cv Midland, TX | 3.0 | 2.5 | 2027 | $2,600 | $1.28 | 15d | 1 | 0.71mi |
| 1800 Dukes Dr Midland, TX | 3.0 | 2.5 | 2282 | $3,000 | $1.31 | 23d | 1 | 0.75mi |
| 3300 Durant Dr Midland, TX | 3.0 | 3.5 | 2982 | $4,400 | $1.48 | 45d | 1 | 0.76mi |
| 3300 Durant Dr Midland, TX | 4.0 | 3.5 | 2982 | $3,650 | $1.22 | 15d | 1 | 0.76mi |
| 11 Marchelle Ct Midland, TX | 4.0 | 2.0 | 2714 | $3,200 | $1.18 | 45d | 1 | 0.85mi |
| 4715 Bishops Castle Dr Midland, TX | 4.0 | 2.0 | 1938 | $2,900 | $1.50 | 23d | 1 | 0.86mi |
| 3209 W Wadley Ave Unit A Midland, TX | 3.0 | 2.0 | 1512 | $2,500 | $1.65 | 45d | 1 | 0.90mi |
| 3317 Providence Dr Midland, TX | 3.0 | 2.0 | 1810 | $2,500 | $1.38 | 45d | 1 | 1.02mi |
| 1413 Ventura Ave Midland, TX | 3.0 | 2.0 | 2400 | $2,895 | $1.21 | 45d | 1 | 1.32mi |
| 3302 Fannin Ave Midland, TX | 3.0 | 2.0 | 1533 | $2,000 | $1.30 | 23d | 1 | 1.32mi |
| 3326 W Dengar Ave Midland, TX | 4.0 | 3.0 | 2000 | $2,500 | $1.25 | 23d | 1 | 1.37mi |
| 2218 N H St Midland, TX | 2.0 | 3.0 | 2272 | $3,500 | $1.54 | 45d | 1 | 1.37mi |
| 3315 Godfrey St Midland, TX | 1.0–3.0 | 1.5–4.0 | 1764 | $2,800 | $1.59 | 15d | 8 | 1.45mi |
| 4027 Angelina Dr Midland, TX | 3.0 | 2.0 | 2228 | $2,900 | $1.30 | 15d | 1 | 1.49mi |
Listing history 5 events
-
2026-05-30days on market $297,000 Active 7 DOM
-
2026-05-23$297,000 Active
Show marketing remark (439 chars)
Warm & inviting home full of charm! Featuring 2 spacious living areas, 3 large bedrooms and a very cozy feel throughout. Situated on a large lot with a circle drive and low-maintenance turf in the backyard, perfect for relaxing or entertaining. Recent roof replacement within the last 3 years adds peace of mind. Conveniently located near restaurants, shopping and schools. This home offers comfort, space and convenience all in one!
-
2026-05-23$297,000 Active 439-char remark
Show marketing remark (439 chars)
Warm & inviting home full of charm! Featuring 2 spacious living areas, 3 large bedrooms and a very cozy feel throughout. Situated on a large lot with a circle drive and low-maintenance turf in the backyard, perfect for relaxing or entertaining. Recent roof replacement within the last 3 years adds peace of mind. Conveniently located near restaurants, shopping and schools. This home offers comfort, space and convenience all in one!
-
2018-11-21soldstatus
-
1991-12-31soldstatus
ⓘ Source: listings_history table (triggers on properties + properties_extension) + one-shot
backfill from property_details.listing_events for pre-trigger history.
Tax reassessment forecast TX · Resets to sale price
- Current annual tax
- $4,624 · $385/mo
- Projected year-2 tax
- $5,435 · $453/mo
- Expected delta
- +$811/yr (+$68/mo · 17.6%)
ⓘ Screening estimate from a state-policy table — verify with the county assessor before closing.
Climate risk First Street
- Flood 1/10 Low FEMA zone X · 0% chance over 30 yrs
- Wildfire 7/10 Severe
- Heat 6/10 Major 7 d/yr ≥102°F today · 22 d/yr by 30 yrs out
- Wind 2/10 Low 3% chance of damaging wind over 30 yrs
- Air quality 1/10 Low 0 unhealthy d/yr today · 0 by 30 yrs out
Nearby sold comps map
Loading sold comps map…
Walkable amenities ~0.75 mi
Loading nearby amenities…
Taxation est. · year 1
- Rental income
- $32,199
- − Mortgage interest
- −$16,637
- − Property taxes
- −$4,624
- − Insurance
- −$1,485
- − Repairs & maintenance
- −$2,576
- − Management
- −$2,576
- − Depreciation
- −$8,640
- Taxable loss
- −$4,338
- Est. tax savings @ 24.0%
- +$1,041
- After-tax cash flow
- $1,680/yr
For passive investors: Depreciation is non-cash, so a rental often shows a tax loss while cash-flowing — sheltering income. Rental losses are passive: they offset passive income freely, and up to $25,000/yr can offset ordinary (W-2) income if you actively participate and your MAGI is under $100k (phasing out to $0 by $150k); unused losses carry forward. On sale, claimed depreciation is recaptured at up to 25%, and gains may owe capital-gains tax (a 1031 exchange can defer both). Figures are a year-1 estimate at your 24.0% rate — not tax advice; consult a CPA.
Schools (NCES district)
- District
- Midland ISD
- NCES district ID
- 4830570
- Math proficiency
- 34% ▼ -7.00%
- Reading proficiency
- 36% ▬ 0.00%
- Median HH income
- $63,457
- Composite
- 31.63/100
- National rank
- #5938
- State rank
- #477 of 826 in TX
Livability — Midland
- Score
- 79/100
- State rank
- #57
- US rank
- #2192
Category grades
Schools grade is shown separately in the Schools card above.
Census & demographics
- Census place
- Midland, TX
- County
- Midland County · 168,494 people
- City population
- 168,494
- Metro
- Midland, TX
- Population (ZIP)
- 46,653
- Household income
- $105,310
- Rent vs Own
- Severe rent burden
- 1557.0
Population outlook (Midland County) Hauer SSP2
- Today (2025)
- 220,895 people
- By 2030
- 253,667 · +14.8%
- By 2040
- 325,498 · +47.4%
- By 2050
- 404,168 · +83.0%
- By 2075
- 609,802 · +176.1%
- By 2100
- 760,172 · +244.1%
Race, ethnicity, and origin ACS 2023
- Neighborhood character
- Diverse neighborhood (Simpson 0.60)
- Race & ethnicity
- White 46% Hispanic / Latino 43% Two or more races 20% Black 8%
- Hispanic origin (detail)
- Mexican 35%
- Common ancestry
- Slovak 1% Lithuanian 1% Serbian 1%
- Foreign-born
- 10% · Canada, Jamaica
- Languages at home
- 72% English-only · Spanish 24% Arabic 1%
Political lean MEDSL · Midland
- 2024 margin
- Solid R (+60.5) · D 19.3% · R 79.8%
- 2008→2024 swing
- -3.3pp toward R · 2008: -57.3pp · 2024: -60.5pp
- All cycles
- 2024: R+60.5 2020: R+56.6 2016: R+55.2 2012: R+61.5 2008: R+57.3
Not yet ingested
- Civics
- —
Market trends
- HPI YoY
- ▼ -300.44%
- Current HPI
- 207.2904
- Rent YoY
- ▲ 2.56%
- Metro
- Midland, TX
- State GDP YoY
- ▲ 3.95%
- F500 in state
- 110
Industry mix (Fortune 500 HQ in TX)
| Industry | F500 HQs | Revenue |
|---|---|---|
| Energy | 16 | $1,198B |
|
||
| Technology | 5 | $198B |
|
||
| Engineering / Construction | 4 | $72B |
|
||
| Energy Services | 3 | $60B |
|
||
| Utilities | 3 | $41B |
|
||
| Healthcare | 2 | $330B |
|
||
Price history
+0.0% since first listed4 events — show timeline
- 2026-05-23 Listed $297,000 PBBOR
- 2026-05-23 Listed $297,000 ODMLS
- 2018-11-21 Sold (Public Records) — Public Records
- 1991-12-31 Sold (Public Records) — Public Records
Property tax history
+1.1%/yrLatest (2025): $4,624 · +24.5% YoY. Source: county tax records.
Cash-flow waterfall
monthlySold comps — $/sqft
last 12 mo · ≤1 miLoading sold comps…