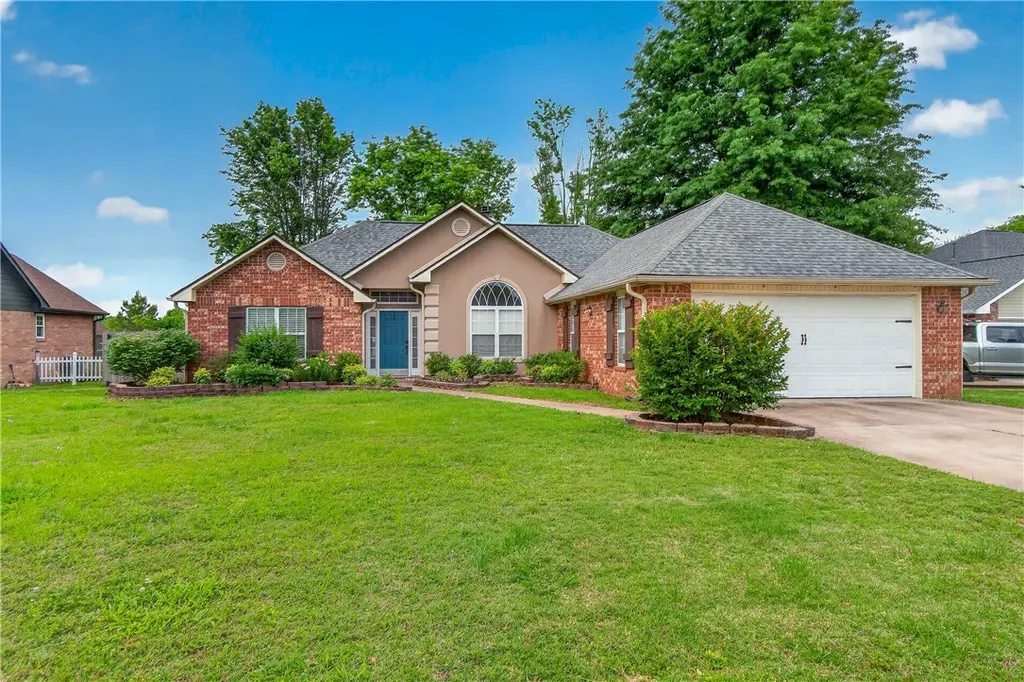
1004 Deerfield Mdw · Siloam Springs, AR
Flood risk 1/10 · Minimal
- FEMA flood zone
- X (unshaded)
- Chance of flooding over 30 yrs
- 0.0%
- Est. flood insurance / yr
- $507 – $1,088
Fire risk 6/10 · Moderate
- Est. fire insurance / yr
- $1,499 – $2,785
Heat risk 6/10 · Moderate
- Hot days now (above 106°F)
- 7 days/yr
- Hot days in 30 yrs
- 21 days/yr
Wind risk 2/10 · Minimal
- Chance of severe wind over 30 yrs
- 3.0%
Air-quality risk 2/10 · Minimal
- Unhealthy air days now
- 1 days/yr
- Unhealthy air days in 30 yrs
- 1 days/yr
Risk factors via First Street. Map © Google.
Why this score? — see what drove the D grade
The composite is a weighted blend of 9 inputs, each scored 0–100. Each bar is that input's sub-score; the figure is the points it added to the 100-point composite (weight × sub-score).
- Cash flow +12.0/30.0
- ARV discount +11.6/15.0
- Livability +3.7/5.0
- Schools +3.6/10.0
- DSCR +3.5/10.0
- 1% rule +2.5/10.0
- Rent growth +2.5/5.0
- Condition / age +2.5/5.0
- Appreciation +0.0/10.0
$305,000
🖨 Deal sheet (PDF) 📄 Offer letter ✓ Due diligence
Listing remarks MLS
Sold!
Key facts
- Bright sunroom
- Nearby schools
- 0.25 acre lot
Tags
Property features AI
Finance
- HOA & community: Monthly association fee; Community features include biking, trails/paths, and proximity to schools
Exterior
- Parking: Attached garage with garage door opener; Two covered parking spaces
- Security: Smoke detectors
- Utilities: Electricity available; Natural gas available; Public water; Sewer available
- Home design: Single-story home; Brick and stucco exterior; Architectural shingle roof; Has home warranty; Block foundation
- Construction: Built 25 or more years ago; Brick and stucco construction; Architectural shingle roof; Block foundation
- Exterior features: Concrete driveway; Deck; Backyard with wood privacy fence; Cleared, level lot; Paved road access; Lot dimensions approximately 78 x 137
Interior
- Kitchen: Electric range with smooth cooktop; Self-cleaning oven; Microwave and microwave hood fan; Dishwasher; Disposal; Refrigerator
- Flooring: Carpet; Laminate; Tile
- Bathrooms: Two full bathrooms; One half bathroom
- Heating & cooling: Central heating (gas); Central electric air conditioning
- Interior features: Built-in features throughout; Ceiling fans; Window treatments; Sunroom; Double-pane windows; Blinds
- Laundry & utility: Washer and dryer; Gas water heater
Neighborhood map
What this means for you Summary
Snapshot
- This is a 3-bed/2.5-bath single-family listed at $305k.
Deal economics
- At list price, monthly cash flow is $-73 ($-878/yr) — negative.
- To cash-flow at today's rent, offer at most $292k (4.2% below list).
- To meet the 1% rule (rent ≥ 1% of price), the offer needs to be $227k (25.5% below list).
- Recommended offer: $227k (25.5% below list) — sets the bar for 1% rule.
- Cap rate 6.0% vs local median 3.8% in Siloam Springs — top-decile yield for the area; either an underpriced asset or a hidden risk that comps aren't pricing in. Stress-test before assuming the spread holds.
Location & tenants
- Location reads 74/100 on livability (#17 in AR, #4,621 nationally) — a middle-class / working-renter tenant base. Strengths: cost of living A+, housing A+, health & safety A+; Watch: crime D, amenities F, commute F.
- Siloam Springs School District (town): math 44% / reading 40% proficiency, ranked #53 of 238 in AR (top 22%) — families likely to look elsewhere, expect single-tenant / working-renter base with shorter leases.
- Zoned schools: Delbert Pete & Pat Allen Ele (667 students, 62% FRL); Siloam Springs Intermediate School (math 44% / reading 42%, grade D-, #70 of 201 statewide, top 38%, 700 students, 59% FRL); Siloam Springs High School Conversion Charter (math 33% / reading 37%, grade F, #90 of 292 statewide, top 31%, 1,402 students, 49% FRL, charter).
- Market conditions: 371 active listings in the ZIP; 16 comparable units currently listed for rent nearby; rentals at typical pace (median 16d on market — plan ~3-4 weeks tenant-placement turnaround); solid renter incomes; 4,359 units permitted in Benton County in 2024 (402 in 5+ unit buildings).
- This rent runs 36% of the median local income ($76k/yr) — at the standard rent-burdened threshold; future hikes will face affordability resistance.
Forward outlook
- Local home prices are declining (-3.0%/yr); year-one equity from $2k of loan paydown is wiped out by about $9k of value loss. Plan a longer hold.
- Benton County population projected at +56% by 2050 — long-run rental-demand tailwind backs the buy-and-hold thesis.
Negotiation context
- Only 7 days on market — expect competitive offers; lowballing is unlikely to land.
- 3 sale attempts since 4y ago with the ask held roughly flat each time — persistent listings suggest the price (not the market) is what's stuck; bring a comps-based counter.
Risks & watch-outs
- Climate carrying-cost: major wildfire risk; extreme-heat days projected 7→21/yr by 2055 (HVAC capex compounding) — expect insurance premiums to compound above CPI over the hold.
Questions for the listing agent
- What do current leases actually rent for vs. the listed asking? Can we see a recent rent roll and the last 12 months of T-12 income?
- Is there a deadline driving the sale (1031 exchange, divorce, estate, relocation)? That informs how much negotiation room exists.
- Schools are D-rated, which usually means shorter tenancies and higher turnover. Who's the typical renter profile here, and what's been the actual vacancy rate?
- Crime grade is D in this area — have there been break-ins, vandalism, or insurance claims at this property in the last 3 years? What carrier currently insures it and at what premium?
- The area grade is low — what's the realistic commute time and amenity access for the typical tenant pool here? Any planned neighborhood developments (good or bad) we should know about?
- What's the average days-on-market for RENTAL listings here right now (not sales)? A rising rental-DOM trend means longer vacancies and softer asking-rent achievability than the comps imply.
- What's the recent tenant-quality profile in this submarket — average credit score on applications, eviction rate, late-payment / NSF rate, and stable-employment percentage? A property-management company in the area should have these aggregated.
- How much new for-sale + rental construction is in the pipeline within 1–3 miles? Heavy new supply typically softens prices + rents 12–24 months out; constrained supply supports both.
Investment metrics
- 1% rule
- 0.75% ✗
- Cap rate
- 6.01%
- Cash-on-cash
- -1.03%
- DSCR
- 0.95
- GRM
- 11.2
CMA / ARV
- ARV (median comp)
- $335,598
- List price
- $305,000
- Delta
- -9.12%
- Verdict
- FAIR
- Comps
- 20 within 1.0 mi
Show comp detail 12 sales within ~0.75 mi
| Address | Dist | Beds/Ba | Sqft | Sold | Price | $/sf | Match |
|---|---|---|---|---|---|---|---|
| 700 W Taylor St | 0.20mi | 3/2.0 | 1,874 (+3%) | 6mo | $324,875 | $173 | 78 |
| 1409 Hunter Rdg | 0.20mi | 4/2.0 (+1) | 2,015 (+11%) | 6mo | $315,000 | $156 | 60 |
| 606 Gail Dr | 0.29mi | 4/2.0 (+1) | 1,654 (-9%) | 8mo | $250,000 | $151 | 59 |
| 306 Misti Ct | 0.74mi | 3/2.0 | 1,897 (+5%) | 1mo | $314,000 | $166 | 55 |
| 2308 N Presley St | 0.70mi | 3/2.0 | 1,685 (-7%) | 3mo | $354,300 | $210 | 51 |
| 505 Cattleman Ln | 0.61mi | 3/2.0 | 1,621 (-11%) | 2mo | $299,000 | $184 | 50 |
| 710 W University St | 0.73mi | 3/2.5 | 1,974 (+9%) | 3mo | $320,000 | $162 | 49 |
| 608 W Worchester | 0.39mi | 4/2.0 (+1) | 1,597 (-12%) | 7mo | $284,600 | $178 | 49 |
| 2105 N Dagan St | 0.45mi | 4/2.0 (+1) | 2,068 (+14%) | 2mo | $392,900 | $190 | 47 |
| 503 N Wright St | 0.72mi | 3/1.5 | 1,696 (-6%) | 8mo | $230,000 | $136 | 45 |
| 511 N Wright St | 0.70mi | 3/2.0 | 1,640 (-10%) | 6mo | $185,000 | $113 | 44 |
| 605 N Wright St | 0.68mi | 4/2.0 (+1) | 1,689 (-7%) | 7mo | $315,000 | $187 | 44 |
Match score weights: distance 35% · size 25% · config 20% · recency 20%. Top-matched comps best support the ARV.
Projected returns pro-forma
-3.0% appreciation · 3.0% rent growth · sell at horizon
- IRR
- -18.0%
- Equity multiple
- 0.37×
- Total profit
- $-54,194
- Equity at exit
- $45,476
- IRR
- -10.3%
- Equity multiple
- 0.37×
- Total profit
- $-53,647
- Equity at exit
- $26,371
Cash invested: $85,400 (down + closing). Projections, not guarantees.
Landlord ↔ Tenant lean methodology
- Overall (STATE)
- 92 Strongly Landlord-Friendly
- State Arkansas
- 92 Strongly Landlord-Friendly · R+14
- County
- — inherits STATE
- City
- — inherits STATE
ZIP-level market 72761
- Home prices YoY
- -13.6%
- Active inventory
- 371
- Price-to-rent
- 11.2×
Monthly cashflow live
- Estimated rent
- $2,273 high interval (Pro) →
- Mortgage (P&I)
- −$1,599
- Tax from tax record
- −$142 /mo · $1,703/yr
- Insurance
- −$127
- HOA
- −$0
- Vacancy / Maint / Mgmt
- −$477
- Net cashflow
- $-73
Break-even live
Sensitivity live
| Price | -10% $100 | -5% $13 | +0% $-73 | +5% $-159 | +10% $-246 |
|---|---|---|---|---|---|
| Rent | -10% $-253 | -5% $-163 | +0% $-73 | +5% $17 | +10% $106 |
| Rate | -1.0pp $80 | -0.5pp $4 | base $-73 | +0.5pp $-152 | +1.0pp $-233 |
UW: 25.0% down · 7.5% · 30yr · 1.5% tax · 5.0% vac · 8.0% maint · 8.0% mgmt
Financing live
Cash to close
- Down payment
- $76,250
- Closing costs
- $9,150
- Reserves months
- —
- Total cash needed
- —
Loan-product check · same deal, 3 products live
Conventional
25% down · 7.5% · 30yr
- Down + closing
- —
- Monthly P&I
- —
- Monthly cashflow
- —
- DSCR
- —
- Eligible?
- —
Personal DTI + credit; lowest rate.
DSCR
20% down · 8.5% · 30yr
- Down + closing
- —
- Monthly P&I
- —
- Monthly cashflow
- —
- DSCR
- —
- Eligible?
- —
No personal income docs; deal must DSCR.
Hard money
10% down · 12.0% · 12mo
- Down + closing
- —
- Monthly P&I
- —
- Monthly cashflow
- —
- DSCR
- —
- Eligible?
- —
Short-term bridge; refi at stabilization.
Rent comps 16 comps
| Address | Beds | Baths | Sqft | Rent | $/sqft | DOM | Units | Dist |
|---|---|---|---|---|---|---|---|---|
| 201 N Dogwood St Unit 1241305P Siloam Springs, AR | 3.0 | 2.0 | 1969 | $3,298 | $1.67 | 16d | 1 | 0.67mi |
| 400 Cattleman Ln Siloam Springs, AR | 3.0 | 2.0 | 1525 | $1,800 | $1.18 | 25d | 1 | 0.67mi |
| 2304 N Presley St Siloam Springs, AR | 4.0 | 3.0 | 2148 | $2,150 | $1.00 | 25d | 1 | 0.71mi |
| 2303 N Presley St Siloam Springs, AR | 4.0 | 3.0 | 2148 | $2,150 | $1.00 | 25d | 1 | 0.72mi |
| 111 W Tahlequah St Unit 1520930P Siloam Springs, AR | 3.0 | 2.0 | 1345 | $3,827 | $2.85 | 16d | 1 | 0.72mi |
| 504 W Christopher Dr Siloam Springs, AR | 3.0 | 2.0 | 1316 | $1,325 | $1.01 | 23d | 1 | 0.88mi |
| 603 W Christopher Dr Unit A Siloam Springs, AR | 3.0 | 2.0 | 1227 | $1,400 | $1.14 | 16d | 1 | 0.90mi |
| 2701 N Denver St Siloam Springs, AR | 3.0 | 2.0 | 1316 | $1,325 | $1.01 | 25d | 1 | 0.92mi |
| 2010 W Central St Unit 1520931P Siloam Springs, AR | 4.0 | 2.0 | 1894 | $3,631 | $1.92 | 16d | 1 | 0.95mi |
| 605 W Loren Dr Unit A Siloam Springs, AR | 3.0 | 2.0 | 1227 | $1,400 | $1.14 | 16d | 1 | 0.96mi |
| 2802 N Teresa Dr Unit A Siloam Springs, AR | 3.0 | 2.0 | 1227 | $1,400 | $1.14 | 16d | 1 | 0.97mi |
| 408 S Wright St Unit 1520957P Siloam Springs, AR | 4.0 | 3.0 | 2109 | $4,449 | $2.11 | 23d | 1 | 1.07mi |
| 413 S Madison St Unit 1520928P Siloam Springs, AR | 4.0 | 2.0 | 1700 | $3,735 | $2.20 | 16d | 1 | 1.19mi |
| 315 W Harvard St Unit 1520942P Siloam Springs, AR | 3.0 | 2.0 | 2045 | $3,266 | $1.60 | 16d | 1 | 1.20mi |
| 426 S Washington St Unit 1520937P Siloam Springs, AR | 3.0 | 2.0 | 1582 | $4,358 | $2.75 | 16d | 1 | 1.22mi |
| 1107 E Ken Leach Siloam Springs, AR | 3.0 | 2.0 | 1398 | $1,500 | $1.07 | 23d | 1 | 1.24mi |
Listing history 7 events
-
2026-05-15$305,000 Active 980-char remark
-
2022-05-27soldstatus $285,000 Closed 240-char remark
Show marketing remark (5 chars)
Sold!
-
2022-05-27soldstatus $285,000
Show marketing remark (5 chars)
Sold!
-
2022-05-27$285,000
Show marketing remark (5 chars)
Sold!
-
2022-05-03status Pending 240-char remark
Show marketing remark (240 chars)
Great Location! Nice home in an established neighborhood. A Three bedroom two bath home with sunroom. Square footage of sunroom is not included in the total square footage. Nice large backyard with privacy fence. Home is wired for security.
-
2022-05-02$272,000 Active 240-char remark
Show marketing remark (240 chars)
Great Location! Nice home in an established neighborhood. A Three bedroom two bath home with sunroom. Square footage of sunroom is not included in the total square footage. Nice large backyard with privacy fence. Home is wired for security.
-
2004-03-26soldstatus $140,000
ⓘ Source: listings_history table (triggers on properties + properties_extension) + one-shot
backfill from property_details.listing_events for pre-trigger history.
Tax reassessment forecast AR · Resets to sale price
- Current annual tax
- $1,703 · $142/mo
- Projected year-2 tax
- $1,952 · $163/mo
- Expected delta
- +$249/yr (+$21/mo · 14.6%)
ⓘ Screening estimate from a state-policy table — verify with the county assessor before closing.
Climate risk First Street
- Flood 1/10 Low FEMA zone X (unshaded) · 0% chance over 30 yrs
- Wildfire 6/10 Major
- Heat 6/10 Major 7 d/yr ≥106°F today · 21 d/yr by 30 yrs out
- Wind 2/10 Low 3% chance of damaging wind over 30 yrs
- Air quality 2/10 Low 1 unhealthy d/yr today · 1 by 30 yrs out
Nearby sold comps map
Loading sold comps map…
Walkable amenities ~0.75 mi
Loading nearby amenities…
Taxation est. · year 1
- Rental income
- $27,270
- − Mortgage interest
- −$17,085
- − Property taxes
- −$1,703
- − Insurance
- −$1,525
- − Repairs & maintenance
- −$2,182
- − Management
- −$2,182
- − Depreciation
- −$8,873
- Taxable loss
- −$6,278
- Est. tax savings @ 24.0%
- +$1,507
- After-tax cash flow
- $629/yr
For passive investors: Depreciation is non-cash, so a rental often shows a tax loss while cash-flowing — sheltering income. Rental losses are passive: they offset passive income freely, and up to $25,000/yr can offset ordinary (W-2) income if you actively participate and your MAGI is under $100k (phasing out to $0 by $150k); unused losses carry forward. On sale, claimed depreciation is recaptured at up to 25%, and gains may owe capital-gains tax (a 1031 exchange can defer both). Figures are a year-1 estimate at your 24.0% rate — not tax advice; consult a CPA.
Schools (NCES district)
- District
- Siloam Springs School District
- NCES district ID
- 0512450
- Math proficiency
- 44% ▼ -7.00%
- Reading proficiency
- 40% ▼ -2.00%
- Median HH income
- $46,222
- Composite
- 35.81/100
- National rank
- #4828
- State rank
- #53 of 238 in AR
Livability — Siloam Springs
- Score
- 74/100
- State rank
- #17
- US rank
- #4621
Category grades
Schools grade is shown separately in the Schools card above.
Census & demographics
- Census place
- Siloam Springs, AR
- County
- Benton County · 259,241 people
- City population
- 24,745
- Metro
- Fayetteville-Springdale-Rogers, AR
- Population (ZIP)
- 24,745
- Household income
- $76,122
- Rent vs Own
- Severe rent burden
- 176.0
Population outlook (Benton County) Hauer SSP2
- Today (2025)
- 318,683 people
- By 2030
- 353,481 · +10.9%
- By 2040
- 425,280 · +33.4%
- By 2050
- 497,239 · +56.0%
- By 2075
- 662,114 · +107.8%
- By 2100
- 776,431 · +143.6%
Race, ethnicity, and origin ACS 2023
- Neighborhood character
- Diverse neighborhood (Simpson 0.63)
- Race & ethnicity
- White 58% Two or more races 24% Hispanic / Latino 19% Native American 4% Asian 3%
- Hispanic origin (detail)
- Mexican 8% Puerto Rican 2%
- Common ancestry
- Italian 2% Slovak 1% Serbian 1%
- Foreign-born
- 11% · Canada
- Languages at home
- 85% English-only · Spanish 13% Other Indo-European 1%
Political lean MEDSL · Benton
- 2024 margin
- Strong R (+27.0) · D 35.2% · R 62.1% · Other 2.7%
- 2008→2024 swing
- +9.6pp toward D · 2008: -36.5pp · 2024: -27.0pp
- All cycles
- 2024: R+27.0 2020: R+26.4 2016: R+34.9 2012: R+40.4 2008: R+36.5
Not yet ingested
- Civics
- —
Market trends
- HPI YoY
- ▼ -45.93%
- Current HPI
- 291.1062
- Rent YoY
- —
- Metro
- Fayetteville-Springdale-Rogers, AR
- State GDP YoY
- ▲ 3.80%
- F500 in state
- 10
Industry mix (Fortune 500 HQ in AR)
| Industry | F500 HQs | Revenue |
|---|---|---|
| Retail | 1 | $681B |
|
||
| Food / Agriculture | 1 | $53B |
|
||
| Retail / Energy | 1 | $22B |
|
||
| Transportation / Logistics | 1 | $12B |
|
||
| Energy | 1 | $4B |
|
||
Price history
+117.9% since first listed8 events — show timeline
- 2026-05-22 Pending — NWARMLS
- 2026-05-15 Listed $305,000 NWARMLS
- 2022-05-27 Listed $285,000 WRVBOR
- 2022-05-27 Sold (MLS) $285,000 NWARMLS
- 2022-05-27 Sold (MLS) $285,000 WRVBOR
- 2022-05-03 Pending — NWARMLS
- 2022-05-02 Listed $272,000 NWARMLS
- 2004-03-26 Sold (Public Records) $140,000 Public Records
Property tax history
+2.5%/yrLatest (2025): $1,703 · +1.6% YoY. Source: county tax records.
Cash-flow waterfall
monthlySold comps — $/sqft
last 12 mo · ≤1 miLoading sold comps…