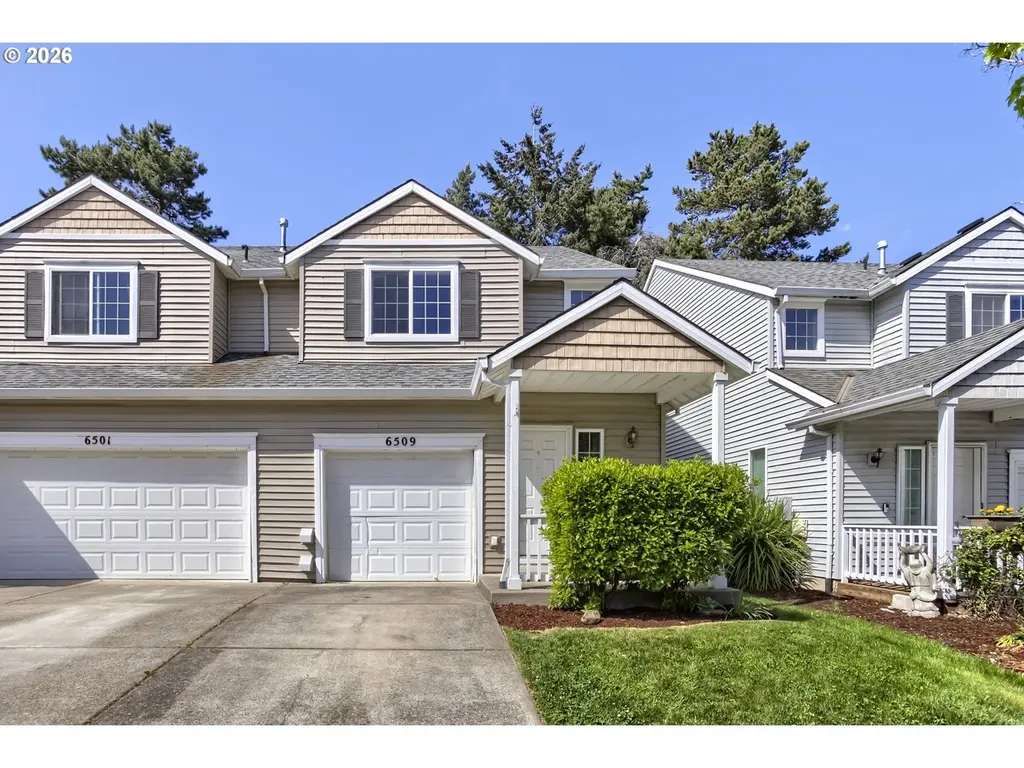
6509 NE Deer Run St · Hillsboro, OR
Flood risk 1/10 · Minimal
- FEMA flood zone
- X (unshaded)
- Chance of flooding over 30 yrs
- 0.0%
- Est. flood insurance / yr
- $507 – $1,088
Fire risk 1/10 · Minimal
- Est. fire insurance / yr
- $498 – $926
Heat risk 3/10 · Minor
- Hot days now (above 92°F)
- 7 days/yr
- Hot days in 30 yrs
- 14 days/yr
Wind risk 1/10 · Minimal
- Chance of severe wind over 30 yrs
- —
Air-quality risk 8/10 · Major
- Unhealthy air days now
- 11 days/yr
- Unhealthy air days in 30 yrs
- 11 days/yr
Risk factors via First Street. Map © Google.
Why this score? — see what drove the D- grade
The composite is a weighted blend of 9 inputs, each scored 0–100. Each bar is that input's sub-score; the figure is the points it added to the 100-point composite (weight × sub-score).
- ARV discount +14.9/15.0
- Cash flow +7.7/30.0
- Livability +4.4/5.0
- Schools +3.7/10.0
- Condition / age +2.5/5.0
- Rent growth +2.2/5.0
- 1% rule +1.8/10.0
- DSCR +1.8/10.0
- Appreciation +0.0/10.0
$340,000
🖨 Deal sheet (PDF) 📄 Offer letter ✓ Due diligence
Listing remarks MLS
Slight Cosmetic Fixer. Bring you vision and bring this home back to life. This is a gentle cosmetic fixer with some new carpeting and paint this home will shine once again. 3 Bedrooms, 2.5 bath. Pergo flooring on the main level and carpeting throughout the upper level. Fenced backyard area with a small patio, you have room to have a pet or play area or just enjoy you BBQ. Gas Fireplace, 1 car garage and low HOA Fees. This is a perfect starter home; or it would make a fantastic investment property. Minutes from Orenco Station, restaurants and local shopping.Home Energy Score: 7. See Link to report: https://rpt.greenbuildingregistry.com/hes/OR10248061 [Home Energy Score = 7. HES Report at https://rpt.greenbuildingregistry.com/hes/OR10248061]
Key facts
- New carpeting
- Gas fireplace
- Pergo flooring
Tags
Neighborhood map
What this means for you Summary
Snapshot
- This is a 3-bed/3.0-bath single-family listed at $340k.
Deal economics
- At list price, monthly cash flow is $-399 ($-5k/yr) — negative.
- To cash-flow at today's rent, offer at most $270k (20.7% below list).
- To meet the 1% rule (rent ≥ 1% of price), the offer needs to be $233k (31.6% below list).
- Recommended offer: $233k (31.6% below list) — sets the bar for 1% rule.
- Cap rate 4.9% vs local median 3.0% in Hillsboro — top-decile yield for the area; either an underpriced asset or a hidden risk that comps aren't pricing in. Stress-test before assuming the spread holds.
Location & tenants
- Location reads 87/100 on livability (#13 in OR, #282 nationally) — a professional / high-income tenant draw. Strengths: amenities A+, commute A+, employment A+; Watch: crime D+, cost of living F.
- Hillsboro SD 1J (urban): math 35% / reading 46% proficiency, ranked #13 of 58 in OR (top 22%) — families likely to look elsewhere, expect single-tenant / working-renter base with shorter leases.
- Market conditions: Rents soft (-1.3%/yr); 233 active listings in the ZIP; 40 comparable units currently listed for rent nearby; rentals at typical pace (median 25d on market — plan ~3-4 weeks tenant-placement turnaround); high-income renter base; 2,224 units permitted in Washington County in 2024 (242 in 5+ unit buildings).
Forward outlook
- Local home prices are declining (-3.0%/yr); year-one equity from $2k of loan paydown is wiped out by about $10k of value loss. Plan a longer hold.
- Washington County population projected at +33% by 2050 — long-run rental-demand tailwind backs the buy-and-hold thesis.
Negotiation context
- It's been on market 27 days — a 2% lower offer ($335k) is reasonable based on typical stale-listing flexibility.
- 4 sale attempts since 23y ago; this cycle's ask has dropped $23k (6%) from the opening price — seller is motivated, your offer sets the floor, not the list.
- Current owner paid $258k; 32% above their basis — modest negotiation headroom, anchor on the comps not their cost.
Questions for the listing agent
- What do current leases actually rent for vs. the listed asking? Can we see a recent rent roll and the last 12 months of T-12 income?
- What does the HOA fee cover, when was the last increase, and are there any pending special assessments or reserve-fund shortfalls?
- Is there a deadline driving the sale (1031 exchange, divorce, estate, relocation)? That informs how much negotiation room exists.
- Crime grade is D in this area — have there been break-ins, vandalism, or insurance claims at this property in the last 3 years? What carrier currently insures it and at what premium?
- The area grade is low — what's the realistic commute time and amenity access for the typical tenant pool here? Any planned neighborhood developments (good or bad) we should know about?
- What's the average days-on-market for RENTAL listings here right now (not sales)? A rising rental-DOM trend means longer vacancies and softer asking-rent achievability than the comps imply.
- What's the recent tenant-quality profile in this submarket — average credit score on applications, eviction rate, late-payment / NSF rate, and stable-employment percentage? A property-management company in the area should have these aggregated.
- How much new for-sale + rental construction is in the pipeline within 1–3 miles? Heavy new supply typically softens prices + rents 12–24 months out; constrained supply supports both.
Investment metrics
- 1% rule
- 0.68% ✗
- Cap rate
- 4.89%
- Cash-on-cash
- -5.03%
- DSCR
- 0.78
- GRM
- 12.2
CMA / ARV
- ARV (median comp)
- $407,334
- List price
- $340,000
- Delta
- -16.53%
- Verdict
- UNDERPRICED
- Comps
- 20 within 1.0 mi
Show comp detail 12 sales within ~0.75 mi
| Address | Dist | Beds/Ba | Sqft | Sold | Price | $/sf | Match |
|---|---|---|---|---|---|---|---|
| 675 SE 70th Ct | 0.58mi | 3/2.0 | 1,356 (+4%) | 5mo | $495,000 | $365 | 59 |
| 818 SE 68th Pl | 0.66mi | 3/2.0 | 1,306 (-0%) | 7mo | $471,000 | $361 | 58 |
| 6511 SE Borwick St | 0.38mi | 3/1.0 | 1,200 (-8%) | 3mo | $380,000 | $317 | 58 |
| 6550 SE Wrenfield St | 0.63mi | 3/2.0 | 1,331 (+2%) | 8mo | $510,000 | $383 | 57 |
| 6614 NE Alder St | 0.50mi | 2/1.0 (-1) | 1,224 (-7%) | 0mo | $540,000 | $441 | 52 |
| 6194 SE Maple St | 0.54mi | 3/2.0 | 1,424 (+9%) | 8mo | $485,000 | $341 | 50 |
| 5782 NE Canard Ct | 0.46mi | 3/3.0 | 1,506 (+15%) | 5mo | $474,500 | $315 | 49 |
| 438 SE 71st Pl | 0.55mi | 3/2.0 | 1,490 (+14%) | 0mo | $529,000 | $355 | 47 |
| 6134 SE Sigrid St | 0.59mi | 3/2.0 | 1,496 (+14%) | 4mo | $535,000 | $358 | 42 |
| 7544 NE Catherine Ct | 0.74mi | 3/3.0 | 1,478 (+13%) | 4mo | $475,000 | $321 | 41 |
| 6874 SE Ariel St | 0.62mi | 3/2.0 | 1,491 (+14%) | 7mo | $500,000 | $335 | 38 |
| 6204 SE Sigrid St | 0.58mi | 3/2.0 | 1,502 (+15%) | 8mo | $527,000 | $351 | 38 |
Match score weights: distance 35% · size 25% · config 20% · recency 20%. Top-matched comps best support the ARV.
Projected returns pro-forma
-3.0% appreciation · 0.0% rent growth · sell at horizon
- IRR
- -28.1%
- Equity multiple
- 0.08×
- Total profit
- $-87,346
- Equity at exit
- $50,695
- IRR
- -42.3%
- Equity multiple
- -0.42×
- Total profit
- $-135,257
- Equity at exit
- $29,397
Cash invested: $95,200 (down + closing). Projections, not guarantees.
Landlord ↔ Tenant lean methodology
- Overall (STATE)
- 28 Tenant-Leaning
- State Oregon
- 28 Tenant-Leaning · D+6
- County
- — inherits STATE
- City
- — inherits STATE
ZIP-level market 97124
- Rents YoY
- -1.3%
- Active inventory
- 233
- Price-to-rent
- 12.2×
Monthly cashflow live
- Estimated rent
- $2,327 high interval (Pro) →
- Mortgage (P&I)
- −$1,783
- Tax from tax record
- −$270 /mo · $3,245/yr
- Insurance
- −$142
- HOA
- −$42
- Vacancy / Maint / Mgmt
- −$489
- Net cashflow
- $-399
Break-even live
Sensitivity live
| Price | -10% $-206 | -5% $-303 | +0% $-399 | +5% $-495 | +10% $-591 |
|---|---|---|---|---|---|
| Rent | -10% $-583 | -5% $-491 | +0% $-399 | +5% $-307 | +10% $-215 |
| Rate | -1.0pp $-228 | -0.5pp $-312 | base $-399 | +0.5pp $-487 | +1.0pp $-577 |
UW: 25.0% down · 7.5% · 30yr · 1.5% tax · 5.0% vac · 8.0% maint · 8.0% mgmt
Financing live
Cash to close
- Down payment
- $85,000
- Closing costs
- $10,200
- Reserves months
- —
- Total cash needed
- —
Loan-product check · same deal, 3 products live
Conventional
25% down · 7.5% · 30yr
- Down + closing
- —
- Monthly P&I
- —
- Monthly cashflow
- —
- DSCR
- —
- Eligible?
- —
Personal DTI + credit; lowest rate.
DSCR
20% down · 8.5% · 30yr
- Down + closing
- —
- Monthly P&I
- —
- Monthly cashflow
- —
- DSCR
- —
- Eligible?
- —
No personal income docs; deal must DSCR.
Hard money
10% down · 12.0% · 12mo
- Down + closing
- —
- Monthly P&I
- —
- Monthly cashflow
- —
- DSCR
- —
- Eligible?
- —
Short-term bridge; refi at stabilization.
Rent comps 40 comps
| Address | Beds | Baths | Sqft | Rent | $/sqft | DOM | Units | Dist |
|---|---|---|---|---|---|---|---|---|
| 6546 NE Forest Ln Hillsboro, OR | 3.0 | 2.5 | 1310 | $2,200 | $1.68 | 44d | 1 | 0.03mi |
| 727 NE 65th Ct Hillsboro, OR | 3.0 | 2.5 | 1600 | $2,450 | $1.53 | 25d | 1 | 0.24mi |
| 471 NE Caden Ave Hillsboro, OR | 3.0 | 2.5 | 1717 | $2,495 | $1.45 | 25d | 1 | 0.40mi |
| 764 NE 61st Ave Hillsboro, OR | 4.0 | 2.5 | 1709 | $2,500 | $1.46 | 18d | 1 | 0.49mi |
| 764 NE 61st Ave Hillsboro, OR | 4.0 | 2.5 | 1709 | $2,500 | $1.46 | 8d | 1 | 0.49mi |
| 123 NE 75th Ave Hillsboro, OR | 3.0 | 3.0 | 1781 | $2,295 | $1.29 | 25d | 1 | 0.55mi |
| 6031 NE Maidstone St Hillsboro, OR | 2.0 | 2.5 | 1593 | $2,375 | $1.49 | 12d | 1 | 0.60mi |
| 5502 NE Hidden Creek Dr Hillsboro, OR | 1.0–2.0 | 1.0–2.0 | 870 | $2,000 | $2.30 | 2d | 8 | 0.60mi |
| 967 NE Orenco Station Loop Hillsboro, OR | 2.0 | 1.0–2.0 | 731 | $2,472 | $3.38 | 3d | 18 | 0.62mi |
| 6380 NE Cherry Dr Hillsboro, OR | 2.0 | 1.0–2.0 | 893 | $2,592 | $2.90 | 3d | 19 | 0.64mi |
| 6998 NE Cherry Dr Hillsboro, OR | 1.0–3.0 | 1.0–3.0 | 1319 | $3,045 | $2.31 | 3d | 12 | 0.65mi |
| 7414 NE Shaleen St Hillsboro, OR | 3.0 | 2.5 | 1419 | $2,400 | $1.69 | 11d | 1 | 0.67mi |
| 6523 NE Cherry Dr Hillsboro, OR | 3.0 | 1.0–2.0 | 1009 | $2,795 | $2.77 | 3d | 17 | 0.67mi |
| 7261 NE Stoneybrook St Hillsboro, OR | 2.0 | 2.5 | 1213 | $2,200 | $1.81 | 25d | 1 | 0.69mi |
| 770 NE 72nd Ave Hillsboro, OR | 3.0 | 2.5 | 1647 | $2,350 | $1.43 | 21d | 1 | 0.69mi |
| 303 NE Natalie St Hillsboro, OR | 3.0 | 2.5 | 1632 | $2,400 | $1.47 | 44d | 1 | 0.70mi |
| 279 NE Natalie St Hillsboro, OR | 3.0 | 3.0 | 1632 | $2,490 | $1.53 | 25d | 1 | 0.70mi |
| 331 NE 79th Ave Unit 337/204 Hillsboro, OR | 2.0 | 2.0 | 1056 | $1,799 | $1.70 | 4d | 1 | 0.72mi |
| 7146 NE Cherry Dr Hillsboro, OR | 2.0 | 2.5 | 1185 | $2,250 | $1.90 | 25d | 1 | 0.72mi |
| 1175 NE 64th Ln #1109 Hillsboro, OR | 2.0 | 2.0 | 1092 | $1,950 | $1.79 | 13d | 1 | 0.73mi |
| 1175 NE 64th Ln #1109 Hillsboro, OR | 2.0 | 2.0 | 1092 | $1,950 | $1.79 | 25d | 1 | 0.73mi |
| 399 NE 79th Ave Beaverton, OR | 2.0 | 2.0 | 1000 | $1,799 | $1.80 | 8d | 1 | 0.73mi |
| 5300 E Main St Hillsboro, OR | 1.0–2.0 | 1.0–2.0 | 840 | $1,699 | $2.02 | 3d | 3 | 0.80mi |
| 1299 NE Orenco Station Pkwy Hillsboro, OR | 1.0–3.0 | 1.0–2.0 | 1020 | $2,608 | $2.56 | 2d | 30 | 0.81mi |
| 7399 NE Stonewater St Hillsboro, OR | 2.0 | 2.0 | 1118 | $2,245 | $2.01 | 25d | 1 | 0.81mi |
| 421 NE 80th Ave Hillsboro, OR | 1.0–2.0 | 1.0–2.0 | 842 | $1,899 | $2.25 | 3d | 19 | 0.81mi |
| 131 NE 79th Ave Beaverton, OR | 2.0 | 3.0 | 1488 | $2,300 | $1.55 | 44d | 1 | 0.82mi |
| 720 SE Oak Glen Way Hillsboro, OR | 1.0–3.0 | 1.0–2.0 | 855 | $2,045 | $2.39 | 5d | 7 | 0.82mi |
| 7894 NE Miriam Way Beaverton, OR | 2.0 | 2.5 | 1715 | $2,495 | $1.45 | 25d | 1 | 0.83mi |
| 8041 NE Miriam Way Beaverton, OR | 2.0 | 2.5 | 1715 | $2,300 | $1.34 | 25d | 1 | 0.87mi |
| 8113 NE Rockne Way Beaverton, OR | 3.0 | 2.5 | 1719 | $2,550 | $1.48 | 44d | 1 | 0.93mi |
| 965 NE Wheelock Pl Beaverton, OR | 2.0 | 2.5 | 1227 | $2,395 | $1.95 | 44d | 1 | 0.95mi |
| 6710 NE Vinings Way Hillsboro, OR | 1.0–2.0 | 1.0–2.0 | 900 | $2,250 | $2.50 | 3d | 20 | 0.96mi |
| 472 NE Patricia Ann Pl Beaverton, OR | 2.0 | 2.5 | 1422 | $2,350 | $1.65 | 21d | 1 | 0.99mi |
| 1107 NE Station Ct Beaverton, OR | 3.0 | 2.5 | 1400 | $2,200 | $1.57 | 44d | 1 | 1.02mi |
| 140 NE 47th Ave Hillsboro, OR | 2.0 | 1.5 | 1100 | $1,660 | $1.51 | 18d | 4 | 1.03mi |
| 7436 SE Beverly Ln Hillsboro, OR | 3.0 | 2.0 | 1470 | $2,495 | $1.70 | 25d | 1 | 1.07mi |
| 283 NW 208th Ave Beaverton, OR | 3.0 | 2.5 | 1776 | $2,300 | $1.30 | 44d | 1 | 1.08mi |
| 177 NW 208th Ave Beaverton, OR | 4.0 | 2.5 | 1824 | $2,700 | $1.48 | 25d | 1 | 1.08mi |
| 20789 NW Painted Mountain Dr Beaverton, OR | 3.0 | 2.5 | 1753 | $2,375 | $1.35 | 44d | 1 | 1.11mi |
HOA detail
- Monthly dues
- $42 · $504/yr
- Likely covers
- gas
Listing history 22 events
-
2026-06-15statusdays on market $340,000 Pending 27 DOM
-
2026-06-13days on market $340,000 Active 26 DOM
-
2026-06-09days on market $340,000 Active 22 DOM
-
2026-06-08days on market $340,000 Active 21 DOM
-
2026-06-07days on market $340,000 Active 20 DOM
-
2026-06-05days on market $340,000 Active 17 DOM
-
2026-06-03days on market $340,000 Active 16 DOM
-
2026-06-02days on market $340,000 Active 15 DOM
-
2026-06-01days on market $340,000 Active 14 DOM
-
2026-05-31days on market $340,000 Active 13 DOM
-
2026-05-12$363,000 Active 753-char remark
Show marketing remark (753 chars)
Slight Cosmetic Fixer. Bring you vision and bring this home back to life. This is a gentle cosmetic fixer with some new carpeting and paint this home will shine once again. 3 Bedrooms, 2.5 bath. Pergo flooring on the main level and carpeting throughout the upper level. Fenced backyard area with a small patio, you have room to have a pet or play area or just enjoy you BBQ. Gas Fireplace, 1 car garage and low HOA Fees. This is a perfect starter home; or it would make a fantastic investment property. Minutes from Orenco Station, restaurants and local shopping.Home Energy Score: 7. See Link to report: https://rpt.greenbuildingregistry.com/hes/OR10248061 [Home Energy Score = 7. HES Report at https://rpt.greenbuildingregistry.com/hes/OR10248061]
-
2016-10-12soldstatus $258,000 Sold 427-char remark
Show marketing remark (427 chars)
Entry, living, dining & kitchen w/ laminate wood flooring. Living w/ gas fireplace. Dining w/ slider to yard. Kitchen amenities: bi-microwave, range, pantry, refrigerator, dishwasher, raised eat-bar & recessed lighting. Master bedroom w/ vaulted ceiling & closet. Bathroom suite w/ shower/tub. Utility closet washer & dryer included in the sale. Front yard sprinkler system. All landscaping freshly maintained.
-
2016-10-12soldstatus $258,000
Show marketing remark (427 chars)
Entry, living, dining & kitchen w/ laminate wood flooring. Living w/ gas fireplace. Dining w/ slider to yard. Kitchen amenities: bi-microwave, range, pantry, refrigerator, dishwasher, raised eat-bar & recessed lighting. Master bedroom w/ vaulted ceiling & closet. Bathroom suite w/ shower/tub. Utility closet washer & dryer included in the sale. Front yard sprinkler system. All landscaping freshly maintained.
-
2016-10-04status Pending 427-char remark
Show marketing remark (427 chars)
Entry, living, dining & kitchen w/ laminate wood flooring. Living w/ gas fireplace. Dining w/ slider to yard. Kitchen amenities: bi-microwave, range, pantry, refrigerator, dishwasher, raised eat-bar & recessed lighting. Master bedroom w/ vaulted ceiling & closet. Bathroom suite w/ shower/tub. Utility closet washer & dryer included in the sale. Front yard sprinkler system. All landscaping freshly maintained.
-
2016-09-29$254,999 Active 427-char remark
Show marketing remark (427 chars)
Entry, living, dining & kitchen w/ laminate wood flooring. Living w/ gas fireplace. Dining w/ slider to yard. Kitchen amenities: bi-microwave, range, pantry, refrigerator, dishwasher, raised eat-bar & recessed lighting. Master bedroom w/ vaulted ceiling & closet. Bathroom suite w/ shower/tub. Utility closet washer & dryer included in the sale. Front yard sprinkler system. All landscaping freshly maintained.
-
2014-11-04soldstatus $202,900 Sold
-
2014-11-04soldstatus $202,900
-
2014-09-02status Pending
-
2014-08-29$199,900 Active
-
2012-05-18soldstatus $136,000
-
2003-08-08soldstatus $142,400
-
2003-03-20$142,400
ⓘ Source: listings_history table (triggers on properties + properties_extension) + one-shot
backfill from property_details.listing_events for pre-trigger history.
Tax reassessment forecast OR · Resets to sale price
- Current annual tax
- $3,245 · $270/mo
- Projected year-2 tax
- $3,298 · $275/mo
- Expected delta
- +$53/yr (+$4/mo · 1.6%)
ⓘ Screening estimate from a state-policy table — verify with the county assessor before closing.
Climate risk First Street
- Flood 1/10 Low FEMA zone X (unshaded) · 0% chance over 30 yrs
- Wildfire 1/10 Low
- Heat 3/10 Moderate 7 d/yr ≥92°F today · 14 d/yr by 30 yrs out
- Wind 1/10 Low
- Air quality 8/10 Severe 11 unhealthy d/yr today · 11 by 30 yrs out
Nearby sold comps map
Loading sold comps map…
Walkable amenities ~0.75 mi
Loading nearby amenities…
Taxation est. · year 1
- Rental income
- $27,923
- − Mortgage interest
- −$19,045
- − Property taxes
- −$3,245
- − Insurance
- −$1,700
- − Repairs & maintenance
- −$2,234
- − Management
- −$2,234
- − HOA
- −$504
- − Depreciation
- −$9,891
- Taxable loss
- −$10,929
- Est. tax savings @ 24.0%
- +$2,623
- After-tax cash flow
- $-2,162/yr
For passive investors: Depreciation is non-cash, so a rental often shows a tax loss while cash-flowing — sheltering income. Rental losses are passive: they offset passive income freely, and up to $25,000/yr can offset ordinary (W-2) income if you actively participate and your MAGI is under $100k (phasing out to $0 by $150k); unused losses carry forward. On sale, claimed depreciation is recaptured at up to 25%, and gains may owe capital-gains tax (a 1031 exchange can defer both). Figures are a year-1 estimate at your 24.0% rate — not tax advice; consult a CPA.
Schools (NCES district)
- District
- Hillsboro SD 1J
- NCES district ID
- 4100023
- Math proficiency
- 35% ▼ -4.00%
- Reading proficiency
- 46% ▼ -7.00%
- Median HH income
- $68,587
- Composite
- 36.64/100
- National rank
- #4617
- State rank
- #13 of 58 in OR
Livability — Hillsboro
- Score
- 87/100
- State rank
- #13
- US rank
- #282
Category grades
Schools grade is shown separately in the Schools card above.
Census & demographics
- Census place
- Hillsboro, OR
- County
- Washington County · 583,254 people
- City population
- 102,767
- Metro
- Portland-Vancouver-Hillsboro, OR-WA
- Population (ZIP)
- 54,357
- Household income
- $110,067
- Rent vs Own
- Severe rent burden
- 2097.0
Population outlook (Washington County) Hauer SSP2
- Today (2025)
- 674,042 people
- By 2030
- 721,804 · +7.1%
- By 2040
- 812,732 · +20.6%
- By 2050
- 895,143 · +32.8%
- By 2075
- 1,058,806 · +57.1%
- By 2100
- 1,131,692 · +67.9%
Race, ethnicity, and origin ACS 2023
- Neighborhood character
- Diverse neighborhood (Simpson 0.62)
- Race & ethnicity
- White 56% Hispanic / Latino 24% Two or more races 14% Asian 11% Black 3% Pacific Islander 1%
- Hispanic origin (detail)
- Mexican 19%
- Common ancestry
- Italian 4% Portuguese 3% Slovak 2%
- Foreign-born
- 19% · Canada, China, South Korea
- Languages at home
- 73% English-only · Spanish 15% Other Asian/Pacific 4% Other Indo-European 3%
Political lean MEDSL · Washington
- 2024 margin
- Solid D (+34.0) · D 65.3% · R 31.3% · Other 3.4%
- 2008→2024 swing
- +11.8pp toward D · 2008: 22.1pp · 2024: 34.0pp
- All cycles
- 2024: D+34.0 2020: D+34.6 2016: D+26.7 2012: D+17.5 2008: D+22.1
Not yet ingested
- Civics
- —
Market trends
- HPI YoY
- ▼ -456.64%
- Current HPI
- 294.9757
- Rent YoY
- ▼ -1.34%
- Metro
- Portland-Vancouver-Hillsboro, OR-WA
- State GDP YoY
- ▲ 2.05%
- F500 in state
- 2
Industry mix (Fortune 500 HQ in OR)
| Industry | F500 HQs | Revenue |
|---|---|---|
| Consumer Goods | 1 | $51B |
|
||
Price history
+154.9% since first listed12 events — show timeline
- 2026-05-12 Listed $363,000 RMLS
- 2016-10-12 Sold (Public Records) $258,000 Public Records
- 2016-10-12 Sold (MLS) $258,000 RMLS
- 2016-10-04 Pending — RMLS
- 2016-09-29 Listed $254,999 RMLS
- 2014-11-04 Sold (Public Records) $202,900 Public Records
- 2014-11-04 Sold (MLS) $202,900 RMLS
- 2014-09-02 Pending — RMLS
- 2014-08-29 Listed $199,900 RMLS
- 2012-05-18 Sold (Public Records) $136,000 Public Records
- 2003-08-08 Sold (MLS) $142,400 RMLS
- 2003-03-20 Listed $142,400 RMLS
Property tax history
+2.7%/yrLatest (2025): $3,245 · +0.4% YoY. Source: county tax records.
Cash-flow waterfall
monthlySold comps — $/sqft
last 12 mo · ≤1 miLoading sold comps…