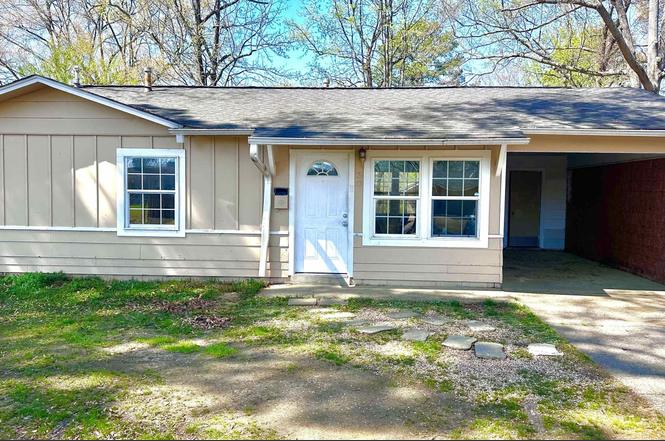
30 Elmhurst Dr · Little Rock, AR
Flood risk 1/10 · Minimal
- FEMA flood zone
- X (unshaded)
- Chance of flooding over 30 yrs
- 0.0%
- Est. flood insurance / yr
- $507 – $1,088
Fire risk 2/10 · Minimal
- Est. fire insurance / yr
- $1,499 – $2,785
Heat risk 7/10 · Major
- Hot days now (above 110°F)
- 7 days/yr
- Hot days in 30 yrs
- 19 days/yr
Wind risk 4/10 · Minor
- Chance of severe wind over 30 yrs
- 10.0%
Air-quality risk 2/10 · Minimal
- Unhealthy air days now
- 1 days/yr
- Unhealthy air days in 30 yrs
- 1 days/yr
Risk factors via First Street. Map © Google.
Why this score? — see what drove the C+ grade
The composite is a weighted blend of 9 inputs, each scored 0–100. Each bar is that input's sub-score; the figure is the points it added to the 100-point composite (weight × sub-score).
- Cash flow +29.8/30.0
- DSCR +10.0/10.0
- 1% rule +7.7/10.0
- Rent growth +3.7/5.0
- Livability +3.7/5.0
- Condition / age +2.5/5.0
- Schools +2.1/10.0
- ARV discount +0.6/15.0
- Appreciation +0.0/10.0
$88,000
🖨 Deal sheet (PDF) 📄 Offer letter ✓ Due diligence
Listing remarks
This charming Move in Ready 3-bedroom, 1-bath home has been freshly updated with brand new carpet and fresh interior paint, making it a perfect option for first-time buyers or anyone looking for a affordable home. The home features a functional layout, spacious living area, and a large backyard—ideal for entertaining, pets, or future improvements. Conveniently located in Little Rock with easy access to shopping, schools, and major roads. Don’t miss this opportunity to own a fully refreshed home at an affordable price—schedule your showing today!
Key facts
- Tile flooring
- Updated kitchen
- Enclosed fenced yard
Tags
Property features AI
Finance
- Other: Approx. lot size 0.25 acre
- Financial info: Financing options include conventional loan or cash
- HOA & community: Association/condo fees: other (see remarks)
Exterior
- Parking: Carport for 2 cars
- Utilities: Public sewer; Public water; Municipal electric service (Entergy); Natural gas; Wireless internet available; Energy features: other (see remarks)
- Home design: Metal/vinyl siding; Mobile/modular home: other (see remarks); Property is inside city limits; Level lot
- Construction: Architectural shingle roof; Slab foundation
- Exterior features: Wood fence; Paved road access; Waterfront: other (see remarks)
Interior
- Kitchen: Free-standing stove
- Flooring: Tile flooring
- Bathrooms: 1 full bathroom
- Heating & cooling: Central electric heat; Central electric cooling
- Interior features: Washer connection; Electric dryer connection; Kitchen counters with Formica; Sheetrock walls/ceilings
- Laundry & utility: Washer hookup; Electric dryer hookup
Neighborhood map
What this means for you Summary
Snapshot
- This is a 3-bed/1.0-bath single-family listed at $88k.
Deal economics
- At list price, monthly cash flow is $323 ($4k/yr) — positive.
- The deal already cash-flows at list — no discount required.
- Meets the 1% rule at list price ($1k rent vs $88k).
- Recommended offer: $80k (9.0% below list) — sets the bar for market timing.
- Cap rate 10.7% vs local median 4.1% in Little Rock — top-decile yield for the area; either an underpriced asset or a hidden risk that comps aren't pricing in. Stress-test before assuming the spread holds.
Location & tenants
- Location reads 73/100 on livability (#22 in AR) — a middle-class / working-renter tenant base. Strengths: commute A+, cost of living A+, housing A+; Watch: crime F.
- Little Rock School District (urban): math 23% / reading 26% proficiency, ranked #183 of 238 in AR (top 77%) — low school quality limits family demand, transient renter base, plan for 1-2y turnover; 69% free/reduced lunch — lower-income household profile, screen leases tightly.
- Zoned schools: Cloverdale Middle School (math 4% / reading 6%, grade F, #201 of 201 statewide, top 100%, 665 students, 84% FRL) — zoned schools average 84% FRL vs 69% district-wide (15 pts higher); higher-poverty schools than district average — tighter screening recommended.
- Zoned-school proficiency averages 5% at this address vs 24% district-wide (-20 pts) — the specific schools serving this property underperform the Little Rock School District average; the district grade overstates school quality for this exact location.
- Market conditions: Rents rising fast (+4.8%/yr); 86 active listings in the ZIP; 9 comparable units currently listed for rent nearby; rentals lingering (median 45d on market — plan ~5-8 weeks vacancy on turnover, expect pricing pressure); 67% of comp listings sitting > 30 days — soft ceiling on asking rent; lower-income renter base — watch delinquency; 1,006 units permitted in Pulaski County in 2024 (0 in 5+ unit buildings).
- This rent runs 33% of the median local income ($40k/yr) — at the standard rent-burdened threshold; future hikes will face affordability resistance.
Forward outlook
- Local home prices are declining (-3.0%/yr); year-one equity from $608 of loan paydown is wiped out by about $3k of value loss. Plan a longer hold.
- Pulaski County population projected at +6% by 2050 — modest demand growth; plan on rents tracking national, not racing it.
- At projected returns (-3.0% appreciation + 4.8% rent growth), your $25k cash investment doubles in ~7 years — after that, you're playing with house money.
Negotiation context
- It's been on market 113 days — a 9% lower offer ($80k) is reasonable based on typical stale-listing flexibility.
- 2 sale attempts with the ask held roughly flat each time — persistent listings suggest the price (not the market) is what's stuck; bring a comps-based counter.
Risks & watch-outs
- Climate carrying-cost: extreme-heat days projected 7→19/yr by 2055 (HVAC capex compounding) — expect insurance premiums to compound above CPI over the hold.
Questions for the listing agent
- It's been on market 113 days. Have you received any prior offers? Is the seller open to a 9% concession, seller financing, or rate buy-down credit?
- Built in 1961 — when were the roof, HVAC, electrical panel, plumbing, and water heater last replaced?
- Why hasn't it sold? Are there any deal-killer items the seller is aware of (foundation, flood, title, zoning, code violations)?
- Is there a deadline driving the sale (1031 exchange, divorce, estate, relocation)? That informs how much negotiation room exists.
- Crime grade is F in this area — have there been break-ins, vandalism, or insurance claims at this property in the last 3 years? What carrier currently insures it and at what premium?
- What's the average days-on-market for RENTAL listings here right now (not sales)? A rising rental-DOM trend means longer vacancies and softer asking-rent achievability than the comps imply.
- What's the recent tenant-quality profile in this submarket — average credit score on applications, eviction rate, late-payment / NSF rate, and stable-employment percentage? A property-management company in the area should have these aggregated.
- How much new for-sale + rental construction is in the pipeline within 1–3 miles? Heavy new supply typically softens prices + rents 12–24 months out; constrained supply supports both.
Investment metrics
- 1% rule
- 1.27% ✓
- Cap rate
- 10.69%
- Cash-on-cash
- 15.72%
- DSCR
- 1.70
- GRM
- 6.6
CMA / ARV
- ARV (on-the-fly)
- $76,368
- Comps found
- 10
Show comp detail 10 sales within ~0.75 mi
| Address | Dist | Beds/Ba | Sqft | Sold | Price | $/sf | Match |
|---|---|---|---|---|---|---|---|
| 30 Elmhurst Dr | 0.00mi | 3/1.0 | 888 (0%) | 1mo | $76,300 | $86 | 99 |
| 105 Lancaster Rd | 0.38mi | 3/1.0 | 912 (+3%) | 4mo | $100,000 | $110 | 74 |
| 5504 W 51st St | 0.24mi | 2/1.0 (-1) | 832 (-6%) | 14mo | $25,000 | $30 | 61 |
| 5012 Gum Springs Rd | 0.17mi | 3/1.5 | 962 (+8%) | 18mo | $57,510 | $60 | 61 |
| 23 Rolling Lane Dr | 0.26mi | 2/1.0 (-1) | 840 (-5%) | 15mo | $78,000 | $93 | 61 |
| 5205 Primrose Ln | 0.36mi | 3/1.5 | 903 (+2%) | 23mo | $77,000 | $85 | 59 |
| 38 Southern Oaks | 0.65mi | 2/1.0 (-1) | 888 (0%) | 16mo | $60,000 | $68 | 52 |
| 5805 Hopson Dr | 0.67mi | 3/1.5 | 912 (+3%) | 15mo | $73,000 | $80 | 50 |
| 6 Woodcrest Ct | 0.71mi | 3/1.5 | 912 (+3%) | 24mo | $123,500 | $135 | 40 |
| 12 Allyson Cir | 0.63mi | 3/1.0 | 988 (+11%) | 19mo | $127,000 | $129 | 36 |
Match score weights: distance 35% · size 25% · config 20% · recency 20%. Top-matched comps best support the ARV.
Projected returns pro-forma
-3.0% appreciation · 4.78% rent growth · sell at horizon
- IRR
- 8.4%
- Equity multiple
- 1.34×
- Total profit
- $8,324
- Equity at exit
- $13,121
- IRR
- 19.1%
- Equity multiple
- 2.72×
- Total profit
- $42,340
- Equity at exit
- $7,609
Cash invested: $24,640 (down + closing). Projections, not guarantees.
Landlord ↔ Tenant lean methodology
- Overall (STATE)
- 92 Strongly Landlord-Friendly
- State Arkansas
- 92 Strongly Landlord-Friendly · R+14
- County
- — inherits STATE
- City
- — inherits STATE
ZIP-level market 72209
- Rents YoY
- 4.8%
- Active inventory
- 86
- Price-to-rent
- 6.6×
Monthly cashflow live
- Estimated rent
- $1,118 high interval (Pro) →
- Mortgage (P&I)
- −$461
- Tax from tax record
- −$62 /mo · $746/yr
- Insurance
- −$37
- HOA
- −$0
- Vacancy / Maint / Mgmt
- −$235
- Net cashflow
- $323
Break-even live
Sensitivity live
| Price | -10% $373 | -5% $348 | +0% $323 | +5% $298 | +10% $273 |
|---|---|---|---|---|---|
| Rent | -10% $234 | -5% $279 | +0% $323 | +5% $367 | +10% $411 |
| Rate | -1.0pp $367 | -0.5pp $345 | base $323 | +0.5pp $300 | +1.0pp $277 |
UW: 25.0% down · 7.5% · 30yr · 1.5% tax · 5.0% vac · 8.0% maint · 8.0% mgmt
Financing live
Cash to close
- Down payment
- $22,000
- Closing costs
- $2,640
- Reserves months
- —
- Total cash needed
- —
Loan-product check · same deal, 3 products live
Conventional
25% down · 7.5% · 30yr
- Down + closing
- —
- Monthly P&I
- —
- Monthly cashflow
- —
- DSCR
- —
- Eligible?
- —
Personal DTI + credit; lowest rate.
DSCR
20% down · 8.5% · 30yr
- Down + closing
- —
- Monthly P&I
- —
- Monthly cashflow
- —
- DSCR
- —
- Eligible?
- —
No personal income docs; deal must DSCR.
Hard money
10% down · 12.0% · 12mo
- Down + closing
- —
- Monthly P&I
- —
- Monthly cashflow
- —
- DSCR
- —
- Eligible?
- —
Short-term bridge; refi at stabilization.
Rent comps 9 comps
| Address | Beds | Baths | Sqft | Rent | $/sqft | DOM | Units | Dist |
|---|---|---|---|---|---|---|---|---|
| 15 Rolling Ln Little Rock, AR | 3.0 | 1.0 | 1100 | $1,000 | $0.91 | 45d | 1 | 0.28mi |
| 5801 W 59th St Little Rock, AR | 3.0 | 1.0 | 973 | $1,173 | $1.21 | 45d | 1 | 0.72mi |
| 15 Timber Ln Little Rock, AR | 3.0 | 1.5 | 925 | $975 | $1.05 | 45d | 1 | 0.82mi |
| 6320 Butler Rd Apt 3E Little Rock, AR | 2.0 | 1.0 | 609 | $750 | $1.23 | 45d | 1 | 0.87mi |
| 21 Harrow Dr Little Rock, AR | 3.0 | 1.0 | 875 | $800 | $0.91 | 15d | 1 | 1.21mi |
| 7 Harrow Dr Little Rock, AR | 3.0 | 1.0 | 875 | $1,095 | $1.25 | 20d | 1 | 1.23mi |
| 3415 Town & Country Ave Little Rock, AR | 2.0 | 1.0 | 645 | $675 | $1.05 | 45d | 1 | 1.32mi |
| 24 Edgemont Dr Little Rock, AR | 3.0 | 1.5 | 1008 | $1,150 | $1.14 | 25d | 1 | 1.44mi |
| 7305 E Wakefield Dr Little Rock, AR | 3.0 | 1.5 | 1056 | $1,150 | $1.09 | 45d | 1 | 1.49mi |
Listing history 5 events
-
2026-04-21status Under Contract
-
2026-03-22status Back on Market
-
2026-03-19historical
-
2026-01-19historical Take Backups
-
2025-12-27$88,000 New Listing
ⓘ Source: listings_history table (triggers on properties + properties_extension) + one-shot
backfill from property_details.listing_events for pre-trigger history.
Tax reassessment forecast AR · Resets to sale price
- Current annual tax
- $746 · $62/mo
- Projected year-2 tax
- $746 · $62/mo
- Expected delta
- $0/yr ($0/mo · 0.0%)
ⓘ Screening estimate from a state-policy table — verify with the county assessor before closing.
Climate risk First Street
- Flood 1/10 Low FEMA zone X (unshaded) · 0% chance over 30 yrs
- Wildfire 2/10 Low
- Heat 7/10 Severe 7 d/yr ≥110°F today · 19 d/yr by 30 yrs out
- Wind 4/10 Moderate 10% chance of damaging wind over 30 yrs
- Air quality 2/10 Low 1 unhealthy d/yr today · 1 by 30 yrs out
Nearby sold comps map
Loading sold comps map…
Walkable amenities ~0.75 mi
Loading nearby amenities…
Taxation est. · year 1
- Rental income
- $13,414
- − Mortgage interest
- −$4,929
- − Property taxes
- −$746
- − Insurance
- −$440
- − Repairs & maintenance
- −$1,073
- − Management
- −$1,073
- − Depreciation
- −$2,560
- Taxable income
- $2,593
- Est. tax owed @ 24.0%
- −$622
- After-tax cash flow
- $3,251/yr
For passive investors: Depreciation is non-cash, so a rental often shows a tax loss while cash-flowing — sheltering income. Rental losses are passive: they offset passive income freely, and up to $25,000/yr can offset ordinary (W-2) income if you actively participate and your MAGI is under $100k (phasing out to $0 by $150k); unused losses carry forward. On sale, claimed depreciation is recaptured at up to 25%, and gains may owe capital-gains tax (a 1031 exchange can defer both). Figures are a year-1 estimate at your 24.0% rate — not tax advice; consult a CPA.
Schools (NCES district)
- District
- Little Rock School District
- NCES district ID
- 0509000
- Math proficiency
- 23% ▼ -12.00%
- Reading proficiency
- 26% ▼ -8.00%
- Median HH income
- $43,346
- Composite
- 21.0/100
- National rank
- #8457
- State rank
- #183 of 238 in AR
Livability — Little Rock
- Score
- 73/100
- State rank
- #22
- US rank
- #5295
Category grades
Schools grade is shown separately in the Schools card above.
Census & demographics
- Census place
- Little Rock, AR
- County
- Pulaski County · 372,764 people
- City population
- 218,896
- Metro
- Little Rock-North Little Rock-Conway, AR
- Population (ZIP)
- 31,607
- Household income
- $40,231
- Rent vs Own
- Severe rent burden
- 1510.0
Population outlook (Pulaski County) Hauer SSP2
- Today (2025)
- 415,378 people
- By 2030
- 423,720 · +2.0%
- By 2040
- 435,182 · +4.8%
- By 2050
- 440,904 · +6.1%
- By 2075
- 445,521 · +7.3%
- By 2100
- 419,173 · +0.9%
Race, ethnicity, and origin ACS 2023
- Neighborhood character
- Diverse neighborhood (Simpson 0.56)
- Race & ethnicity
- Black 57% Hispanic / Latino 33% Two or more races 15% White 8%
- Hispanic origin (detail)
- Mexican 21%
- Foreign-born
- 14% · Canada
- Languages at home
- 70% English-only · Spanish 29%
Political lean MEDSL · Pulaski
- 2024 margin
- Strong D (+22.1) · D 59.8% · R 37.7% · Other 2.5%
- 2008→2024 swing
- +10.6pp toward D · 2008: 11.6pp · 2024: 22.1pp
- All cycles
- 2024: D+22.1 2020: D+22.5 2016: D+17.9 2012: D+11.4 2008: D+11.6
Not yet ingested
- Civics
- —
Market trends
- HPI YoY
- ▼ -151.75%
- Current HPI
- 176.4492
- Rent YoY
- ▲ 4.78%
- Metro
- Little Rock-North Little Rock-Conway, AR
- State GDP YoY
- ▲ 3.80%
- F500 in state
- 10
Industry mix (Fortune 500 HQ in AR)
| Industry | F500 HQs | Revenue |
|---|---|---|
| Retail | 1 | $681B |
|
||
| Food / Agriculture | 1 | $53B |
|
||
| Retail / Energy | 1 | $22B |
|
||
| Transportation / Logistics | 1 | $12B |
|
||
| Energy | 1 | $4B |
|
||
Price history
5 events — show timeline
- 2026-04-21 Pending — CARMLS
- 2026-03-22 Relisted — CARMLS
- 2026-03-19 Listing Removed — CARMLS
- 2026-01-19 Contingent — CARMLS
- 2025-12-27 Listed $88,000 CARMLS
Property tax history
+2.0%/yrLatest (2025): $746 · +7.7% YoY. Source: county tax records.
Cash-flow waterfall
monthlySold comps — $/sqft
last 12 mo · ≤1 miLoading sold comps…