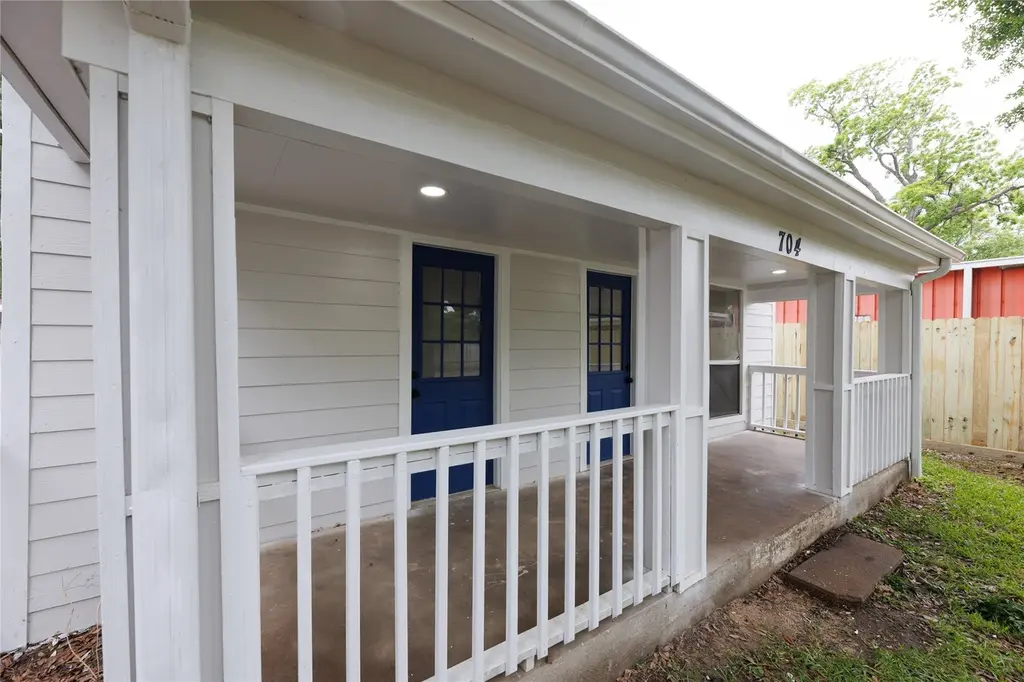
704 W Willis St · Alvin, TX
Flood risk 5/10 · Moderate
- FEMA flood zone
- X (unshaded)
- Chance of flooding over 30 yrs
- 0.58%
- Est. flood insurance / yr
- $507 – $1,088
Fire risk 3/10 · Minor
- Est. fire insurance / yr
- $1,222 – $2,270
Heat risk 9/10 · Severe
- Hot days now (above 108°F)
- 5 days/yr
- Hot days in 30 yrs
- 19 days/yr
Wind risk 9/10 · Severe
- Chance of severe wind over 30 yrs
- 99.0%
Air-quality risk 2/10 · Minimal
- Unhealthy air days now
- 1 days/yr
- Unhealthy air days in 30 yrs
- 2 days/yr
Risk factors via First Street. Map © Google.
Why this score? — see what drove the D+ grade
The composite is a weighted blend of 9 inputs, each scored 0–100. Each bar is that input's sub-score; the figure is the points it added to the 100-point composite (weight × sub-score).
- Cash flow +14.0/30.0
- ARV discount +11.9/15.0
- DSCR +4.2/10.0
- 1% rule +4.0/10.0
- Schools +3.9/10.0
- Livability +3.2/5.0
- Rent growth +3.0/5.0
- Condition / age +2.5/5.0
- Appreciation +0.0/10.0
$155,000
🖨 Deal sheet (PDF) 📄 Offer letter ✓ Due diligence
Listing remarks
Discover the perfect place to your call home at 704 W Willis Street! This is a beautifully refreshed 2-bedroom, 1-bath home. This yard fits perfectly for backyard barbecues or just enjoying your own private retreat! Freshly painted interior with thoughtful updates throughout and an open layout that brings in natural light. Located just minutes from Alvin’s best schools, shopping, and dining, this property offers small-town charm with big-time potential. Opportunities like this don’t come around often!!!
Key facts
- Thoughtful updates
- Natural light
- Open layout
Tags
Property features AI
Finance
- Other: Seller disclosure available; Lease not being considered
Exterior
- Parking: Has a 1-car garage; No additional parking features listed
- Utilities: Public water; Public sewer
- Home design: Residential property; Built in 1954; One story
- Construction: Composition roof; Pillar/Post/Pier foundation
- Exterior features: Subdivision lot
Interior
- Bedrooms: Primary bedroom on the first floor (approx. 12 x 14); Bedroom on the first floor (approx. 12 x 12)
- Bathrooms: 1 full bathroom (primary bathroom on the first floor, approx. 12 x 10)
- Heating & cooling: Central heating (electric and gas); Central air conditioning (electric and gas)
- Interior features: Total of 3 rooms
Neighborhood map
What this means for you Summary
Snapshot
- This is a 2-bed/1.0-bath single-family listed at $155k.
Deal economics
- At list price, monthly cash flow is $20 ($241/yr) — positive.
- The deal already cash-flows at list — no discount required.
- To meet the 1% rule (rent ≥ 1% of price), the offer needs to be $140k (9.5% below list).
- Recommended offer: $140k (9.5% below list) — sets the bar for 1% rule.
- Cap rate 6.4% vs local median 2.7% in Alvin — top-decile yield for the area; either an underpriced asset or a hidden risk that comps aren't pricing in. Stress-test before assuming the spread holds.
Location & tenants
- Location reads 65/100 on livability (#704 in TX) — a middle-class / working-renter tenant base. Strengths: cost of living A+, housing A+; Watch: amenities F, commute F, health & safety F.
- Alvin ISD (suburban): math 39% / reading 48% proficiency, ranked #255 of 826 in TX (top 31%) — families likely to look elsewhere, expect single-tenant / working-renter base with shorter leases.
- Zoned schools: Alvin H S (math 35% / reading 48%, grade F, #767 of 1,632 statewide, top 47%, 2,821 students, 65% FRL) — zoned schools average 65% FRL vs 48% district-wide (16 pts higher); higher-poverty schools than district average — tighter screening recommended.
- Market conditions: Rents rising (+1.9%/yr); 599 active listings in the ZIP; 8 comparable units currently listed for rent nearby; rentals at typical pace (median 26d on market — plan ~3-4 weeks tenant-placement turnaround); 3,960 units permitted in Brazoria County in 2024 (593 in 5+ unit buildings).
Forward outlook
- Local home prices are declining (-3.0%/yr); year-one equity from $1k of loan paydown is wiped out by about $5k of value loss. Plan a longer hold.
- Brazoria County population projected at +44% by 2050 — long-run rental-demand tailwind backs the buy-and-hold thesis.
Negotiation context
- Only 10 days on market — expect competitive offers; lowballing is unlikely to land.
- 5 sale attempts since 13y ago with the ask held roughly flat each time — persistent listings suggest the price (not the market) is what's stuck; bring a comps-based counter.
Risks & watch-outs
- Watch-outs: built in 1954 — expect roof / HVAC / electrical / plumbing capex.
- Climate carrying-cost: moderate flood risk; severe wind risk, 99% chance of damaging wind over 30y; extreme-heat days projected 5→19/yr by 2055 (HVAC capex compounding) — expect insurance premiums to compound above CPI over the hold.
Questions for the listing agent
- Built in 1954 — when were the roof, HVAC, electrical panel, plumbing, and water heater last replaced?
- Is there a deadline driving the sale (1031 exchange, divorce, estate, relocation)? That informs how much negotiation room exists.
- Schools are D-rated, which usually means shorter tenancies and higher turnover. Who's the typical renter profile here, and what's been the actual vacancy rate?
- The area grade is low — what's the realistic commute time and amenity access for the typical tenant pool here? Any planned neighborhood developments (good or bad) we should know about?
- What's the average days-on-market for RENTAL listings here right now (not sales)? A rising rental-DOM trend means longer vacancies and softer asking-rent achievability than the comps imply.
- What's the recent tenant-quality profile in this submarket — average credit score on applications, eviction rate, late-payment / NSF rate, and stable-employment percentage? A property-management company in the area should have these aggregated.
- How much new for-sale + rental construction is in the pipeline within 1–3 miles? Heavy new supply typically softens prices + rents 12–24 months out; constrained supply supports both.
Investment metrics
- 1% rule
- 0.90% ✗
- Cap rate
- 6.45%
- Cash-on-cash
- 0.56%
- DSCR
- 1.02
- GRM
- 9.2
CMA / ARV
- ARV (on-the-fly)
- $171,600
- Comps found
- 3
Show comp detail 3 sales within ~0.75 mi
| Address | Dist | Beds/Ba | Sqft | Sold | Price | $/sf | Match |
|---|---|---|---|---|---|---|---|
| 506 W Blum St | 0.22mi | 2/1.0 | 820 (+5%) | 12mo | $180,000 | $220 | 71 |
| 918 W Lang St | 0.29mi | 2/1.0 | 878 (+13%) | 6mo | $309,750 | $353 | 60 |
| 1301 Fairview Dr | 0.63mi | 2/1.0 | 879 (+13%) | 1mo | $189,900 | $216 | 49 |
Match score weights: distance 35% · size 25% · config 20% · recency 20%. Top-matched comps best support the ARV.
Projected returns pro-forma
-3.0% appreciation · 1.87% rent growth · sell at horizon
- IRR
- -16.7%
- Equity multiple
- 0.42×
- Total profit
- $-25,384
- Equity at exit
- $23,111
- IRR
- -10.7%
- Equity multiple
- 0.39×
- Total profit
- $-26,655
- Equity at exit
- $13,402
Cash invested: $43,400 (down + closing). Projections, not guarantees.
Landlord ↔ Tenant lean methodology
- Overall (STATE)
- 87 Strongly Landlord-Friendly
- State Texas
- 87 Strongly Landlord-Friendly · R+5
- County
- — inherits STATE
- City
- — inherits STATE
ZIP-level market 77511
- Home prices YoY
- -18.6%
- Rents YoY
- 1.9%
- Active inventory
- 599
- Price-to-rent
- 9.2×
Monthly cashflow live
- Estimated rent
- $1,403 high interval (Pro) →
- Mortgage (P&I)
- −$813
- Tax from tax record
- −$211 /mo · $2,526/yr
- Insurance
- −$65
- HOA
- −$0
- Vacancy / Maint / Mgmt
- −$295
- Net cashflow
- $20
Break-even live
Sensitivity live
| Price | -10% $108 | -5% $64 | +0% $20 | +5% $-24 | +10% $-68 |
|---|---|---|---|---|---|
| Rent | -10% $-91 | -5% $-35 | +0% $20 | +5% $75 | +10% $131 |
| Rate | -1.0pp $98 | -0.5pp $59 | base $20 | +0.5pp $-20 | +1.0pp $-61 |
UW: 25.0% down · 7.5% · 30yr · 1.5% tax · 5.0% vac · 8.0% maint · 8.0% mgmt
Financing live
Cash to close
- Down payment
- $38,750
- Closing costs
- $4,650
- Reserves months
- —
- Total cash needed
- —
Loan-product check · same deal, 3 products live
Conventional
25% down · 7.5% · 30yr
- Down + closing
- —
- Monthly P&I
- —
- Monthly cashflow
- —
- DSCR
- —
- Eligible?
- —
Personal DTI + credit; lowest rate.
DSCR
20% down · 8.5% · 30yr
- Down + closing
- —
- Monthly P&I
- —
- Monthly cashflow
- —
- DSCR
- —
- Eligible?
- —
No personal income docs; deal must DSCR.
Hard money
10% down · 12.0% · 12mo
- Down + closing
- —
- Monthly P&I
- —
- Monthly cashflow
- —
- DSCR
- —
- Eligible?
- —
Short-term bridge; refi at stabilization.
Rent comps 8 comps
| Address | Beds | Baths | Sqft | Rent | $/sqft | DOM | Units | Dist |
|---|---|---|---|---|---|---|---|---|
| 410 S 2nd St Alvin, TX | 2.0 | 1.0 | 800 | $1,020 | $1.27 | 17d | 2 | 0.47mi |
| 1318 W Blum St Alvin, TX | 2.0 | 1.0 | 768 | $1,200 | $1.56 | 45d | 1 | 0.49mi |
| 1521 W Blum St Alvin, TX | 2.0 | 2.0 | 1044 | $1,650 | $1.58 | 26d | 1 | 0.63mi |
| 1521 W Blum St Alvin, TX | 2.0 | 2.0 | 1044 | $1,650 | $1.58 | 0d | 1 | 0.63mi |
| 13304 County Road 190 Alvin, TX | 3.0 | 1.0 | 1100 | $1,800 | $1.64 | 17d | 1 | 0.86mi |
| 13298 County Road 190 Alvin, TX | 3.0 | 1.0 | 1100 | $1,800 | $1.64 | 26d | 1 | 0.87mi |
| 821 E House St Alvin, TX | 1.0 | 1.0 | 615 | $925 | $1.50 | 0d | 5 | 0.91mi |
| 1607 W South St Alvin, TX | 2.0 | 1.0 | 808 | $975 | $1.21 | 45d | 1 | 1.26mi |
Listing history 8 events
-
2026-06-21days on market $155,000 Active 10 DOM
-
2026-06-18days on market $155,000 Active 7 DOM
-
2026-06-17days on market $155,000 Active 6 DOM
-
2026-06-16days on market $155,000 Active 5 DOM
-
2026-06-15days on market $155,000 Active 4 DOM
-
2026-06-13days on market $155,000 Active 2 DOM
-
2026-06-13remarks 508-char remark
-
2026-06-13$155,000 Active 1 DOM
ⓘ Source: listings_history table (triggers on properties + properties_extension) + one-shot
backfill from property_details.listing_events for pre-trigger history.
Tax reassessment forecast TX · Resets to sale price
- Current annual tax
- $2,526 · $211/mo
- Projected year-2 tax
- $2,836 · $236/mo
- Expected delta
- +$310/yr (+$26/mo · 12.3%)
ⓘ Screening estimate from a state-policy table — verify with the county assessor before closing.
Climate risk First Street
- Flood 5/10 Major FEMA zone X (unshaded) · 58% chance over 30 yrs
- Wildfire 3/10 Moderate
- Heat 9/10 Extreme 5 d/yr ≥108°F today · 19 d/yr by 30 yrs out
- Wind 9/10 Extreme 99% chance of damaging wind over 30 yrs
- Air quality 2/10 Low 1 unhealthy d/yr today · 2 by 30 yrs out
Nearby sold comps map
Loading sold comps map…
Walkable amenities ~0.75 mi
Loading nearby amenities…
Taxation est. · year 1
- Rental income
- $16,830
- − Mortgage interest
- −$8,682
- − Property taxes
- −$2,526
- − Insurance
- −$775
- − Repairs & maintenance
- −$1,346
- − Management
- −$1,346
- − Depreciation
- −$4,509
- Taxable loss
- −$2,355
- Est. tax savings @ 24.0%
- +$565
- After-tax cash flow
- $806/yr
For passive investors: Depreciation is non-cash, so a rental often shows a tax loss while cash-flowing — sheltering income. Rental losses are passive: they offset passive income freely, and up to $25,000/yr can offset ordinary (W-2) income if you actively participate and your MAGI is under $100k (phasing out to $0 by $150k); unused losses carry forward. On sale, claimed depreciation is recaptured at up to 25%, and gains may owe capital-gains tax (a 1031 exchange can defer both). Figures are a year-1 estimate at your 24.0% rate — not tax advice; consult a CPA.
Schools (NCES district)
- District
- Alvin ISD
- NCES district ID
- 4808090
- Math proficiency
- 39% ▼ -11.00%
- Reading proficiency
- 48% ▬ 0.00%
- Median HH income
- $66,740
- Composite
- 38.96/100
- National rank
- #4080
- State rank
- #255 of 826 in TX
Livability — Alvin
- Score
- 65/100
- State rank
- #704
- US rank
- #13148
Category grades
Schools grade is shown separately in the Schools card above.
Census & demographics
- Census place
- Alvin, TX
- County
- Brazoria County · 374,982 people
- City population
- 51,892
- Metro
- Houston-The Woodlands-Sugar Land, TX
- Population (ZIP)
- 51,892
- Household income
- $74,939
- Rent vs Own
- Severe rent burden
- 923.0
Population outlook (Brazoria County) Hauer SSP2
- Today (2025)
- 420,414 people
- By 2030
- 457,585 · +8.8%
- By 2040
- 532,232 · +26.6%
- By 2050
- 605,399 · +44.0%
- By 2075
- 779,358 · +85.4%
- By 2100
- 883,759 · +110.2%
Race, ethnicity, and origin ACS 2023
- Neighborhood character
- Diverse neighborhood (Simpson 0.58)
- Race & ethnicity
- White 50% Hispanic / Latino 41% Two or more races 21% Black 5% Asian 1%
- Hispanic origin (detail)
- Mexican 34%
- Common ancestry
- Lithuanian 3% Italian 2% Iranian 1%
- Foreign-born
- 13% · Canada, China, Jamaica
- Languages at home
- 71% English-only · Spanish 27% Other Asian/Pacific 1%
Political lean MEDSL · Brazoria
- 2024 margin
- R (+19.7) · D 39.5% · R 59.2% · Other 1.3%
- 2008→2024 swing
- +9.9pp toward D · 2008: -29.6pp · 2024: -19.7pp
- All cycles
- 2024: R+19.7 2020: R+18.2 2016: R+24.6 2012: R+34.2 2008: R+29.6
Not yet ingested
- Civics
- —
Market trends
- HPI YoY
- ▼ -63.72%
- Current HPI
- 278.5745
- Rent YoY
- ▲ 1.87%
- Metro
- Houston-The Woodlands-Sugar Land, TX
- State GDP YoY
- ▲ 3.95%
- F500 in state
- 110
Industry mix (Fortune 500 HQ in TX)
| Industry | F500 HQs | Revenue |
|---|---|---|
| Energy | 16 | $1,198B |
|
||
| Technology | 5 | $198B |
|
||
| Engineering / Construction | 4 | $72B |
|
||
| Energy Services | 3 | $60B |
|
||
| Utilities | 3 | $41B |
|
||
| Healthcare | 2 | $330B |
|
||
Price history
+210.0% since first listed14 events — show timeline
- 2026-06-11 Listed $155,000 HARMLS
- 2026-06-09 Listed for Rent $1,600 HARMLS
- 2025-06-10 Rental Removed $1,600 HARMLS
- 2025-06-10 Listing Removed — HARMLS
- 2025-05-15 Price Changed $160,000 HARMLS
- 2025-05-07 Listed for Rent $1,600 HARMLS
- 2025-05-07 Price Changed $165,000 HARMLS
- 2025-05-06 Listed $170,000 HARMLS
- 2025-05-01 Coming Soon — HARMLS
- 2025-04-29 Sold (Public Records) — Public Records
- 2021-01-27 Sold (Public Records) — Public Records
- 2016-03-16 Sold (Public Records) — Public Records
- 2014-02-10 Listing Removed — HARMLS
- 2013-12-04 Listed $50,000 HARMLS
Property tax history
+3.1%/yrLatest (2025): $2,526 · -0.3% YoY. Source: county tax records.
Cash-flow waterfall
monthlySold comps — $/sqft
last 12 mo · ≤1 miLoading sold comps…