2746 Jasper Stone · San Antonio, TX
Flood risk No data
- FEMA flood zone
- —
- Chance of flooding over 30 yrs
- —
- Est. flood insurance / yr
- —
Fire risk No data
- Est. fire insurance / yr
- —
Heat risk No data
- Hot days now (above threshold)
- —
- Hot days in 30 yrs
- —
Wind risk No data
- Chance of severe wind over 30 yrs
- —
Air-quality risk No data
- Unhealthy air days now
- —
- Unhealthy air days in 30 yrs
- —
Risk factors via First Street. Map © Google.
Why this score? — see what drove the D+ grade
The composite is a weighted blend of 9 inputs, each scored 0–100. Each bar is that input's sub-score; the figure is the points it added to the 100-point composite (weight × sub-score).
- Cash flow +12.8/30.0
- ARV discount +9.2/15.0
- Appreciation +7.0/10.0
- Condition / age +4.8/5.0
- Livability +4.0/5.0
- 1% rule +3.8/10.0
- DSCR +3.8/10.0
- Rent growth +2.5/5.0
- Schools +1.8/10.0
$163,999
🖨 Deal sheet (PDF) 📄 Offer letter ✓ Due diligence
Listing remarks
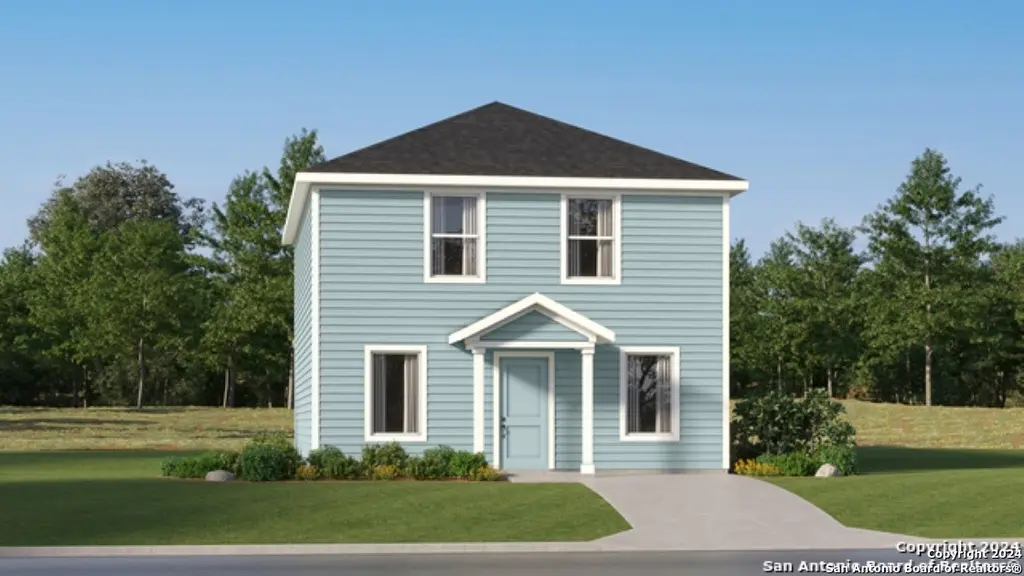
The Highgate - Upon entry of this spacious two-story home are the family room, dining room and a chef-ready kitchen arranged in a desirable open floorplan that promotes seamless transition between spaces. Down the hallway is the tranquil owner s suite with a convenient adjoining bathroom. Upstairs, a sprawling game room offers endless possibilities, while on the opposite end of the floor are three secondary bedrooms. Estimated Completion June 2026. The completion date, prices and features may vary and are subject to change. Please verify with Lennar directly. Photos are for illustrative purposes only.
Key facts
- 4,791 sq ft lot
- Built 2026
- Listed 34 days
Property features AI
Finance
- Financial info: Down payment assistance resource available
- HOA & community: Mandatory HOA; HOA fee $67.50 quarterly; Association transfer fee $450
Exterior
- Utilities: Natural gas supplied by Unigas; Electricity supplied by CPS; City water and sewer; Garbage service by Frontier
- Home design: New construction by Lennar; Cement fiber exterior; Composition roof; Slab foundation
- Construction: Built new (approximate age 0)
- Exterior features: Privacy fence; Subdivision: Ruby Crossing
Interior
- Kitchen: Stove/Range; Dishwasher; Breakfast bar
- Bedrooms: Master bedroom on lower level with walk-in closet and full bath; Bedroom 2 — 10 x 12; Bedroom 3 — 10 x 13; Bedroom 4 — 14 x 10; Master bedroom dimensions 13 x 11
- Flooring: Carpeting; Vinyl flooring
- Bathrooms: Total of 3 bathrooms (2 full, 1 half); Master bath with shower only
- Heating & cooling: Central heating; Electric and natural gas heating options; Central air conditioning
- Interior features: Open floor plan; Breakfast bar; Game room; Utility room inside; Cable TV available; Laundry on main level; Walk-in closets; Washer and dryer hookups; Stove/Range; Dishwasher
- Laundry & utility: Washer connection; Dryer connection; Laundry located on main level; Utility room inside
Neighborhood map
What this means for you Summary
Snapshot
- This is a 4-bed/2.5-bath single-family listed at $164k. Condition is rated excellent.
Deal economics
- At list price, monthly cash flow is $-15 ($-183/yr) — negative.
- To cash-flow at today's rent, offer at most $162k (1.3% below list).
- To meet the 1% rule (rent ≥ 1% of price), the offer needs to be $144k (12.0% below list).
- Recommended offer: $144k (12.0% below list) — sets the bar for 1% rule.
- Cap rate 6.2% vs local median 3.8% in San Antonio — top-decile yield for the area; either an underpriced asset or a hidden risk that comps aren't pricing in. Stress-test before assuming the spread holds.
Location & tenants
- Location reads 80/100 on livability (#31 in TX, #1,616 nationally) — a professional / high-income tenant draw. Strengths: amenities A+, commute A+, cost of living A+; Watch: crime F.
- Southside ISD (rural): math 16% / reading 25% proficiency, ranked #771 of 826 in TX (top 93%) — low school quality limits family demand, transient renter base, plan for 1-2y turnover; 76% free/reduced lunch — lower-income household profile, screen leases tightly.
- Zoned schools: Freedom El (math 15% / reading 26%, grade F, #3,515 of 4,322 statewide, top 82%, 562 students, 93% FRL); Julius L Matthey Middle (math 17% / reading 25%, grade F, #1,387 of 1,662 statewide, top 85%, 604 students, 92% FRL); Southside H S (math 18% / reading 25%, grade F, #1,377 of 1,632 statewide, top 85%, 1,685 students, 85% FRL).
- Market conditions: 359 active listings in the ZIP; 7 comparable units currently listed for rent nearby; rentals at typical pace (median 26d on market — plan ~3-4 weeks tenant-placement turnaround); 43% of comp listings sitting > 30 days — soft ceiling on asking rent; 8,308 units permitted in Bexar County in 2024 (2,506 in 5+ unit buildings).
Forward outlook
- In year one you build about $8k of equity ($1k loan paydown + $6k appreciation (3.9% local appreciation)).
- Bexar County population projected at +50% by 2050 — long-run rental-demand tailwind backs the buy-and-hold thesis.
- At projected returns (3.9% appreciation + 3.0% rent growth), your $46k cash investment doubles in ~6 years — after that, you're playing with house money.
- By year 5, paydown + projected appreciation supports a ~$33k cash-out refi (75% LTV) — recoverable capital for the next deal without selling this one.
Negotiation context
- It's been on market 34 days — a 3% lower offer ($159k) is reasonable based on typical stale-listing flexibility.
Questions for the listing agent
- What do current leases actually rent for vs. the listed asking? Can we see a recent rent roll and the last 12 months of T-12 income?
- It's been on market 34 days. Have you received any prior offers? Is the seller open to a 12% concession, seller financing, or rate buy-down credit?
- What does the HOA fee cover, when was the last increase, and are there any pending special assessments or reserve-fund shortfalls?
- Is there a deadline driving the sale (1031 exchange, divorce, estate, relocation)? That informs how much negotiation room exists.
- Crime grade is F in this area — have there been break-ins, vandalism, or insurance claims at this property in the last 3 years? What carrier currently insures it and at what premium?
- The area grade is low — what's the realistic commute time and amenity access for the typical tenant pool here? Any planned neighborhood developments (good or bad) we should know about?
- What's the average days-on-market for RENTAL listings here right now (not sales)? A rising rental-DOM trend means longer vacancies and softer asking-rent achievability than the comps imply.
- What's the recent tenant-quality profile in this submarket — average credit score on applications, eviction rate, late-payment / NSF rate, and stable-employment percentage? A property-management company in the area should have these aggregated.
- How much new for-sale + rental construction is in the pipeline within 1–3 miles? Heavy new supply typically softens prices + rents 12–24 months out; constrained supply supports both.
Investment metrics
- 1% rule
- 0.88% ✗
- Cap rate
- 6.18%
- Cash-on-cash
- -0.40%
- DSCR
- 0.98
- GRM
- 9.5
CMA / ARV
- ARV (median comp)
- $170,499
- List price
- $163,999
- Delta
- -3.81%
- Verdict
- FAIR
- Comps
- 20 within 1.0 mi
Show comp detail 12 sales within ~0.75 mi
| Address | Dist | Beds/Ba | Sqft | Sold | Price | $/sf | Match |
|---|---|---|---|---|---|---|---|
| 2726 Jasper Stone | 0.03mi | 4/2.5 | 1,802 (0%) | 1mo | $171,999 | $95 | 98 |
| 2714 Jasper Stone | 0.05mi | 4/2.5 | 1,802 (0%) | 2mo | $172,999 | $96 | 96 |
| 2741 Morganite Ring | 0.02mi | 4/2.5 | 1,867 (+4%) | 1mo | $222,999 | $119 | 93 |
| 2725 Morganite Ring | 0.05mi | 4/2.5 | 1,867 (+4%) | 1mo | $190,999 | $102 | 91 |
| 20502 Andalusite Way | 0.11mi | 4/2.5 | 1,897 (+5%) | 1mo | $198,999 | $105 | 85 |
| 2878 Red Diamond | 0.13mi | 4/2.5 | 1,692 (-6%) | 1mo | $185,999 | $110 | 83 |
| 20572 Andalusite Way | 0.11mi | 4/2.5 | 1,535 (-15%) | 1mo | $159,999 | $104 | 69 |
| 20622 Andalusite Way | 0.10mi | 4/2.5 | 1,535 (-15%) | 2mo | $179,999 | $117 | 69 |
| 20536 Andalusite Way | 0.11mi | 4/2.5 | 1,535 (-15%) | 1mo | $159,999 | $104 | 69 |
| 20560 Andalusite Way | 0.11mi | 4/2.5 | 1,535 (-15%) | 2mo | $159,999 | $104 | 69 |
| 3012 Carnelian Trl | 0.15mi | 4/2.5 | 1,535 (-15%) | 3mo | $159,999 | $104 | 66 |
| 2922 Carnelian Trl | 0.15mi | 4/2.5 | 1,535 (-15%) | 3mo | $156,999 | $102 | 66 |
Match score weights: distance 35% · size 25% · config 20% · recency 20%. Top-matched comps best support the ARV.
Projected returns pro-forma
3.94% appreciation · 3.0% rent growth · sell at horizon
- IRR
- 9.8%
- Equity multiple
- 1.59×
- Total profit
- $27,173
- Equity at exit
- $82,624
- IRR
- 11.7%
- Equity multiple
- 2.92×
- Total profit
- $88,251
- Equity at exit
- $134,721
Cash invested: $45,920 (down + closing). Projections, not guarantees.
Landlord ↔ Tenant lean methodology
- Overall (STATE)
- 87 Strongly Landlord-Friendly
- State Texas
- 87 Strongly Landlord-Friendly · R+5
- County
- — inherits STATE
- City
- — inherits STATE
ZIP-level market 78264
- Home prices YoY
- 1.3%
- Active inventory
- 359
- Price-to-rent
- 9.5×
Monthly cashflow live
- Estimated rent
- $1,443 high interval (Pro) →
- Mortgage (P&I)
- −$860
- Tax est. 1.5%
- −$205 /mo · $2,460/yr
- Insurance
- −$68
- HOA
- −$22
- Vacancy / Maint / Mgmt
- −$303
- Net cashflow
- $-15
Break-even live
Sensitivity live
| Price | -10% $98 | -5% $41 | +0% $-15 | +5% $-72 | +10% $-129 |
|---|---|---|---|---|---|
| Rent | -10% $-129 | -5% $-72 | +0% $-15 | +5% $42 | +10% $99 |
| Rate | -1.0pp $67 | -0.5pp $27 | base $-15 | +0.5pp $-58 | +1.0pp $-101 |
UW: 25.0% down · 7.5% · 30yr · 1.5% tax · 5.0% vac · 8.0% maint · 8.0% mgmt
Financing live
Cash to close
- Down payment
- $41,000
- Closing costs
- $4,920
- Reserves months
- —
- Total cash needed
- —
Loan-product check · same deal, 3 products live
Conventional
25% down · 7.5% · 30yr
- Down + closing
- —
- Monthly P&I
- —
- Monthly cashflow
- —
- DSCR
- —
- Eligible?
- —
Personal DTI + credit; lowest rate.
DSCR
20% down · 8.5% · 30yr
- Down + closing
- —
- Monthly P&I
- —
- Monthly cashflow
- —
- DSCR
- —
- Eligible?
- —
No personal income docs; deal must DSCR.
Hard money
10% down · 12.0% · 12mo
- Down + closing
- —
- Monthly P&I
- —
- Monthly cashflow
- —
- DSCR
- —
- Eligible?
- —
Short-term bridge; refi at stabilization.
Rent comps 7 comps
| Address | Beds | Baths | Sqft | Rent | $/sqft | DOM | Units | Dist |
|---|---|---|---|---|---|---|---|---|
| 20622 Andalusite Way San Antonio, TX | 4.0 | 2.5 | 1535 | $1,400 | $0.91 | 0d | 1 | 0.11mi |
| 2906 Carnelian Trl San Antonio, TX | 3.0 | 2.0 | 1360 | $1,550 | $1.14 | 45d | 1 | 0.18mi |
| 20447 Red Coral San Antonio, TX | 3.0 | 2.0 | 1230 | $1,320 | $1.07 | 26d | 1 | 0.20mi |
| 2807 Ruby Xing San Antonio, TX | 3.0 | 2.0 | 1276 | $1,400 | $1.10 | 26d | 1 | 0.34mi |
| 20335 Campbellton Rd San Antonio, TX | 3.0 | 2.0 | 1393 | $1,450 | $1.04 | 45d | 1 | 0.64mi |
| 20823 Pinon Grv San Antonio, TX | 3.0 | 2.0 | 1403 | $1,650 | $1.18 | 45d | 1 | 1.04mi |
| 20414 Deets Trl San Antonio, TX | 3.0 | 2.5 | 1858 | $1,750 | $0.94 | 5d | 1 | 1.34mi |
HOA detail
- Monthly dues
- $22 · $264/yr
Listing history 18 events
-
2026-05-15price $163,999 431-char remark
-
2026-05-15price $163,999 609-char remark
-
2026-05-13price $165,999 431-char remark
-
2026-05-13price $165,999 609-char remark
-
2026-05-09price $168,999 431-char remark
-
2026-05-09price $168,999 609-char remark
-
2026-05-06price $169,999 431-char remark
-
2026-05-06price $172,999 431-char remark
-
2026-05-06price $169,999 431-char remark
-
2026-05-06price $169,999 609-char remark
-
2026-04-30price $172,999 609-char remark
-
2026-04-29price $172,999 431-char remark
-
2026-04-22price $180,999 431-char remark
-
2026-04-22price $180,999 609-char remark
-
2026-04-17price $178,999 431-char remark
-
2026-04-17$178,999 New 609-char remark
-
2026-04-13price $176,999 431-char remark
-
2026-04-12$192,999 Active 431-char remark
ⓘ Source: listings_history table (triggers on properties + properties_extension) + one-shot
backfill from property_details.listing_events for pre-trigger history.
Nearby sold comps map
Loading sold comps map…
Walkable amenities ~0.75 mi
Loading nearby amenities…
Taxation est. · year 1
- Rental income
- $17,319
- − Mortgage interest
- −$9,186
- − Property taxes
- −$2,460
- − Insurance
- −$820
- − Repairs & maintenance
- −$1,386
- − Management
- −$1,386
- − HOA
- −$264
- − Depreciation
- −$4,771
- Taxable loss
- −$2,954
- Est. tax savings @ 24.0%
- +$709
- After-tax cash flow
- $526/yr
For passive investors: Depreciation is non-cash, so a rental often shows a tax loss while cash-flowing — sheltering income. Rental losses are passive: they offset passive income freely, and up to $25,000/yr can offset ordinary (W-2) income if you actively participate and your MAGI is under $100k (phasing out to $0 by $150k); unused losses carry forward. On sale, claimed depreciation is recaptured at up to 25%, and gains may owe capital-gains tax (a 1031 exchange can defer both). Figures are a year-1 estimate at your 24.0% rate — not tax advice; consult a CPA.
Condition & rehab AI · 12 photos
This two-story home is in excellent condition with modern finishes and a spacious floor plan. It is move-in ready and would benefit from minor updates to enhance its curb appeal and interior aesthetics.
Value-add opportunities
- Both Painting the exterior and interior walls — Fresh paint can enhance curb appeal and interior aesthetics
- Both Updating the flooring in the bedrooms — New flooring can improve the look and feel of the bedrooms
- Both Upgrading the kitchen appliances — Modern appliances can increase the home's appeal and functionality
- Both Adding smart home features — Smart home features can increase convenience and appeal to potential buyers
Renovation cost estimate screening
Value-add ROI direction
- Both Painting the exterior and interior walls — Fresh paint can enhance curb appeal and interior aesthetics ↑
- Both Updating the flooring in the bedrooms — New flooring can improve the look and feel of the bedrooms ↑
- Both Upgrading the kitchen appliances — Modern appliances can increase the home's appeal and functionality ↑
- Both Adding smart home features — Smart home features can increase convenience and appeal to potential buyers ↑
ⓘ Cost ranges are severity-bucket heuristics (US national rule-of-thumb). Get contractor quotes + a written scope before underwriting a rehab budget.
Schools (NCES district)
- District
- Southside ISD
- NCES district ID
- 4840920
- Math proficiency
- 16% ▼ -15.00%
- Reading proficiency
- 25% ▼ -2.00%
- Median HH income
- $43,526
- Composite
- 17.68/100
- National rank
- #9027
- State rank
- #771 of 826 in TX
Livability — San Antonio
- Score
- 80/100
- State rank
- #31
- US rank
- #1616
Category grades
Schools grade is shown separately in the Schools card above.
Census & demographics
- City population
- 1,806,925
- Population (ZIP)
- 11,702
Population outlook (Bexar County) Hauer SSP2
- Today (2025)
- 2,336,851 people
- By 2030
- 2,560,728 · +9.6%
- By 2040
- 3,020,569 · +29.3%
- By 2050
- 3,493,522 · +49.5%
- By 2075
- 4,668,459 · +99.8%
- By 2100
- 5,533,242 · +136.8%
Race, ethnicity, and origin ACS 2023
- Neighborhood character
- Predominantly Hispanic (80%)
- Race & ethnicity
- Hispanic / Latino 80% Two or more races 35% White 17% Black 2% Native American 1%
- Hispanic origin (detail)
- Mexican 73%
- Common ancestry
- Lithuanian 1% Serbian 1% Greek 1%
- Foreign-born
- 14% · Canada
- Languages at home
- 48% English-only · Spanish 51% Tagalog/Filipino 0%
Political lean MEDSL · Bexar
- 2024 margin
- Lean D (+9.8) · D 54.3% · R 44.6% · Other 1.1%
- 2008→2024 swing
- +4.2pp toward D · 2008: 5.6pp · 2024: 9.8pp
- All cycles
- 2024: D+9.8 2020: D+18.2 2016: D+13.5 2012: D+4.6 2008: D+5.6
Not yet ingested
- Civics
- —
Market trends
- HPI YoY
- ▲ 3.94%
- Current HPI
- 298.8446
- Rent YoY
- —
- Metro
- —
- State GDP YoY
- ▲ 3.95%
- F500 in state
- 110
Industry mix (Fortune 500 HQ in TX)
| Industry | F500 HQs | Revenue |
|---|---|---|
| Energy | 16 | $1,198B |
|
||
| Technology | 5 | $198B |
|
||
| Engineering / Construction | 4 | $72B |
|
||
| Energy Services | 3 | $60B |
|
||
| Utilities | 3 | $41B |
|
||
| Healthcare | 2 | $330B |
|
||
Price history
-8.4% since first listed8 events — show timeline
- 2026-05-21 Pending — LERA
- 2026-05-15 Price Changed $163,999 LERA
- 2026-05-13 Price Changed $165,999 LERA
- 2026-05-09 Price Changed $168,999 LERA
- 2026-05-06 Price Changed $169,999 LERA
- 2026-04-30 Price Changed $172,999 LERA
- 2026-04-22 Price Changed $180,999 LERA
- 2026-04-17 Listed $178,999 LERA
Cash-flow waterfall
monthlySold comps — $/sqft
last 12 mo · ≤1 miLoading sold comps…