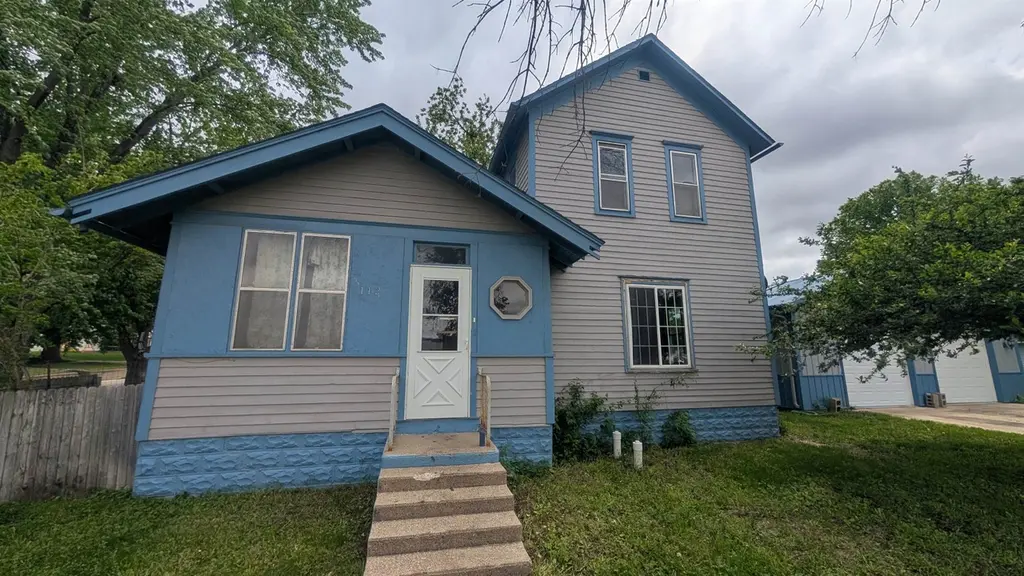
112 Pine St. St · Peterson, IA
Flood risk No data
- FEMA flood zone
- —
- Chance of flooding over 30 yrs
- —
- Est. flood insurance / yr
- —
Fire risk No data
- Est. fire insurance / yr
- —
Heat risk No data
- Hot days now (above threshold)
- —
- Hot days in 30 yrs
- —
Wind risk No data
- Chance of severe wind over 30 yrs
- —
Air-quality risk No data
- Unhealthy air days now
- —
- Unhealthy air days in 30 yrs
- —
Risk factors via First Street. Map © Google.
Why this score? — see what drove the A grade
The composite is a weighted blend of 9 inputs, each scored 0–100. Each bar is that input's sub-score; the figure is the points it added to the 100-point composite (weight × sub-score).
- Cash flow +30.0/30.0
- ARV discount +15.0/15.0
- 1% rule +10.0/10.0
- DSCR +10.0/10.0
- Appreciation +6.2/10.0
- Schools +5.9/10.0
- Livability +3.2/5.0
- Rent growth +2.5/5.0
- Condition / age +2.2/5.0
$71,999
🖨 Deal sheet (PDF) 📄 Offer letter ✓ Due diligence
Listing remarks MLS
Unique charm with endless opportunity to make it your own! This 2 bed 1.25 bath is filled with natural light from large windows and original hardwood floors and some great original trim. Sitting on large deep corner lot with newer oversized double garage; great for storage or shop use!
Key facts
- 0.32 acre lot
- 2 garage spots
- Built 1900
Tags
Neighborhood map
What this means for you Summary
Snapshot
- This is a 3-bed/2.0-bath single-family listed at $72k. Condition is rated fair.
Deal economics
- At list price, monthly cash flow is $459 ($6k/yr) — positive.
- The deal already cash-flows at list — no discount required.
- Meets the 1% rule at list price ($1k rent vs $72k).
- Recommended offer: $63k (12.0% below list) — sets the bar for market timing.
Location & tenants
- Location reads 65/100 on livability (#584 in IA) — a middle-class / working-renter tenant base. Strengths: cost of living A+, housing A+; Watch: health & safety D, schools F, amenities F.
- Sioux Central Community School District (rural): math 68% / reading 73% proficiency, ranked #143 of 289 in IA (top 50%) — strong family-tenant draw, lease renewals of 3-5y typical.
- Market conditions: 4 active listings in the ZIP; 11 units permitted in Clay County in 2024 (0 in 5+ unit buildings).
Forward outlook
- In year one you build about $2k of equity ($498 loan paydown + $2k appreciation (2.4% local appreciation)).
- Clay County population projected to shrink 6% by 2050 — rents likely to lag national; underwrite the cash flow, not the appreciation.
- At projected returns (2.4% appreciation + 3.0% rent growth), your $20k cash investment doubles in ~3 years — after that, you're playing with house money.
Negotiation context
- It's been on market 243 days — a 12% lower offer ($63k) is reasonable based on typical stale-listing flexibility.
- 2 sale attempts; this cycle's ask has dropped $11k (13%) from the opening price — seller is motivated, your offer sets the floor, not the list.
- Current owner paid $30k; list at $72k implies a 140% gain — meaningful room to come down on a strong offer.
Risks & watch-outs
- Watch-outs: built in 1900 — expect roof / HVAC / electrical / plumbing capex.
Questions for the listing agent
- It's been on market 243 days. Have you received any prior offers? Is the seller open to a 12% concession, seller financing, or rate buy-down credit?
- Have any recent inspections been done? Can we get a copy of the seller's disclosures and any deferred-maintenance estimates?
- Built in 1900 — when were the roof, HVAC, electrical panel, plumbing, and water heater last replaced?
- Why hasn't it sold? Are there any deal-killer items the seller is aware of (foundation, flood, title, zoning, code violations)?
- Is there a deadline driving the sale (1031 exchange, divorce, estate, relocation)? That informs how much negotiation room exists.
- Schools are F-rated, which usually means shorter tenancies and higher turnover. Who's the typical renter profile here, and what's been the actual vacancy rate?
- What's the average days-on-market for RENTAL listings here right now (not sales)? A rising rental-DOM trend means longer vacancies and softer asking-rent achievability than the comps imply.
- What's the recent tenant-quality profile in this submarket — average credit score on applications, eviction rate, late-payment / NSF rate, and stable-employment percentage? A property-management company in the area should have these aggregated.
- How much new for-sale + rental construction is in the pipeline within 1–3 miles? Heavy new supply typically softens prices + rents 12–24 months out; constrained supply supports both.
Investment metrics
- 1% rule
- 1.58% ✓
- Cap rate
- 13.95%
- Cash-on-cash
- 27.33%
- DSCR
- 2.22
- GRM
- 5.3
CMA / ARV
- ARV (median comp)
- $97,256
- List price
- $71,999
- Delta
- -25.97%
- Verdict
- UNDERPRICED
- Comps
- 8 within 1.0 mi
Show comp detail 1 sale within ~0.75 mi
| Address | Dist | Beds/Ba | Sqft | Sold | Price | $/sf | Match |
|---|---|---|---|---|---|---|---|
| 329 N Main St | 0.21mi | 2/1.5 (-1) | 1,332 (+7%) | 8mo | $45,000 | $34 | 66 |
Match score weights: distance 35% · size 25% · config 20% · recency 20%. Top-matched comps best support the ARV.
Projected returns pro-forma
2.38% appreciation · 3.0% rent growth · sell at horizon
- IRR
- 32.2%
- Equity multiple
- 2.77×
- Total profit
- $35,585
- Equity at exit
- $29,912
- IRR
- 33.1%
- Equity multiple
- 5.40×
- Total profit
- $88,634
- Equity at exit
- $44,267
Cash invested: $20,160 (down + closing). Projections, not guarantees.
Landlord ↔ Tenant lean methodology
- Overall (STATE)
- 83 Strongly Landlord-Friendly
- State Iowa
- 83 Strongly Landlord-Friendly · R+6
- County
- — inherits STATE
- City
- — inherits STATE
ZIP-level market 51047
- Home prices YoY
- 1.5%
- Active inventory
- 4
- Price-to-rent
- 5.3×
Monthly cashflow live
- Estimated rent
- $1,139 medium interval (Pro) →
- Mortgage (P&I)
- −$378
- Tax from tax record
- −$33 /mo · $400/yr
- Insurance
- −$30
- HOA
- −$0
- Vacancy / Maint / Mgmt
- −$239
- Net cashflow
- $459
Break-even live
Sensitivity live
| Price | -10% $500 | -5% $480 | +0% $459 | +5% $439 | +10% $418 |
|---|---|---|---|---|---|
| Rent | -10% $369 | -5% $414 | +0% $459 | +5% $504 | +10% $549 |
| Rate | -1.0pp $495 | -0.5pp $477 | base $459 | +0.5pp $440 | +1.0pp $422 |
UW: 25.0% down · 7.5% · 30yr · 1.5% tax · 5.0% vac · 8.0% maint · 8.0% mgmt
Financing live
Cash to close
- Down payment
- $18,000
- Closing costs
- $2,160
- Reserves months
- —
- Total cash needed
- —
Loan-product check · same deal, 3 products live
Conventional
25% down · 7.5% · 30yr
- Down + closing
- —
- Monthly P&I
- —
- Monthly cashflow
- —
- DSCR
- —
- Eligible?
- —
Personal DTI + credit; lowest rate.
DSCR
20% down · 8.5% · 30yr
- Down + closing
- —
- Monthly P&I
- —
- Monthly cashflow
- —
- DSCR
- —
- Eligible?
- —
No personal income docs; deal must DSCR.
Hard money
10% down · 12.0% · 12mo
- Down + closing
- —
- Monthly P&I
- —
- Monthly cashflow
- —
- DSCR
- —
- Eligible?
- —
Short-term bridge; refi at stabilization.
Listing history 24 events
-
2026-06-21days on market $71,999 Active 243 DOM
-
2026-06-18price $71,999 Active 241 DOM
-
2026-06-18days on market $74,999 Active 241 DOM
-
2026-06-17days on market $74,999 Active 240 DOM
-
2026-06-16days on market $74,999 Active 239 DOM
-
2026-06-15days on market $74,999 Active 238 DOM
-
2026-06-13days on market $74,999 Active 236 DOM
-
2026-06-12days on market $74,999 Active 235 DOM
-
2026-06-09days on market $74,999 Active 232 DOM
-
2026-06-08days on market $74,999 Active 231 DOM
-
2026-06-07days on market $74,999 Active 230 DOM
-
2026-06-07days on market $74,999 Active 229 DOM
-
2026-06-04days on market $74,999 Active 226 DOM
-
2026-06-02days on market $74,999 Active 225 DOM
-
2026-06-01days on market $74,999 Active 224 DOM
-
2026-05-31days on market $74,999 Active 223 DOM
-
2026-05-31days on market $74,999 Active 222 DOM
-
2026-04-22price $76,999 287-char remark
Show marketing remark (287 chars)
Unique charm with endless opportunity to make it your own! This 2 bed 1.25 bath is filled with natural light from large windows and original hardwood floors and some great original trim. Sitting on large deep corner lot with newer oversized double garage; great for storage or shop use!
-
2025-11-14price $79,999 287-char remark
Show marketing remark (287 chars)
Unique charm with endless opportunity to make it your own! This 2 bed 1.25 bath is filled with natural light from large windows and original hardwood floors and some great original trim. Sitting on large deep corner lot with newer oversized double garage; great for storage or shop use!
-
2025-10-20$82,500 Active 287-char remark
Show marketing remark (287 chars)
Unique charm with endless opportunity to make it your own! This 2 bed 1.25 bath is filled with natural light from large windows and original hardwood floors and some great original trim. Sitting on large deep corner lot with newer oversized double garage; great for storage or shop use!
-
2025-06-29price $86,000
-
2025-05-21$89,000 Active
-
2024-12-02soldstatus $30,000
-
2016-12-19soldstatus $39,875
ⓘ Source: listings_history table (triggers on properties + properties_extension) + one-shot
backfill from property_details.listing_events for pre-trigger history.
Tax reassessment forecast IA · Partial reset (capped growth)
- Current annual tax
- $400 · $33/mo
- Projected year-2 tax
- $765 · $64/mo
- Expected delta
- +$365/yr (+$30/mo · 91.3%)
ⓘ Screening estimate from a state-policy table — verify with the county assessor before closing.
Nearby sold comps map
Loading sold comps map…
Walkable amenities ~0.75 mi
Loading nearby amenities…
Taxation est. · year 1
- Rental income
- $13,672
- − Mortgage interest
- −$4,033
- − Property taxes
- −$400
- − Insurance
- −$360
- − Repairs & maintenance
- −$1,094
- − Management
- −$1,094
- − Depreciation
- −$2,095
- Taxable income
- $4,597
- Est. tax owed @ 24.0%
- −$1,103
- After-tax cash flow
- $4,407/yr
For passive investors: Depreciation is non-cash, so a rental often shows a tax loss while cash-flowing — sheltering income. Rental losses are passive: they offset passive income freely, and up to $25,000/yr can offset ordinary (W-2) income if you actively participate and your MAGI is under $100k (phasing out to $0 by $150k); unused losses carry forward. On sale, claimed depreciation is recaptured at up to 25%, and gains may owe capital-gains tax (a 1031 exchange can defer both). Figures are a year-1 estimate at your 24.0% rate — not tax advice; consult a CPA.
Condition & rehab AI · 12 photos
This home requires moderate renovations to improve its condition and increase its value. Key areas for improvement include the kitchen, bathrooms, HVAC system, and exterior. Upgrades in these areas will significantly enhance its resale and rental potential.
Repairs flagged
- Major Kitchen cabinets — Severe wear and tear
- Major Kitchen countertops — Severe wear and tear
- Major Kitchen appliances — Outdated and worn
- Major Bath fixtures — Old and worn
- Major Bath flooring — Worn and damaged
- Moderate Exterior siding — Worn and peeling
- Moderate Exterior paint — Worn and peeling
- Major Flooring — Worn and damaged
- Major Interior walls/paint — Worn and peeling
- Moderate HVAC system — Old and likely inefficient
Value-add opportunities
- Resale New kitchen cabinets and countertops — Modern and functional kitchen
- Resale New bath fixtures and flooring — Modern and functional bathroom
- Both New HVAC system — Energy-efficient and improved comfort
- Resale Paint exterior and replace siding — Modern and improved curb appeal
Renovation cost estimate screening
| Repair item | Severity | Est. cost |
|---|---|---|
| Kitchen cabinets · Severe wear and tear | Major | $15,000–50,000 |
| Kitchen countertops · Severe wear and tear | Major | $15,000–50,000 |
| Kitchen appliances · Outdated and worn | Major | $15,000–50,000 |
| Bath fixtures · Old and worn | Major | $15,000–50,000 |
| Bath flooring · Worn and damaged | Major | $15,000–50,000 |
| Exterior siding · Worn and peeling | Moderate | $3,000–15,000 |
| Exterior paint · Worn and peeling | Moderate | $3,000–15,000 |
| Flooring · Worn and damaged | Major | $15,000–50,000 |
| Interior walls/paint · Worn and peeling | Major | $15,000–50,000 |
| HVAC system · Old and likely inefficient | Moderate | $3,000–15,000 |
| Total estimated repair cost · 10 items | $114,000–395,000 |
Value-add ROI direction
- Resale New kitchen cabinets and countertops — Modern and functional kitchen ↑
- Resale New bath fixtures and flooring — Modern and functional bathroom ↑
- Both New HVAC system — Energy-efficient and improved comfort ↑
- Resale Paint exterior and replace siding — Modern and improved curb appeal ↑
ⓘ Cost ranges are severity-bucket heuristics (US national rule-of-thumb). Get contractor quotes + a written scope before underwriting a rehab budget.
Schools (NCES district)
- District
- Sioux Central Community School District
- NCES district ID
- 1900023
- Math proficiency
- 68% ▼ -4.00%
- Reading proficiency
- 73% ▼ -3.00%
- Median HH income
- $47,122
- Composite
- 59.49/100
- National rank
- #922
- State rank
- #143 of 289 in IA
Livability — Peterson
- Score
- 65/100
- State rank
- #584
- US rank
- #13246
Category grades
Schools grade is shown separately in the Schools card above.
Census & demographics
- Census place
- Peterson, IA
- Population (ZIP)
- 739
Population outlook (Clay County) Hauer SSP2
- Today (2025)
- 16,277 people
- By 2030
- 16,073 · -1.3%
- By 2040
- 15,638 · -3.9%
- By 2050
- 15,315 · -5.9%
- By 2075
- 15,026 · -7.7%
- By 2100
- 14,638 · -10.1%
Race, ethnicity, and origin ACS 2023
- Neighborhood character
- Predominantly White (94%)
- Race & ethnicity
- White 94% Hispanic / Latino 2% Two or more races 1%
- Common ancestry
- Portuguese 8% Slovak 4% Serbian 1%
- Foreign-born
- 2% · Canada
- Languages at home
- 99% English-only · Spanish 1%
Political lean MEDSL · Clay
- 2024 margin
- Solid R (+43.2) · D 27.8% · R 71.0% · Other 1.2%
- 2008→2024 swing
- -38.1pp toward R · 2008: -5.1pp · 2024: -43.2pp
- All cycles
- 2024: R+43.2 2020: R+38.7 2016: R+42.4 2012: R+18.7 2008: R+5.1
Not yet ingested
- Civics
- —
Market trends
- HPI YoY
- ▲ 2.38%
- Current HPI
- 165.7768
- Rent YoY
- —
- Metro
- —
- State GDP YoY
- ▲ 2.48%
- F500 in state
- 4
Industry mix (Fortune 500 HQ in IA)
| Industry | F500 HQs | Revenue |
|---|---|---|
| Financial Services | 1 | $16B |
|
||
| Retail / Convenience | 1 | $15B |
|
||
Price history
+93.1% since first listed7 events — show timeline
- 2026-04-22 Price Changed $76,999 Iowa Great Lakes BOR
- 2025-11-14 Price Changed $79,999 Iowa Great Lakes BOR
- 2025-10-20 Listed $82,500 Iowa Great Lakes BOR
- 2025-06-29 Price Changed $86,000 Iowa Great Lakes BOR
- 2025-05-21 Listed $89,000 Iowa Great Lakes BOR
- 2024-12-02 Sold (Public Records) $30,000 Public Records
- 2016-12-19 Sold (Public Records) $39,875 Public Records
Property tax history
+7.0%/yrLatest (2025): $400 · +7.0% YoY. Source: county tax records.
Cash-flow waterfall
monthlySold comps — $/sqft
last 12 mo · ≤1 miLoading sold comps…