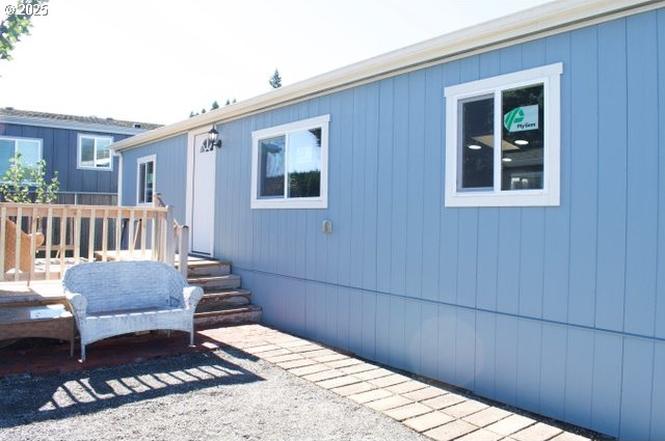
700 NE 183rd Ave #7 · Gresham, OR
Flood risk 1/10 · Minimal
- FEMA flood zone
- X (unshaded)
- Chance of flooding over 30 yrs
- 0.0%
- Est. flood insurance / yr
- $507 – $1,088
Fire risk 1/10 · Minimal
- Est. fire insurance / yr
- $498 – $926
Heat risk 3/10 · Minor
- Hot days now (above 93°F)
- 7 days/yr
- Hot days in 30 yrs
- 15 days/yr
Wind risk 1/10 · Minimal
- Chance of severe wind over 30 yrs
- —
Air-quality risk 10/10 · Severe
- Unhealthy air days now
- 23 days/yr
- Unhealthy air days in 30 yrs
- 27 days/yr
Risk factors via First Street. Map © Google.
Why this score? — see what drove the B- grade
The composite is a weighted blend of 9 inputs, each scored 0–100. Each bar is that input's sub-score; the figure is the points it added to the 100-point composite (weight × sub-score).
- Cash flow +30.0/30.0
- 1% rule +10.0/10.0
- DSCR +10.0/10.0
- ARV discount +4.6/15.0
- Livability +4.0/5.0
- Rent growth +2.7/5.0
- Schools +2.7/10.0
- Condition / age +2.5/5.0
- Appreciation +0.0/10.0
$117,800
🖨 Deal sheet (PDF) 📄 Offer letter ✓ Due diligence
Listing remarks
Back on the market, due to no fault of sellers! Beautifully remodeled 3-bedroom, 2-bath home located in the all-ages park community. This move-in ready residence features a modern kitchen, updated bathrooms, and spacious living areas. Enjoy the comfort of a fully updated interior, designed for contemporary living. Perfect for anyone seeking a stylish and affordable home in a convenient location.
Key facts
- Built 1989
- Listed 97 days
Neighborhood map
What this means for you Summary
Snapshot
- This is a 3-bed/2.0-bath manufactured listed at $118k.
Deal economics
- At list price, monthly cash flow is $747 ($9k/yr) — positive.
- The deal already cash-flows at list — no discount required.
- Meets the 1% rule at list price ($2k rent vs $118k).
- Recommended offer: $107k (9.0% below list) — sets the bar for market timing.
- Cap rate 13.9% vs local median 2.8% in Gresham — top-decile yield for the area; either an underpriced asset or a hidden risk that comps aren't pricing in. Stress-test before assuming the spread holds.
Location & tenants
- Location reads 81/100 on livability (#51 in OR, #1,537 nationally) — a professional / high-income tenant draw. Strengths: amenities A+, commute A+, health & safety A+; Watch: cost of living D, crime D-.
- Reynolds SD 7 (suburban): math 21% / reading 36% proficiency, ranked #162 of 183 in OR (top 88%) — low school quality limits family demand, transient renter base, plan for 1-2y turnover; 66% free/reduced lunch — lower-income household profile, screen leases tightly.
- Zoned schools: Hartley Elementary School (325 students, 98% FRL); Reynolds High School (2,474 students, 67% FRL) — zoned schools average 82% FRL vs 66% district-wide (17 pts higher); higher-poverty schools than district average — tighter screening recommended.
- Market conditions: Rents flat; 213 active listings in the ZIP; 40 comparable units currently listed for rent nearby; rentals at typical pace (median 19d on market — plan ~3-4 weeks tenant-placement turnaround); solid renter incomes; 2,041 units permitted in Multnomah County in 2024 (905 in 5+ unit buildings).
Forward outlook
- Local home prices are declining (-3.0%/yr); year-one equity from $814 of loan paydown is wiped out by about $4k of value loss. Plan a longer hold.
- Multnomah County population projected at +33% by 2050 — long-run rental-demand tailwind backs the buy-and-hold thesis.
- At projected returns (-3.0% appreciation + 1.0% rent growth), your $33k cash investment doubles in ~5 years — after that, you're playing with house money.
Negotiation context
- It's been on market 97 days — a 9% lower offer ($107k) is reasonable based on typical stale-listing flexibility.
- 2 sale attempts with the ask held roughly flat each time — persistent listings suggest the price (not the market) is what's stuck; bring a comps-based counter.
Questions for the listing agent
- It's been on market 97 days. Have you received any prior offers? Is the seller open to a 9% concession, seller financing, or rate buy-down credit?
- Why hasn't it sold? Are there any deal-killer items the seller is aware of (foundation, flood, title, zoning, code violations)?
- Is there a deadline driving the sale (1031 exchange, divorce, estate, relocation)? That informs how much negotiation room exists.
- Crime grade is D in this area — have there been break-ins, vandalism, or insurance claims at this property in the last 3 years? What carrier currently insures it and at what premium?
- What's the average days-on-market for RENTAL listings here right now (not sales)? A rising rental-DOM trend means longer vacancies and softer asking-rent achievability than the comps imply.
- What's the recent tenant-quality profile in this submarket — average credit score on applications, eviction rate, late-payment / NSF rate, and stable-employment percentage? A property-management company in the area should have these aggregated.
- How much new for-sale + rental construction is in the pipeline within 1–3 miles? Heavy new supply typically softens prices + rents 12–24 months out; constrained supply supports both.
Investment metrics
- 1% rule
- 1.55% ✓
- Cap rate
- 13.90%
- Cash-on-cash
- 27.19%
- DSCR
- 2.21
- GRM
- 5.4
CMA / ARV
- ARV (on-the-fly)
- $110,656
- Comps found
- 3
Show comp detail 3 sales within ~0.75 mi
| Address | Dist | Beds/Ba | Sqft | Sold | Price | $/sf | Match |
|---|---|---|---|---|---|---|---|
| 18345 NE Glisan St #2 | 0.05mi | 3/2.0 | 1,296 (-11%) | 6mo | $99,000 | $76 | 74 |
| 18345 NE Glisan St #6 | 0.05mi | 3/2.0 | 1,296 (-11%) | 19mo | $80,000 | $62 | 64 |
| 18345 NE Glisan St #3 | 0.05mi | 3/2.0 | 1,296 (-11%) | 24mo | $99,900 | $77 | 60 |
Match score weights: distance 35% · size 25% · config 20% · recency 20%. Top-matched comps best support the ARV.
Projected returns pro-forma
-3.0% appreciation · 0.99% rent growth · sell at horizon
- IRR
- 19.0%
- Equity multiple
- 1.75×
- Total profit
- $24,830
- Equity at exit
- $17,564
- IRR
- 26.0%
- Equity multiple
- 3.07×
- Total profit
- $68,424
- Equity at exit
- $10,185
Cash invested: $32,984 (down + closing). Projections, not guarantees.
Landlord ↔ Tenant lean methodology
- Overall (STATE)
- 28 Tenant-Leaning
- State Oregon
- 28 Tenant-Leaning · D+6
- County
- — inherits STATE
- City
- — inherits STATE
ZIP-level market 97230
- Rents YoY
- 1.0%
- Active inventory
- 213
- Price-to-rent
- 5.4×
Monthly cashflow live
- Estimated rent
- $1,831 high interval (Pro) →
- Mortgage (P&I)
- −$618
- Tax from tax record
- −$32 /mo · $386/yr
- Insurance
- −$49
- HOA
- −$0
- Vacancy / Maint / Mgmt
- −$384
- Net cashflow
- $747
Break-even live
Sensitivity live
| Price | -10% $814 | -5% $781 | +0% $747 | +5% $714 | +10% $681 |
|---|---|---|---|---|---|
| Rent | -10% $603 | -5% $675 | +0% $747 | +5% $820 | +10% $892 |
| Rate | -1.0pp $807 | -0.5pp $777 | base $747 | +0.5pp $717 | +1.0pp $686 |
UW: 25.0% down · 7.5% · 30yr · 1.5% tax · 5.0% vac · 8.0% maint · 8.0% mgmt
Financing live
Cash to close
- Down payment
- $29,450
- Closing costs
- $3,534
- Reserves months
- —
- Total cash needed
- —
Loan-product check · same deal, 3 products live
Conventional
25% down · 7.5% · 30yr
- Down + closing
- —
- Monthly P&I
- —
- Monthly cashflow
- —
- DSCR
- —
- Eligible?
- —
Personal DTI + credit; lowest rate.
DSCR
20% down · 8.5% · 30yr
- Down + closing
- —
- Monthly P&I
- —
- Monthly cashflow
- —
- DSCR
- —
- Eligible?
- —
No personal income docs; deal must DSCR.
Hard money
10% down · 12.0% · 12mo
- Down + closing
- —
- Monthly P&I
- —
- Monthly cashflow
- —
- DSCR
- —
- Eligible?
- —
Short-term bridge; refi at stabilization.
Rent comps 40 comps
| Address | Beds | Baths | Sqft | Rent | $/sqft | DOM | Units | Dist |
|---|---|---|---|---|---|---|---|---|
| 1136 NE 181st Ave Portland, OR | 1.0–2.0 | 1.0 | 762 | $1,475 | $1.93 | 8d | 2 | 0.26mi |
| 18641 NE Everett Ct Portland, OR | 4.0 | 1.0 | 1450 | $2,500 | $1.72 | 17d | 1 | 0.27mi |
| 1210 NE 181st Ave Portland, OR | 2.0 | 1.5 | 945 | $1,250 | $1.32 | 44d | 1 | 0.27mi |
| 665 NE 178th Ave Portland, OR | 1.0–3.0 | 1.0–2.0 | 855 | $1,825 | $2.13 | 3d | 16 | 0.30mi |
| 17838 NE Multnomah Dr Unit 16 Portland, OR | 2.0 | 1.0 | 950 | $1,200 | $1.26 | 5d | 1 | 0.38mi |
| 434 NE 176th Ave Portland, OR | 2.0 | 2.0 | 1195 | $2,195 | $1.84 | 44d | 1 | 0.43mi |
| 430 NE 176th Ave Portland, OR | 2.0 | 2.0 | 1195 | $2,295 | $1.92 | 44d | 1 | 0.43mi |
| 18618 E Burnside St Portland, OR | 2.0 | 1.0–2.0 | 803 | $2,375 | $2.96 | 3d | 25 | 0.56mi |
| 17782 E Burnside St Portland, OR | 2.0–3.0 | 1.0 | 960 | $1,795 | $1.87 | 5d | 4 | 0.57mi |
| 17420 NE Halsey St Portland, OR | 2.0 | 1.5 | 1250 | $1,699 | $1.36 | 8d | 1 | 0.61mi |
| 203 SE 176th Pl Portland, OR | 2.0 | 1.0 | 1088 | $1,495 | $1.37 | 22d | 1 | 0.61mi |
| 17366 NE Halsey St Apt 112 Portland, OR | 2.0 | 2.0 | 956 | $1,795 | $1.88 | 44d | 1 | 0.65mi |
| 17366 NE Halsey St Unit 123 Portland, OR | 2.0 | 2.0 | 956 | $1,650 | $1.73 | 44d | 1 | 0.65mi |
| 17316 E Burnside St Apt 19 Portland, OR | 2.0 | 2.0 | 945 | $1,455 | $1.54 | 44d | 1 | 0.69mi |
| 459 SE 192nd Ave Portland, OR | 2.0–3.0 | 1.0–2.0 | 1065 | $1,975 | $1.85 | 4d | 7 | 0.71mi |
| 19511 NE Halsey St Portland, OR | 2.0 | 1.0 | 917 | $1,395 | $1.52 | 4d | 1 | 0.72mi |
| 16863 NE Glisan St Portland, OR | 2.0 | 1.0 | 882 | $1,400 | $1.59 | 8d | 2 | 0.73mi |
| 19100 E Burnside St Portland, OR | 1.0–2.0 | 1.0–2.0 | 863 | $1,538 | $1.78 | 44d | 1 | 0.73mi |
| 783 SE 185th Ave Portland, OR | 1.0–3.0 | 1.0–2.0 | 861 | $2,272 | $2.64 | 3d | 10 | 0.80mi |
| 17062 NE Halsey St Portland, OR | 2.0 | 1.0 | 880 | $1,250 | $1.42 | 5d | 5 | 0.80mi |
| 19849 NE Halsey St Unit 110 Portland, OR | 3.0 | 2.0 | 895 | $1,870 | $2.09 | 18d | 1 | 0.85mi |
| 16913 NE Halsey St Portland, OR | 2.0 | 2.5 | 1528 | $1,895 | $1.24 | 24d | 1 | 0.86mi |
| 18837 SE Yamhill St Portland, OR | 2.0 | 2.0 | 1051 | $1,422 | $1.35 | 4d | 5 | 0.86mi |
| 16775 NE Halsey St Unit 16775 Portland, OR | 2.0 | 1.5 | 1080 | $2,100 | $1.94 | 11d | 1 | 0.89mi |
| 19927 NE Halsey St Unit 103 Portland, OR | 3.0 | 2.5 | 1225 | $1,895 | $1.55 | 44d | 1 | 0.89mi |
| 400 SE 169th Ave Unit 402 Portland, OR | 2.0 | 1.0 | 1000 | $1,695 | $1.70 | 44d | 1 | 0.91mi |
| 16733 NE Halsey St Unit 16733 Portland, OR | 3.0 | 2.5 | 1180 | $2,300 | $1.95 | 18d | 1 | 0.92mi |
| 16705 NE Halsey St Unit 103 Portland, OR | 2.0 | 1.0 | 960 | $1,395 | $1.45 | 44d | 1 | 0.93mi |
| 16548 NE Halsey St Portland, OR | 2.0 | 1.5 | 980 | $1,625 | $1.66 | 15d | 3 | 0.96mi |
| 473 SE 169th Ave Portland, OR | 2.0–3.0 | 2.0 | 1006 | $1,995 | $1.98 | 15d | 5 | 0.97mi |
| 16964 SE Stark St Portland, OR | 2.0 | 1.5 | 945 | $1,250 | $1.32 | 44d | 1 | 0.97mi |
| 20121 SE Stark St Portland, OR | 1.0–3.0 | 1.0–2.0 | 873 | $2,150 | $2.46 | 3d | 5 | 0.98mi |
| 16503 E Burnside St Portland, OR | 1.0–3.0 | 1.0 | 797 | $1,440 | $1.81 | 44d | 1 | 0.98mi |
| 16836 SE Stark St Unit 104 Portland, OR | 2.0 | 1.0 | 900 | $1,300 | $1.44 | 24d | 1 | 0.99mi |
| 16836 SE Stark St Unit 102 Portland, OR | 2.0 | 1.5 | 900 | $1,375 | $1.53 | 15d | 1 | 0.99mi |
| 16836 SE Stark St Apt 107 Portland, OR | 2.0 | 1.0 | 900 | $1,350 | $1.50 | 12d | 1 | 0.99mi |
| 16533 NE Halsey St Unit B-212 Portland, OR | 2.0 | 1.0 | 961 | $1,895 | $1.97 | 44d | 1 | 1.00mi |
| 16533 NE Halsey St Unit A-102 Portland, OR | 2.0 | 1.0 | 928 | $1,850 | $1.99 | 44d | 1 | 1.00mi |
| 16533 NE Halsey St Unit B-414 (ADA) Portland, OR | 3.0 | 2.0 | 1176 | $2,300 | $1.96 | 24d | 1 | 1.00mi |
| 16533 NE Halsey St Unit A-408 Portland, OR | 3.0 | 2.0 | 1176 | $2,250 | $1.91 | 24d | 1 | 1.01mi |
Listing history 4 events
-
2026-02-24status Pending
-
2025-11-28status Active
-
2025-11-10status Pending
-
2025-10-31$117,800 Active
ⓘ Source: listings_history table (triggers on properties + properties_extension) + one-shot
backfill from property_details.listing_events for pre-trigger history.
Tax reassessment forecast OR · Resets to sale price
- Current annual tax
- $386 · $32/mo
- Projected year-2 tax
- $1,143 · $95/mo
- Expected delta
- +$757/yr (+$63/mo · 196.0%)
ⓘ Screening estimate from a state-policy table — verify with the county assessor before closing.
Climate risk First Street
- Flood 1/10 Low FEMA zone X (unshaded) · 0% chance over 30 yrs
- Wildfire 1/10 Low
- Heat 3/10 Moderate 7 d/yr ≥93°F today · 15 d/yr by 30 yrs out
- Wind 1/10 Low
- Air quality 10/10 Extreme 23 unhealthy d/yr today · 27 by 30 yrs out
Nearby sold comps map
Loading sold comps map…
Walkable amenities ~0.75 mi
Loading nearby amenities…
Taxation est. · year 1
- Rental income
- $21,968
- − Mortgage interest
- −$6,599
- − Property taxes
- −$386
- − Insurance
- −$589
- − Repairs & maintenance
- −$1,757
- − Management
- −$1,757
- − Depreciation
- −$3,427
- Taxable income
- $7,453
- Est. tax owed @ 24.0%
- −$1,789
- After-tax cash flow
- $7,178/yr
For passive investors: Depreciation is non-cash, so a rental often shows a tax loss while cash-flowing — sheltering income. Rental losses are passive: they offset passive income freely, and up to $25,000/yr can offset ordinary (W-2) income if you actively participate and your MAGI is under $100k (phasing out to $0 by $150k); unused losses carry forward. On sale, claimed depreciation is recaptured at up to 25%, and gains may owe capital-gains tax (a 1031 exchange can defer both). Figures are a year-1 estimate at your 24.0% rate — not tax advice; consult a CPA.
Schools (NCES district)
- District
- Reynolds SD 7
- NCES district ID
- 4110520
- Math proficiency
- 21% ▬ 0.00%
- Reading proficiency
- 36% ▬ 0.00%
- Median HH income
- $45,502
- Composite
- 27.4/100
- National rank
- #12399
- State rank
- #162 of 183 in OR
Livability — Gresham
- Score
- 81/100
- State rank
- #51
- US rank
- #1537
Category grades
Schools grade is shown separately in the Schools card above.
Census & demographics
- Census place
- Gresham, OR
- County
- Multnomah County · 786,692 people
- City population
- 86,119
- Metro
- Portland-Vancouver-Hillsboro, OR-WA
- Population (ZIP)
- 43,553
- Household income
- $75,572
- Rent vs Own
- Severe rent burden
- 2200.0
Population outlook (Multnomah County) Hauer SSP2
- Today (2025)
- 930,825 people
- By 2030
- 996,904 · +7.1%
- By 2040
- 1,121,379 · +20.5%
- By 2050
- 1,242,124 · +33.4%
- By 2075
- 1,464,431 · +57.3%
- By 2100
- 1,576,181 · +69.3%
Race, ethnicity, and origin ACS 2023
- Neighborhood character
- Diverse neighborhood (Simpson 0.69)
- Race & ethnicity
- White 49% Hispanic / Latino 20% Two or more races 15% Asian 11% Black 10% Pacific Islander 2%
- Hispanic origin (detail)
- Mexican 16%
- Common ancestry
- Portuguese 3% Slovak 2% Italian 2%
- Foreign-born
- 21% · Canada, Vietnam, China
- Languages at home
- 70% English-only · Spanish 15% Vietnamese 3% Other Asian/Pacific 3%
Political lean MEDSL · Multnomah
- 2024 margin
- Solid D (+62.1) · D 79.3% · R 17.2% · Other 3.5%
- 2008→2024 swing
- +6.0pp toward D · 2008: 56.1pp · 2024: 62.1pp
- All cycles
- 2024: D+62.1 2020: D+61.3 2016: D+58.3 2012: D+54.9 2008: D+56.1
Not yet ingested
- Civics
- —
Market trends
- HPI YoY
- ▼ -409.12%
- Current HPI
- 287.2227
- Rent YoY
- ▲ 0.99%
- Metro
- Portland-Vancouver-Hillsboro, OR-WA
- State GDP YoY
- ▲ 2.05%
- F500 in state
- 2
Industry mix (Fortune 500 HQ in OR)
| Industry | F500 HQs | Revenue |
|---|---|---|
| Consumer Goods | 1 | $51B |
|
||
Price history
4 events — show timeline
- 2026-02-24 Pending — RMLS
- 2025-11-28 Relisted — RMLS
- 2025-11-10 Pending — RMLS
- 2025-10-31 Listed $117,800 RMLS
Property tax history
-0.9%/yrLatest (2016): $386 · +16.3% YoY. Source: county tax records.
Cash-flow waterfall
monthlySold comps — $/sqft
last 12 mo · ≤1 miLoading sold comps…