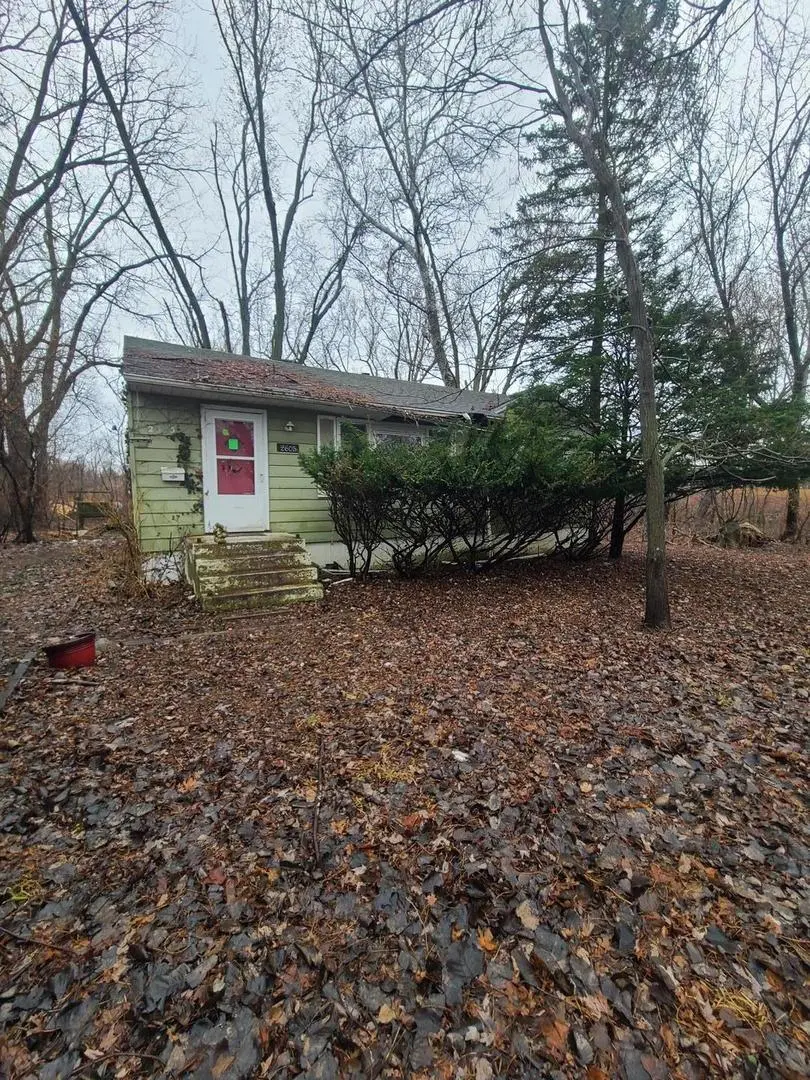
2605 N Pine St · Waukegan, IL
Flood risk 7/10 · Major
- FEMA flood zone
- X (shaded)
- Chance of flooding over 30 yrs
- 0.77%
- Est. flood insurance / yr
- $473 – $860
Fire risk 3/10 · Minor
- Est. fire insurance / yr
- $804 – $1,492
Heat risk 2/10 · Minimal
- Hot days now (above 97°F)
- 7 days/yr
- Hot days in 30 yrs
- 13 days/yr
Wind risk 2/10 · Minimal
- Chance of severe wind over 30 yrs
- —
Air-quality risk 3/10 · Minor
- Unhealthy air days now
- 3 days/yr
- Unhealthy air days in 30 yrs
- 4 days/yr
Risk factors via First Street. Map © Google.
Why this score? — see what drove the B- grade
The composite is a weighted blend of 9 inputs, each scored 0–100. Each bar is that input's sub-score; the figure is the points it added to the 100-point composite (weight × sub-score).
- Cash flow +30.0/30.0
- 1% rule +10.0/10.0
- DSCR +10.0/10.0
- ARV discount +7.5/15.0
- Livability +3.8/5.0
- Rent growth +2.5/5.0
- Condition / age +2.5/5.0
- Schools +0.8/10.0
- Appreciation +0.0/10.0
$110,000
🖨 Deal sheet (PDF) 📄 Offer letter ✓ Due diligence
Listing remarks
3 BEDROOM 1 BATHROOM RAISED RANCH FOR SALE. THIS HOME NEEDS A FULL REHAB BUT IS THE BEST DEAL IN WAUKEGAN! LOCATED ON A NICE BLOCK WITH PEACEFUL SURROUNDINGS, THIS HOME IS READY FOR A NEW OWNER. SOLD AS-IS. THIS IS NOT A BANK SHORT SALE OR FORECLOSURE. GREAT OPPORTUNITY FOR OWNERSHIP AT THIS PRICE. VACANT AND EASY TO SHOW. PLEASE INSPECT PRIOR TO SUBMITTING AN OFFER SINCE WE ARE SELLING "AS-IS". NO SURVEY. DISCLOSURES UNDER ADDITIONAL DOCUMENTS. AGENT HAS AN OWNERSHIP INTEREST IN THE PROPERTY.
Key facts
- 3,125 sq ft lot
- Built 1955
- Listed 3 days
Neighborhood map
What this means for you Summary
Snapshot
- This is a 3-bed/1.0-bath single-family listed at $110k.
Deal economics
- At list price, monthly cash flow is $604 ($7k/yr) — positive.
- The deal already cash-flows at list — no discount required.
- Meets the 1% rule at list price ($2k rent vs $110k).
- Cap rate 13.5% vs local median 4.6% in Waukegan — top-decile yield for the area; either an underpriced asset or a hidden risk that comps aren't pricing in. Stress-test before assuming the spread holds.
Location & tenants
- Location reads 75/100 on livability (#216 in IL, #4,074 nationally) — a middle-class / working-renter tenant base. Strengths: commute A+, cost of living A+, housing A+; Watch: employment C-, crime D, schools F.
- Waukegan CUSD 60 (suburban): math 7% / reading 10% proficiency, ranked #587 of 620 in IL (top 95%) — low school quality limits family demand, transient renter base, plan for 1-2y turnover; 66% free/reduced lunch — lower-income household profile, screen leases tightly.
- Market conditions: 40 active listings in the ZIP; 6 comparable units currently listed for rent nearby; rentals at typical pace (median 20d on market — plan ~3-4 weeks tenant-placement turnaround); solid renter incomes; 948 units permitted in Lake County in 2024 (424 in 5+ unit buildings).
- This rent runs 34% of the median local income ($77k/yr) — at the standard rent-burdened threshold; future hikes will face affordability resistance.
Forward outlook
- Local home prices are declining (-3.0%/yr); year-one equity from $761 of loan paydown is wiped out by about $3k of value loss. Plan a longer hold.
- Lake County population projected to shrink 8% by 2050 — rents likely to lag national; underwrite the cash flow, not the appreciation.
- At projected returns (-3.0% appreciation + 3.0% rent growth), your $31k cash investment doubles in ~6 years — after that, you're playing with house money.
Negotiation context
- Only 3 days on market — expect competitive offers; lowballing is unlikely to land.
- 2 sale attempts; this cycle's ask is 16% above the opening price — seller raised mid-cycle; expect resistance to lowballs.
Risks & watch-outs
- Watch-outs: property tax is 4.5% of price; flood insurance adds $56/mo; built in 1955 — expect roof / HVAC / electrical / plumbing capex.
- Climate carrying-cost: major flood risk — expect insurance premiums to compound above CPI over the hold.
Questions for the listing agent
- Built in 1955 — when were the roof, HVAC, electrical panel, plumbing, and water heater last replaced?
- Property tax is high relative to price — has the assessment been appealed recently, and will the sale trigger a re-assessment?
- What's the actual annual flood-insurance premium (NFIP or private), and is the property in a SFHA with mandatory coverage?
- Is there a deadline driving the sale (1031 exchange, divorce, estate, relocation)? That informs how much negotiation room exists.
- Schools are F-rated, which usually means shorter tenancies and higher turnover. Who's the typical renter profile here, and what's been the actual vacancy rate?
- Crime grade is D in this area — have there been break-ins, vandalism, or insurance claims at this property in the last 3 years? What carrier currently insures it and at what premium?
- What's the average days-on-market for RENTAL listings here right now (not sales)? A rising rental-DOM trend means longer vacancies and softer asking-rent achievability than the comps imply.
- What's the recent tenant-quality profile in this submarket — average credit score on applications, eviction rate, late-payment / NSF rate, and stable-employment percentage? A property-management company in the area should have these aggregated.
- How much new for-sale + rental construction is in the pipeline within 1–3 miles? Heavy new supply typically softens prices + rents 12–24 months out; constrained supply supports both.
Investment metrics
- 1% rule
- 1.95% ✓
- Cap rate
- 13.49%
- Cash-on-cash
- 25.69%
- DSCR
- 2.14
- GRM
- 4.3
CMA / ARV
- ARV (on-the-fly)
- $287,712
- Comps found
- 12
Show comp detail 12 sales within ~0.75 mi
| Address | Dist | Beds/Ba | Sqft | Sold | Price | $/sf | Match |
|---|---|---|---|---|---|---|---|
| 2605 N Pine St | 0.00mi | 3/1.0 | 1,200 (-7%) | 2mo | $110,000 | $92 | 86 |
| 2637 Yeoman St | 0.11mi | 3/1.0 | 1,248 (-4%) | 10mo | $191,500 | $153 | 80 |
| 2426 N Butrick St | 0.24mi | 3/2.0 | 1,331 (+3%) | 3mo | $315,000 | $237 | 78 |
| 2432 Yeoman St | 0.21mi | 4/1.5 (+1) | 1,211 (-7%) | 1mo | $317,000 | $262 | 72 |
| 2540 E Bonnie Brook Ln | 0.36mi | 3/2.5 | 1,200 (-7%) | 1mo | $290,000 | $242 | 64 |
| 2239 Walnut St | 0.57mi | 3/1.0 | 1,350 (+4%) | 4mo | $300,000 | $222 | 63 |
| 1801 Partridge St | 0.33mi | 2/1.5 (-1) | 1,268 (-2%) | 14mo | $160,000 | $126 | 63 |
| 2130 Hawthorne Ln | 0.57mi | 3/1.5 | 1,398 (+8%) | 0mo | $247,000 | $177 | 58 |
| 2820 N Elmwood Ave | 0.38mi | 3/1.0 | 1,118 (-14%) | 4mo | $254,900 | $228 | 56 |
| 2113 Walnut St | 0.71mi | 3/1.0 | 1,266 (-2%) | 8mo | $242,500 | $192 | 56 |
| 2211 N Jackson St | 0.65mi | 4/2.0 (+1) | 1,362 (+5%) | 15mo | $300,000 | $220 | 40 |
| 2232 Walnut St | 0.56mi | 4/2.0 (+1) | 1,141 (-12%) | 7mo | $315,500 | $277 | 39 |
Match score weights: distance 35% · size 25% · config 20% · recency 20%. Top-matched comps best support the ARV.
Projected returns pro-forma
-3.0% appreciation · 3.0% rent growth · sell at horizon
- IRR
- 16.8%
- Equity multiple
- 1.68×
- Total profit
- $20,867
- Equity at exit
- $16,401
- IRR
- 25.4%
- Equity multiple
- 3.23×
- Total profit
- $68,644
- Equity at exit
- $9,511
Cash invested: $30,800 (down + closing). Projections, not guarantees.
Landlord ↔ Tenant lean methodology
- Overall (STATE)
- 43 Moderately Tenant-Leaning
- State Illinois
- 43 Moderately Tenant-Leaning · D+7
- County
- — inherits STATE
- City
- — inherits STATE
ZIP-level market 60087
- Home prices YoY
- -20.3%
- Active inventory
- 40
- Price-to-rent
- 4.3×
Monthly cashflow live
- Estimated rent
- $2,144 high interval (Pro) →
- Mortgage (P&I)
- −$577
- Tax from tax record
- −$412 /mo · $4,940/yr
- Insurance
- −$46
- Flood insurance flood zone
- −$56 /mo · $666/yr
- HOA
- −$0
- Vacancy / Maint / Mgmt
- −$450
- Net cashflow
- $604
Break-even live
Sensitivity live
| Price | -10% $666 | -5% $635 | +0% $604 | +5% $573 | +10% $542 |
|---|---|---|---|---|---|
| Rent | -10% $434 | -5% $519 | +0% $604 | +5% $688 | +10% $773 |
| Rate | -1.0pp $659 | -0.5pp $632 | base $604 | +0.5pp $575 | +1.0pp $546 |
UW: 25.0% down · 7.5% · 30yr · 1.5% tax · 5.0% vac · 8.0% maint · 8.0% mgmt
Financing live
Cash to close
- Down payment
- $27,500
- Closing costs
- $3,300
- Reserves months
- —
- Total cash needed
- —
Loan-product check · same deal, 3 products live
Conventional
25% down · 7.5% · 30yr
- Down + closing
- —
- Monthly P&I
- —
- Monthly cashflow
- —
- DSCR
- —
- Eligible?
- —
Personal DTI + credit; lowest rate.
DSCR
20% down · 8.5% · 30yr
- Down + closing
- —
- Monthly P&I
- —
- Monthly cashflow
- —
- DSCR
- —
- Eligible?
- —
No personal income docs; deal must DSCR.
Hard money
10% down · 12.0% · 12mo
- Down + closing
- —
- Monthly P&I
- —
- Monthly cashflow
- —
- DSCR
- —
- Eligible?
- —
Short-term bridge; refi at stabilization.
Rent comps 6 comps
| Address | Beds | Baths | Sqft | Rent | $/sqft | DOM | Units | Dist |
|---|---|---|---|---|---|---|---|---|
| 2330 Samson Way Waukegan, IL | 1.0–3.0 | 1.0–2.0 | 1129 | $2,065 | $1.83 | 2d | 11 | 0.37mi |
| 2317 Western Ave Unit 2319 Waukegan, IL | 3.0 | 1.0 | 1200 | $2,950 | $2.46 | 25d | 1 | 0.44mi |
| 2108 Linden Ave Waukegan, IL | 3.0 | 2.0 | 1326 | $2,251 | $1.70 | 5d | 1 | 0.69mi |
| 1630 W Greenwood Ave Waukegan, IL | 3.0 | 2.0 | 1062 | $2,250 | $2.12 | 19d | 1 | 0.97mi |
| 2100 Williamsburg Dr Unit 302 Waukegan, IL | 2.0 | 1.0 | 950 | $1,400 | $1.47 | 44d | 1 | 1.17mi |
| 1947 W Eagle Ridge Dr Waukegan, IL | 1.0–2.0 | 1.0–2.0 | 792 | $1,740 | $2.20 | 2d | 8 | 1.33mi |
Listing history 8 events
-
2026-04-29soldstatus $110,000
-
2026-04-07status Pending
-
2026-04-06status Active
-
2026-04-06price $110,000
-
2026-03-19status Pending
-
2026-03-17$95,000 Active
-
1987-07-01soldstatus $45,400
-
1986-05-01soldstatus $42,236
ⓘ Source: listings_history table (triggers on properties + properties_extension) + one-shot
backfill from property_details.listing_events for pre-trigger history.
Tax reassessment forecast IL · Partial reset (capped growth)
- Current annual tax
- $4,940 · $412/mo
- Projected year-2 tax
- $4,940 · $412/mo
- Expected delta
- $0/yr ($0/mo · 0.0%)
ⓘ Screening estimate from a state-policy table — verify with the county assessor before closing.
Climate risk First Street
- Flood 7/10 Severe FEMA zone X (shaded) · 77% chance over 30 yrs
- Wildfire 3/10 Moderate
- Heat 2/10 Low 7 d/yr ≥97°F today · 13 d/yr by 30 yrs out
- Wind 2/10 Low
- Air quality 3/10 Moderate 3 unhealthy d/yr today · 4 by 30 yrs out
Nearby sold comps map
Loading sold comps map…
Walkable amenities ~0.75 mi
Loading nearby amenities…
Taxation est. · year 1
- Rental income
- $25,727
- − Mortgage interest
- −$6,162
- − Property taxes
- −$4,940
- − Insurance
- −$1,216
- − Repairs & maintenance
- −$2,058
- − Management
- −$2,058
- − Depreciation
- −$3,200
- Taxable income
- $6,093
- Est. tax owed @ 24.0%
- −$1,462
- After-tax cash flow
- $5,783/yr
For passive investors: Depreciation is non-cash, so a rental often shows a tax loss while cash-flowing — sheltering income. Rental losses are passive: they offset passive income freely, and up to $25,000/yr can offset ordinary (W-2) income if you actively participate and your MAGI is under $100k (phasing out to $0 by $150k); unused losses carry forward. On sale, claimed depreciation is recaptured at up to 25%, and gains may owe capital-gains tax (a 1031 exchange can defer both). Figures are a year-1 estimate at your 24.0% rate — not tax advice; consult a CPA.
Schools (NCES district)
- District
- Waukegan CUSD 60
- NCES district ID
- 1741250
- Math proficiency
- 7% ▼ -8.00%
- Reading proficiency
- 10% ▼ -8.00%
- Median HH income
- $43,248
- Composite
- 7.73/100
- National rank
- #9939
- State rank
- #587 of 620 in IL
Livability — Waukegan
- Score
- 75/100
- State rank
- #216
- US rank
- #4074
Category grades
Schools grade is shown separately in the Schools card above.
Census & demographics
- Census place
- Waukegan, IL
- County
- Lake County · 591,991 people
- City population
- 99,634
- Metro
- Chicago-Naperville-Elgin, IL-IN-WI
- Population (ZIP)
- 27,293
- Household income
- $76,738
- Rent vs Own
- Severe rent burden
- 894.0
Population outlook (Lake County) Hauer SSP2
- Today (2025)
- 700,217 people
- By 2030
- 693,290 · -1.0%
- By 2040
- 673,588 · -3.8%
- By 2050
- 643,556 · -8.1%
- By 2075
- 562,792 · -19.6%
- By 2100
- 457,715 · -34.6%
Race, ethnicity, and origin ACS 2023
- Neighborhood character
- Diverse neighborhood (Simpson 0.60)
- Race & ethnicity
- Hispanic / Latino 56% White 25% Two or more races 20% Black 15% Asian 3% Native American 2%
- Hispanic origin (detail)
- Mexican 40% Puerto Rican 7%
- Common ancestry
- Romanian 2% Italian 1% Slovak 1%
- Foreign-born
- 25% · Canada, United Kingdom
- Languages at home
- 49% English-only · Spanish 46% French/Haitian/Cajun 1% Other Asian/Pacific 1%
Political lean MEDSL · Lake
- 2024 margin
- Strong D (+20.8) · D 59.7% · R 38.9% · Other 1.4%
- 2008→2024 swing
- +1.1pp toward D · 2008: 19.6pp · 2024: 20.8pp
- All cycles
- 2024: D+20.8 2020: D+24.1 2016: D+20.3 2012: D+8.1 2008: D+19.6
Not yet ingested
- Civics
- —
Market trends
- HPI YoY
- ▼ -62.05%
- Current HPI
- 243.1613
- Rent YoY
- —
- Metro
- Chicago-Naperville-Elgin, IL-IN-WI
- State GDP YoY
- ▲ 1.59%
- F500 in state
- 60
Industry mix (Fortune 500 HQ in IL)
| Industry | F500 HQs | Revenue |
|---|---|---|
| Insurance | 4 | $201B |
|
||
| Consumer Goods | 4 | $87B |
|
||
| Industrial Machinery | 3 | $64B |
|
||
| Healthcare | 2 | $55B |
|
||
| Retail / Pharmacy | 1 | $148B |
|
||
| Agriculture / Food | 1 | $86B |
|
||
Price history
+160.4% since first listed8 events — show timeline
- 2026-04-29 Sold (Public Records) $110,000 Public Records
- 2026-04-07 Pending — MRED as Distributed by MLS Grid
- 2026-04-06 Relisted — MRED as Distributed by MLS Grid
- 2026-04-06 Price Changed $110,000 MRED as Distributed by MLS Grid
- 2026-03-19 Pending — MRED as Distributed by MLS Grid
- 2026-03-17 Listed $95,000 MRED as Distributed by MLS Grid
- 1987-07-01 Sold (Public Records) $45,400 Public Records
- 1986-05-01 Sold (Public Records) $42,236 Public Records
Property tax history
+1.4%/yrLatest (2024): $4,940 · +1.9% YoY. Source: county tax records.
Cash-flow waterfall
monthlySold comps — $/sqft
last 12 mo · ≤1 miLoading sold comps…