 🏗️ New Construction
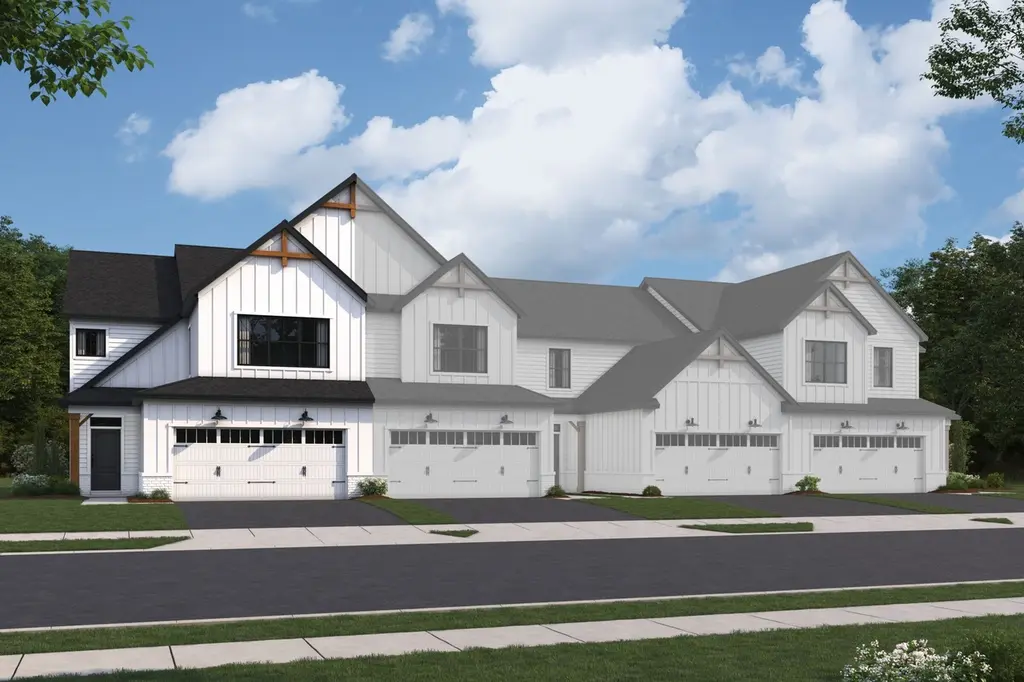
Campbell Plan · Powell, OH
Flood risk No data
- FEMA flood zone
- —
- Chance of flooding over 30 yrs
- —
- Est. flood insurance / yr
- —
Fire risk No data
- Est. fire insurance / yr
- —
Heat risk No data
- Hot days now (above threshold)
- —
- Hot days in 30 yrs
- —
Wind risk No data
- Chance of severe wind over 30 yrs
- —
Air-quality risk No data
- Unhealthy air days now
- —
- Unhealthy air days in 30 yrs
- —
Risk factors via First Street. Map © Google.
Why this score? — see what drove the F grade
The composite is a weighted blend of 9 inputs, each scored 0–100. Each bar is that input's sub-score; the figure is the points it added to the 100-point composite (weight × sub-score).
- Schools +7.6/10.0
- ARV discount +7.5/15.0
- Livability +3.9/5.0
- Rent growth +3.5/5.0
- Condition / age +2.5/5.0
- Cash flow +2.1/30.0
- 1% rule +0.0/10.0
- DSCR +0.0/10.0
- Appreciation +0.0/10.0
$377,900
🖨 Deal sheet (PDF) 📄 Offer letter ✓ Due diligence
Listing remarks MLS
We're thrilled to introduce the Campbell, a new townhome floorplan! Reach out for more information about how you can call it yours.
Key facts
- 2 garage spots
- Listed 339 days
Neighborhood map
What this means for you Summary
Snapshot
- This is a 2-bed/2.5-bath townhouse listed at $378k.
Deal economics
- At list price, monthly cash flow is $-2k ($-28k/yr) — negative.
- To cash-flow at today's rent, offer at most $304k (19.5% below list).
- To meet the 1% rule (rent ≥ 1% of price), the offer needs to be $266k (29.6% below list).
- Recommended offer: $266k (29.6% below list) — sets the bar for 1% rule.
- Cap rate 1.9% vs local median 2.8% in Powell — below-typical yield; the buyer is paying a premium for something (appreciation thesis, condition, location) that the cap rate doesn't capture.
Location & tenants
- Location reads 77/100 on livability (#201 in OH, #3,091 nationally) — a middle-class / working-renter tenant base. Strengths: crime A+, employment A+, housing A+; Watch: amenities F, commute F, cost of living F.
- Olentangy Local (rural): math 81% / reading 84% proficiency, ranked #18 of 656 in OH (top 3%) — strong family-tenant draw, lease renewals of 3-5y typical; only 5% free/reduced lunch — higher-income household profile.
- Zoned schools: Liberty Tree Elementary School (math 84% / reading 87%, grade A+, #60 of 1,584 statewide, top 4%, 751 students, 4% FRL); Hyatts Middle School (math 87% / reading 87%, grade A+, #7 of 654 statewide, top 1%, 930 students, 5% FRL); Olentangy Liberty High School (math 75% / reading 92%, grade A, #20 of 781 statewide, top 2%, 1,877 students, 3% FRL) — zoned schools at 4% FRL track the district average.
- Market conditions: Rents rising (+3.9%/yr); 307 active listings in the ZIP; 3 comparable units currently listed for rent nearby; rentals lingering (median 46d on market — plan ~5-8 weeks vacancy on turnover, expect pricing pressure); 67% of comp listings sitting > 30 days — soft ceiling on asking rent; high-income renter base; 2,233 units permitted in Delaware County in 2024 (304 in 5+ unit buildings).
Forward outlook
- Local home prices are declining (-3.0%/yr); year-one equity from $4k of loan paydown is wiped out by about $19k of value loss. Plan a longer hold.
- Delaware County population projected at +37% by 2050 — long-run rental-demand tailwind backs the buy-and-hold thesis.
Negotiation context
- It's been on market 339 days — a 12% lower offer ($333k) is reasonable based on typical stale-listing flexibility.
Risks & watch-outs
- Watch-outs: property tax is 2.6% of price.
Questions for the listing agent
- What do current leases actually rent for vs. the listed asking? Can we see a recent rent roll and the last 12 months of T-12 income?
- It's been on market 339 days. Have you received any prior offers? Is the seller open to a 30% concession, seller financing, or rate buy-down credit?
- Property tax is high relative to price — has the assessment been appealed recently, and will the sale trigger a re-assessment?
- Why hasn't it sold? Are there any deal-killer items the seller is aware of (foundation, flood, title, zoning, code violations)?
- Is there a deadline driving the sale (1031 exchange, divorce, estate, relocation)? That informs how much negotiation room exists.
- Schools are A-rated — typically a magnet for longer-tenancy family renters. What's the average tenant stay here, and is there a school-zone premium baked into asking?
- The area grade is low — what's the realistic commute time and amenity access for the typical tenant pool here? Any planned neighborhood developments (good or bad) we should know about?
- What's the average days-on-market for RENTAL listings here right now (not sales)? A rising rental-DOM trend means longer vacancies and softer asking-rent achievability than the comps imply.
- What's the recent tenant-quality profile in this submarket — average credit score on applications, eviction rate, late-payment / NSF rate, and stable-employment percentage? A property-management company in the area should have these aggregated.
- How much new for-sale + rental construction is in the pipeline within 1–3 miles? Heavy new supply typically softens prices + rents 12–24 months out; constrained supply supports both.
Investment metrics
- 1% rule
- 0.41% ✗
- Cap rate
- 1.89%
- Cash-on-cash
- -15.71%
- DSCR
- 0.30
- GRM
- 20.3
CMA / ARV
- ARV (median comp)
- $647,546
- List price
- $377,900
- Delta
- -41.64%
- Verdict
- UNDERPRICED
- Comps
- 20 within 1.0 mi
Show comp detail 5 sales within ~0.75 mi
| Address | Dist | Beds/Ba | Sqft | Sold | Price | $/sf | Match |
|---|---|---|---|---|---|---|---|
| 5494 Dutch Ln | 0.14mi | 2/2.5 | 2,049 (+1%) | 7mo | $422,060 | $206 | 86 |
| 6079 Ludwig St | 0.70mi | 3/3.0 (+1) | 1,884 (-7%) | 4mo | $520,000 | $276 | 45 |
| 5975 Ludwig St | 0.68mi | 2/2.5 | 2,158 (+7%) | 20mo | $579,795 | $269 | 41 |
| 3218 Korg St | 0.75mi | 3/3.0 (+1) | 2,234 (+10%) | 7mo | $621,250 | $278 | 35 |
| 5967 Ibanez Dr | 0.65mi | 3/3.0 (+1) | 2,297 (+13%) | 17mo | $843,885 | $367 | 26 |
Match score weights: distance 35% · size 25% · config 20% · recency 20%. Top-matched comps best support the ARV.
Projected returns pro-forma
-3.0% appreciation · 3.86% rent growth · sell at horizon
- IRR
- -45.9%
- Equity multiple
- -0.40×
- Total profit
- $-253,751
- Equity at exit
- $96,551
- IRR
- -79.4%
- Equity multiple
- -1.24×
- Total profit
- $-405,777
- Equity at exit
- $55,988
Cash invested: $181,313 (down + closing). Projections, not guarantees.
Landlord ↔ Tenant lean methodology
- Overall (STATE)
- 73 Landlord-Friendly
- State Ohio
- 73 Landlord-Friendly · R+6
- County
- — inherits STATE
- City
- — inherits STATE
ZIP-level market 43065
- Rents YoY
- 3.9%
- Active inventory
- 307
- Price-to-rent
- 11.8×
Monthly cashflow live
- Estimated rent
- $2,660 medium interval (Pro) →
- Mortgage (P&I)
- −$3,396
- Tax est. 1.5%
- −$809 /mo · $9,713/yr
- Insurance
- −$270
- HOA
- −$0
- Vacancy / Maint / Mgmt
- −$559
- Net cashflow
- $-2,374
Break-even live
Sensitivity live
| Price | -10% $-1,926 | -5% $-2,150 | +0% $-2,374 | +5% $-2,597 | +10% $-2,821 |
|---|---|---|---|---|---|
| Rent | -10% $-2,584 | -5% $-2,479 | +0% $-2,374 | +5% $-2,269 | +10% $-2,164 |
| Rate | -1.0pp $-2,048 | -0.5pp $-2,209 | base $-2,374 | +0.5pp $-2,542 | +1.0pp $-2,712 |
UW: 25.0% down · 7.5% · 30yr · 1.5% tax · 5.0% vac · 8.0% maint · 8.0% mgmt
Financing live
Cash to close
- Down payment
- $161,886
- Closing costs
- $19,426
- Reserves months
- —
- Total cash needed
- —
Loan-product check · same deal, 3 products live
Conventional
25% down · 7.5% · 30yr
- Down + closing
- —
- Monthly P&I
- —
- Monthly cashflow
- —
- DSCR
- —
- Eligible?
- —
Personal DTI + credit; lowest rate.
DSCR
20% down · 8.5% · 30yr
- Down + closing
- —
- Monthly P&I
- —
- Monthly cashflow
- —
- DSCR
- —
- Eligible?
- —
No personal income docs; deal must DSCR.
Hard money
10% down · 12.0% · 12mo
- Down + closing
- —
- Monthly P&I
- —
- Monthly cashflow
- —
- DSCR
- —
- Eligible?
- —
Short-term bridge; refi at stabilization.
Rent comps 3 comps
| Address | Beds | Baths | Sqft | Rent | $/sqft | DOM | Units | Dist |
|---|---|---|---|---|---|---|---|---|
| 5478 Dutch Ln Powell, OH | 3.0 | 2.5 | 1792 | $2,800 | $1.56 | 45d | 1 | 0.11mi |
| 5494 Dutch Ln Powell, OH | 2.0 | 2.5 | 2049 | $2,800 | $1.37 | 45d | 1 | 0.11mi |
| 6650 Liberty Grand Blvd Powell, OH | 1.0–3.0 | 1.0–2.5 | 1355 | $2,345 | $1.73 | 3d | 11 | 1.46mi |
Listing history 19 events
-
2026-06-21days on market $377,900 Active 339 DOM
-
2026-06-18days on market $377,900 Active 336 DOM
-
2026-06-17days on market $377,900 Active 335 DOM
-
2026-06-16days on market $377,900 Active 334 DOM
-
2026-06-15days on market $377,900 Active 333 DOM
-
2026-06-13days on market $377,900 Active 331 DOM
-
2026-06-13days on market $377,900 Active 330 DOM
-
2026-06-10days on market $377,900 Active 327 DOM
-
2026-06-08days on market $377,900 Active 326 DOM
-
2026-06-07days on market $377,900 Active 325 DOM
-
2026-06-05days on market $377,900 Active 322 DOM
-
2026-06-03days on market $377,900 Active 321 DOM
-
2026-06-02days on market $377,900 Active 320 DOM
-
2026-06-01days on market $377,900 Active 319 DOM
-
2026-05-31days on market $377,900 Active 318 DOM
-
2026-04-02price $377,900 131-char remark
Show marketing remark (131 chars)
We're thrilled to introduce the Campbell, a new townhome floorplan! Reach out for more information about how you can call it yours.
-
2026-03-25price $375,900 131-char remark
Show marketing remark (131 chars)
We're thrilled to introduce the Campbell, a new townhome floorplan! Reach out for more information about how you can call it yours.
-
2025-11-24price $372,900 131-char remark
Show marketing remark (131 chars)
We're thrilled to introduce the Campbell, a new townhome floorplan! Reach out for more information about how you can call it yours.
-
2025-07-17$382,900 Active 131-char remark
Show marketing remark (131 chars)
We're thrilled to introduce the Campbell, a new townhome floorplan! Reach out for more information about how you can call it yours.
ⓘ Source: listings_history table (triggers on properties + properties_extension) + one-shot
backfill from property_details.listing_events for pre-trigger history.
Nearby sold comps map
Loading sold comps map…
Walkable amenities ~0.75 mi
Loading nearby amenities…
Taxation est. · year 1
- Rental income
- $31,919
- − Mortgage interest
- −$36,273
- − Property taxes
- −$9,713
- − Insurance
- −$3,238
- − Repairs & maintenance
- −$2,554
- − Management
- −$2,554
- − Depreciation
- −$18,838
- Taxable loss
- −$41,249
- Est. tax savings @ 24.0%
- +$9,900
- After-tax cash flow
- $-18,585/yr
For passive investors: Depreciation is non-cash, so a rental often shows a tax loss while cash-flowing — sheltering income. Rental losses are passive: they offset passive income freely, and up to $25,000/yr can offset ordinary (W-2) income if you actively participate and your MAGI is under $100k (phasing out to $0 by $150k); unused losses carry forward. On sale, claimed depreciation is recaptured at up to 25%, and gains may owe capital-gains tax (a 1031 exchange can defer both). Figures are a year-1 estimate at your 24.0% rate — not tax advice; consult a CPA.
Schools (NCES district)
- District
- Olentangy Local
- NCES district ID
- 3904676
- Math proficiency
- 81% ▼ -8.00%
- Reading proficiency
- 84% ▼ -5.00%
- Median HH income
- $111,074
- Composite
- 75.56/100
- National rank
- #132
- State rank
- #18 of 656 in OH
Livability — Powell
- Score
- 77/100
- State rank
- #201
- US rank
- #3091
Category grades
Schools grade is shown separately in the Schools card above.
Census & demographics
- County
- Delaware County · 203,207 people
- City population
- 46,679
- Metro
- Columbus, OH
- Population (ZIP)
- 46,679
- Household income
- $154,481
- Rent vs Own
- Severe rent burden
- 351.0
Population outlook (Delaware County) Hauer SSP2
- Today (2025)
- 230,854 people
- By 2030
- 249,294 · +8.0%
- By 2040
- 284,223 · +23.1%
- By 2050
- 315,314 · +36.6%
- By 2075
- 379,462 · +64.4%
- By 2100
- 403,158 · +74.6%
Race, ethnicity, and origin ACS 2023
- Neighborhood character
- Predominantly White (80%)
- Race & ethnicity
- White 80% Asian 11% Two or more races 5% Hispanic / Latino 3% Black 2%
- Common ancestry
- Romanian 5% Slovak 3% Lithuanian 3%
- Foreign-born
- 10% · China, Canada
- Languages at home
- 87% English-only · Other Indo-European 4% Other Asian/Pacific 3% Chinese 2%
Political lean MEDSL · Delaware
- 2024 margin
- Lean R (+6.6) · D 46.2% · R 52.8%
- 2008→2024 swing
- +13.0pp toward D · 2008: -19.6pp · 2024: -6.6pp
- All cycles
- 2024: R+6.6 2020: R+6.8 2016: R+16.1 2012: R+23.7 2008: R+19.6
Not yet ingested
- Civics
- —
Market trends
- HPI YoY
- ▼ -215.55%
- Current HPI
- 233.6439
- Rent YoY
- ▲ 3.86%
- Metro
- Columbus, OH
- State GDP YoY
- ▲ 1.98%
- F500 in state
- 48
Industry mix (Fortune 500 HQ in OH)
| Industry | F500 HQs | Revenue |
|---|---|---|
| Insurance | 3 | $145B |
|
||
| Industrial Machinery | 3 | $49B |
|
||
| Financial Services | 3 | $24B |
|
||
| Consumer Goods | 2 | $93B |
|
||
| Aerospace / Defense | 2 | $47B |
|
||
| Utilities | 2 | $33B |
|
||
Price history
-1.3% since first listed4 events — show timeline
- 2026-04-02 Price Changed $377,900 Zillow
- 2026-03-25 Price Changed $375,900 Zillow
- 2025-11-24 Price Changed $372,900 Zillow
- 2025-07-17 Listed $382,900 Zillow
Cash-flow waterfall
monthlySold comps — $/sqft
last 12 mo · ≤1 miLoading sold comps…