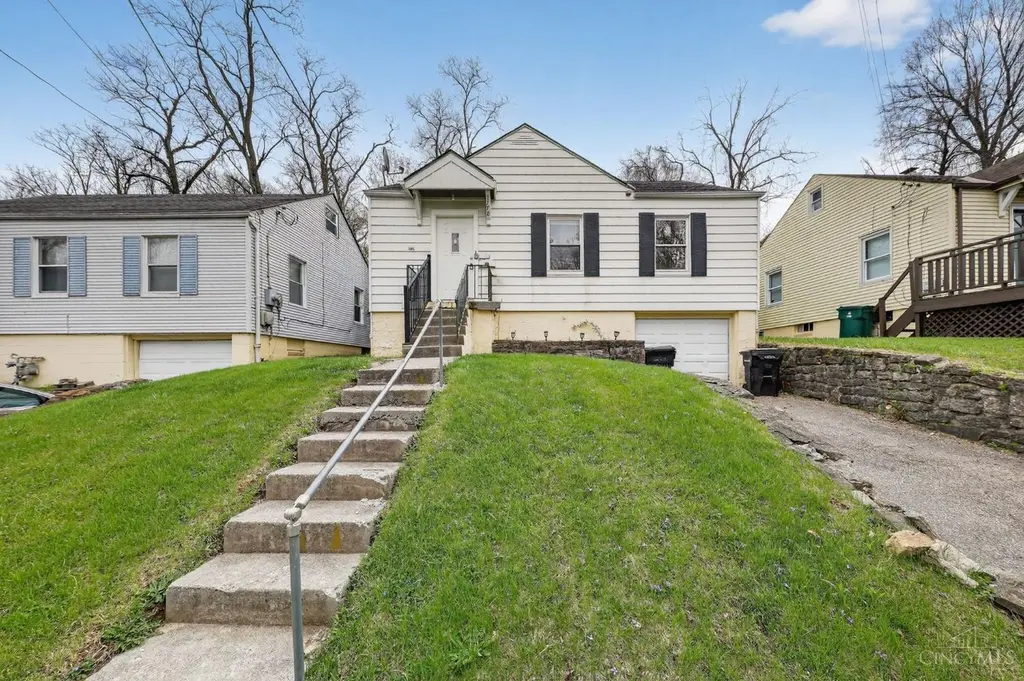
1778 Ashbrook Dr · Cincinnati, OH
Flood risk 9/10 · Severe
- FEMA flood zone
- X (unshaded)
- Chance of flooding over 30 yrs
- 0.99%
- Est. flood insurance / yr
- $473 – $860
Fire risk 1/10 · Minimal
- Est. fire insurance / yr
- $713 – $1,323
Heat risk 4/10 · Minor
- Hot days now (above 103°F)
- 7 days/yr
- Hot days in 30 yrs
- 19 days/yr
Wind risk 2/10 · Minimal
- Chance of severe wind over 30 yrs
- 1.0%
Air-quality risk 3/10 · Minor
- Unhealthy air days now
- 3 days/yr
- Unhealthy air days in 30 yrs
- 5 days/yr
Risk factors via First Street. Map © Google.
Why this score? — see what drove the B- grade
The composite is a weighted blend of 9 inputs, each scored 0–100. Each bar is that input's sub-score; the figure is the points it added to the 100-point composite (weight × sub-score).
- Cash flow +25.4/30.0
- ARV discount +15.0/15.0
- DSCR +8.4/10.0
- 1% rule +6.8/10.0
- Livability +4.0/5.0
- Rent growth +3.7/5.0
- Schools +2.5/10.0
- Condition / age +2.5/5.0
- Appreciation +0.0/10.0
$119,900
🖨 Deal sheet 📄 Offer letter ✓ Due diligence
Listing remarks MLS
Beloved home of original owner! New roof, bath updated, hardwood floors, new carpeting Level 2, family rm LL. Meticulously maintained! Storage shed. Move right in.
Key facts
- Bright living area
- Yard for relaxing
- Functional layout
Tags
Property features AI
Finance
- Other: Lease not considered
- HOA & community: No homeowners association
Exterior
- Parking: Built-in garage/carport (front, attached); 1 garage space; Driveway and on-street parking
- Utilities: Public water; Public sewer; Natural gas
- Home design: Traditional single-family home; One and one-half stories
- Construction: Block foundation
- Exterior features: Vinyl siding; Vinyl windows; Composition roof; Residential zoning; Lot approximately 40 x 130 (about 0.124 acres)
Interior
- Kitchen: Eat-in kitchen with wood cabinets; Vinyl floor in kitchen
- Bedrooms: 3 bedrooms total; Primary bedroom on level 1 (approx. 11 x 12); Bedroom 2 on level 1 (approx. 10 x 9); Bedroom 3 on level 2 (approx. 10 x 29); Primary bedroom has other/unspecified features
- Flooring: Wall-to-wall carpet in living area; Wood flooring in living area; Vinyl flooring in kitchen
- Bathrooms: 1 full bathroom on level 1
- Heating & cooling: Forced air heating (gas); Central air conditioning; Electric water heater
- Interior features: 5 total rooms; Full basement, partially finished
- Laundry & utility: Basement utility space (partially finished)
Neighborhood map
What this means for you Summary
Snapshot
- This is a 2-bed/1.0-bath single-family listed at $120k.
Deal economics
- At list price, monthly cash flow is $220 ($3k/yr) — positive.
- The deal already cash-flows at list — no discount required.
- Meets the 1% rule at list price ($1k rent vs $120k).
- Recommended offer: $113k (6.0% below list) — sets the bar for market timing.
- Cap rate 9.1% vs local median 3.9% in Cincinnati — top-decile yield for the area; either an underpriced asset or a hidden risk that comps aren't pricing in. Stress-test before assuming the spread holds.
Location & tenants
- Location reads 80/100 on livability (#130 in OH, #1,856 nationally) — a professional / high-income tenant draw. Strengths: amenities A+, commute A+, cost of living A+; Watch: employment D, crime F.
- Cincinnati Public Schools (urban): math 25% / reading 36% proficiency, ranked #581 of 656 in OH (top 89%) — families likely to look elsewhere, expect single-tenant / working-renter base with shorter leases; 70% free/reduced lunch — lower-income household profile, screen leases tightly.
- Market conditions: Rents rising fast (+4.9%/yr); 78 active listings in the ZIP; 30 comparable units currently listed for rent nearby; rentals at typical pace (median 21d on market — plan ~3-4 weeks tenant-placement turnaround); 801 units permitted in Hamilton County in 2024 (190 in 5+ unit buildings).
Forward outlook
- Local home prices are declining (-3.0%/yr); year-one equity from $829 of loan paydown is wiped out by about $4k of value loss. Plan a longer hold.
- At projected returns (-3.0% appreciation + 4.9% rent growth), your $34k cash investment doubles in ~10 years — after that, you're playing with house money.
Negotiation context
- It's been on market 70 days — a 6% lower offer ($113k) is reasonable based on typical stale-listing flexibility.
- 2 sale attempts since 19y ago; this cycle's ask has dropped $25k (17%) from the opening price — seller is motivated, your offer sets the floor, not the list.
- Current owner paid $57k; list at $120k implies a 110% gain — meaningful room to come down on a strong offer.
Risks & watch-outs
- Watch-outs: flood insurance adds $56/mo; built in 1940 — expect roof / HVAC / electrical / plumbing capex.
- Climate carrying-cost: severe flood risk — expect insurance premiums to compound above CPI over the hold.
Questions for the listing agent
- It's been on market 70 days. Have you received any prior offers? Is the seller open to a 6% concession, seller financing, or rate buy-down credit?
- Built in 1940 — when were the roof, HVAC, electrical panel, plumbing, and water heater last replaced?
- What's the actual annual flood-insurance premium (NFIP or private), and is the property in a SFHA with mandatory coverage?
- Why hasn't it sold? Are there any deal-killer items the seller is aware of (foundation, flood, title, zoning, code violations)?
- Is there a deadline driving the sale (1031 exchange, divorce, estate, relocation)? That informs how much negotiation room exists.
- Schools are B-rated — typically a magnet for longer-tenancy family renters. What's the average tenant stay here, and is there a school-zone premium baked into asking?
- Crime grade is F in this area — have there been break-ins, vandalism, or insurance claims at this property in the last 3 years? What carrier currently insures it and at what premium?
- What's the average days-on-market for RENTAL listings here right now (not sales)? A rising rental-DOM trend means longer vacancies and softer asking-rent achievability than the comps imply.
- What's the recent tenant-quality profile in this submarket — average credit score on applications, eviction rate, late-payment / NSF rate, and stable-employment percentage? A property-management company in the area should have these aggregated.
- How much new for-sale + rental construction is in the pipeline within 1–3 miles? Heavy new supply typically softens prices + rents 12–24 months out; constrained supply supports both.
Investment metrics
- 1% rule
- 1.18% ✓
- Cap rate
- 9.06%
- Cash-on-cash
- 9.87%
- DSCR
- 1.44
- GRM
- 7.1
CMA / ARV
- ARV (on-the-fly)
- $204,450
- Comps found
- 12
Show comp detail 12 sales within ~0.75 mi
| Address | Dist | Beds/Ba | Sqft | Sold | Price | $/sf | Match |
|---|---|---|---|---|---|---|---|
| 1702 Ashbrook Dr | 0.16mi | 3/1.0 (+1) | 1,369 (-3%) | 2mo | $139,900 | $102 | 81 |
| 1772 Tuxworth Ave | 0.09mi | 3/2.0 (+1) | 1,493 (+6%) | 0mo | $155,000 | $104 | 76 |
| 1758 Tuxworth Ave | 0.07mi | 3/2.0 (+1) | 1,319 (-6%) | 3mo | $227,000 | $172 | 74 |
| 4925 Shirley Pl | 0.48mi | 3/2.0 (+1) | 1,456 (+3%) | 1mo | $230,000 | $158 | 63 |
| 4998 Western Hills Ave | 0.61mi | 2/2.0 | 1,379 (-2%) | 7mo | $192,000 | $139 | 58 |
| 1147 Olivia Ln | 0.49mi | 3/2.0 (+1) | 1,334 (-5%) | 4mo | $194,000 | $145 | 56 |
| 1228 Mckeone Ave | 0.72mi | 3/1.0 (+1) | 1,394 (-1%) | 10mo | $150,000 | $108 | 51 |
| 3020 Veazey Ave | 0.74mi | 3/2.0 (+1) | 1,400 (-1%) | 7mo | $297,500 | $213 | 50 |
| 4553 Clearview Ave | 0.73mi | 3/1.5 (+1) | 1,368 (-3%) | 8mo | $215,000 | $157 | 48 |
| 4934 Relleum Ave | 0.42mi | 3/2.5 (+1) | 1,564 (+11%) | 7mo | $239,900 | $153 | 45 |
| 5052 Casa Loma Blvd | 0.72mi | 3/1.0 (+1) | 1,519 (+8%) | 6mo | $120,000 | $79 | 43 |
| 4549 Clearview Ave | 0.74mi | 3/1.0 (+1) | 1,252 (-11%) | 8mo | $115,000 | $92 | 35 |
Match score weights: distance 35% · size 25% · config 20% · recency 20%. Top-matched comps best support the ARV.
Projected returns pro-forma
-3.0% appreciation · 4.87% rent growth · sell at horizon
- IRR
- -2.0%
- Equity multiple
- 0.92×
- Total profit
- $-2,621
- Equity at exit
- $17,877
- IRR
- 9.7%
- Equity multiple
- 1.82×
- Total profit
- $27,576
- Equity at exit
- $10,367
Cash invested: $33,572 (down + closing). Projections, not guarantees.
Landlord ↔ Tenant lean methodology
- Overall (STATE)
- 73 Landlord-Friendly
- State Ohio
- 73 Landlord-Friendly · R+6
- County
- — inherits STATE
- City
- — inherits STATE
ZIP-level market 45238
- Rents YoY
- 4.9%
- Active inventory
- 78
- Price-to-rent
- 7.1×
Monthly cashflow live
- Estimated rent
- $1,411 high interval (Pro) →
- Mortgage (P&I)
- −$629
- Tax from tax record
- −$160 /mo · $1,917/yr
- Insurance
- −$50
- Flood insurance flood zone
- −$56 /mo · $666/yr
- HOA
- −$0
- Vacancy / Maint / Mgmt
- −$296
- Net cashflow
- $220
Break-even live
UW: 25.0% down · 7.5% · 30yr · 1.5% tax · 5.0% vac · 8.0% maint · 8.0% mgmt
Financing live
Cash to close
- Down payment
- $29,975
- Closing costs
- $3,597
- Reserves months
- —
- Total cash needed
- —
Loan-product check · same deal, 3 products live
Conventional
25% down · 7.5% · 30yr
- Down + closing
- —
- Monthly P&I
- —
- Monthly cashflow
- —
- DSCR
- —
- Eligible?
- —
Personal DTI + credit; lowest rate.
DSCR
20% down · 8.5% · 30yr
- Down + closing
- —
- Monthly P&I
- —
- Monthly cashflow
- —
- DSCR
- —
- Eligible?
- —
No personal income docs; deal must DSCR.
Hard money
10% down · 12.0% · 12mo
- Down + closing
- —
- Monthly P&I
- —
- Monthly cashflow
- —
- DSCR
- —
- Eligible?
- —
Short-term bridge; refi at stabilization.
Rent comps 30 comps
| Address | Beds | Baths | Sqft | Rent | $/sqft | DOM | Units | Dist |
|---|---|---|---|---|---|---|---|---|
| 1723 Tuxworth Ave Cincinnati, OH | 3.0 | 2.0 | 1587 | $1,800 | $1.13 | 23d | 1 | 0.07mi |
| 2706 E Tower Dr Cincinnati, OH | 1.0–3.0 | 1.0–2.0 | 951 | $1,188 | $1.25 | 1d | 61 | 0.54mi |
| 2621 Gehrum Ln Cincinnati, OH | 3.0 | 1.0 | 1373 | $1,850 | $1.35 | 23d | 1 | 0.62mi |
| 3053 N Hegry Cir #1 Cincinnati, OH | 2.0 | 1.0 | 954 | $1,250 | $1.31 | 4d | 1 | 0.68mi |
| 2511 Ferguson Rd Unit 2537 Cincinnati, OH | 3.0 | 1.5 | 1100 | $1,650 | $1.50 | 23d | 1 | 0.74mi |
| 2682 Lafeuille Cir Cincinnati, OH | 2.0–3.0 | 1.0–2.0 | 950 | $1,176 | $1.24 | 3d | 16 | 0.75mi |
| 2969 Four Towers Dr Unit 2 Cincinnati, OH | 2.0 | 1.0 | 960 | $1,150 | $1.20 | 23d | 1 | 0.76mi |
| 2905 Queen City Ave Cincinnati, OH | 2.0 | 1.0 | 1000 | $1,350 | $1.35 | 4d | 1 | 0.80mi |
| 2905 Queen City Ave Unit 1 Cincinnati, OH | 2.0 | 1.0 | 900 | $1,350 | $1.50 | 23d | 1 | 0.80mi |
| 5256 Ponce Ln Cincinnati, OH | 3.0 | 2.0 | 1270 | $1,866 | $1.47 | 1d | 1 | 0.81mi |
| 4370 Saint Lawrence Ave #1 Cincinnati, OH | 1.0 | 1.0 | 876 | $1,050 | $1.20 | 16d | 1 | 0.82mi |
| 1224 Sliker Ave Cincinnati, OH | 1.0 | 1.0 | 950 | $850 | $0.89 | 4d | 1 | 0.82mi |
| 1240 Rosemont Ave Cincinnati, OH | 2.0 | 1.0 | 1280 | $1,100 | $0.86 | 20d | 1 | 0.82mi |
| 2598 Ferguson Rd Cincinnati, OH | 2.0 | 1.0 | 950 | $1,145 | $1.21 | 4d | 1 | 0.85mi |
| 1233 Dewey Ave Cincinnati, OH | 3.0 | 1.0 | 1411 | $1,375 | $0.97 | 4d | 1 | 0.86mi |
| 1872 Sunset Ave Cincinnati, OH | 2.0 | 1.0 | 888 | $1,075 | $1.21 | 4d | 7 | 0.91mi |
| 1214 Gilsey Ave Cincinnati, OH | 3.0 | 1.0 | 1300 | $1,300 | $1.00 | 23d | 1 | 0.94mi |
| 1214 Gilsey Ave Cincinnati, OH | 3.0 | 1.0 | 1300 | $1,300 | $1.00 | 20d | 1 | 0.94mi |
| 1057 Winfield Ave Unit 2 Cincinnati, OH | 2.0 | 1.0 | 1000 | $1,250 | $1.25 | 23d | 1 | 0.94mi |
| 1740 Minion Ave Cincinnati, OH | 2.0 | 1.0 | 1320 | $1,200 | $0.91 | 23d | 1 | 1.06mi |
| 1607 Minion Ave Cincinnati, OH | 3.0 | 1.5 | 1066 | $1,675 | $1.57 | 23d | 1 | 1.08mi |
| 4227 W 8th St Cincinnati, OH | 3.0 | 2.0 | 1832 | $2,050 | $1.12 | 1d | 1 | 1.10mi |
| 3772 W Liberty St Cincinnati, OH | 3.0 | 1.0 | 1066 | $1,350 | $1.27 | 4d | 1 | 1.12mi |
| 4244 Loubell Ln Cincinnati, OH | 1.0 | 1.0 | 900 | $895 | $0.99 | 23d | 1 | 1.13mi |
| 3666 Glenway Ave Cincinnati, OH | 3.0 | 1.0 | 1339 | $1,250 | $0.93 | 23d | 1 | 1.30mi |
| 4284 Foley Rd Cincinnati, OH | 3.0 | 2.0 | 1242 | $2,800 | $2.25 | 43d | 1 | 1.34mi |
| 2356 Harrison Ave Cincinnati, OH | 2.0 | 1.0 | 900 | $1,000 | $1.11 | 23d | 1 | 1.40mi |
| 2747 McKinley Ave Fl 1 Cincinnati, OH | 1.0 | 1.0 | 900 | $895 | $0.99 | 21d | 1 | 1.41mi |
| 2532 Harrison Ave Unit 2217 02 Cincinnati, OH | 2.0 | 1.0 | 1000 | $1,250 | $1.25 | 23d | 1 | 1.44mi |
| 2860 Harrison Ave Apt 21 Cincinnati, OH | 2.0 | 1.5 | 950 | $1,000 | $1.05 | 20d | 1 | 1.47mi |
Listing history 18 events
-
2026-06-18price $119,900 Active 70 DOM
-
2026-06-18days on market $129,900 Active 70 DOM
-
2026-06-17days on market $129,900 Active 69 DOM
-
2026-06-16days on market $129,900 Active 68 DOM
-
2026-06-15days on market $129,900 Active 67 DOM
-
2026-06-13days on market $129,900 Active 65 DOM
-
2026-06-13days on market $129,900 Active 64 DOM
-
2026-06-09days on market $129,900 Active 61 DOM
-
2026-06-08days on market $129,900 Active 60 DOM
-
2026-06-07pricedays on market $129,900 Active 59 DOM
-
2026-06-03days on market $139,900 Active 55 DOM
-
2026-06-02days on market $139,900 Active 54 DOM
-
2026-06-01days on market $139,900 Active 53 DOM
-
2026-05-31days on market $139,900 Active 52 DOM
-
2026-05-14price $139,900
-
2026-04-09$144,900 Active
-
2007-09-28soldstatus $57,000 163-char remark
Show marketing remark (163 chars)
Beloved home of original owner! New roof, bath updated, hardwood floors, new carpeting Level 2, family rm LL. Meticulously maintained! Storage shed. Move right in.
-
2007-07-16$62,000 163-char remark
Show marketing remark (163 chars)
Beloved home of original owner! New roof, bath updated, hardwood floors, new carpeting Level 2, family rm LL. Meticulously maintained! Storage shed. Move right in.
ⓘ Source: listings_history table (triggers on properties + properties_extension) + one-shot
backfill from property_details.listing_events for pre-trigger history.
Tax reassessment forecast OH · Partial reset (capped growth)
- Current annual tax
- $1,917 · $160/mo
- Projected year-2 tax
- $1,917 · $160/mo
- Expected delta
- $0/yr ($0/mo · 0.0%)
ⓘ Screening estimate from a state-policy table — verify with the county assessor before closing.
Climate risk First Street
- Flood 9/10 Extreme FEMA zone X (unshaded) · 99% chance over 30 yrs
- Wildfire 1/10 Low
- Heat 4/10 Moderate 7 d/yr ≥103°F today · 19 d/yr by 30 yrs out
- Wind 2/10 Low 100% chance of damaging wind over 30 yrs
- Air quality 3/10 Moderate 3 unhealthy d/yr today · 5 by 30 yrs out
Nearby sold comps map
Loading sold comps map…
Walkable amenities ~0.75 mi
Loading nearby amenities…
Taxation est. · year 1
- Rental income
- $16,929
- − Mortgage interest
- −$6,716
- − Property taxes
- −$1,917
- − Insurance
- −$1,266
- − Repairs & maintenance
- −$1,354
- − Management
- −$1,354
- − Depreciation
- −$3,488
- Taxable income
- $833
- Est. tax owed @ 24.0%
- −$200
- After-tax cash flow
- $2,446/yr
For passive investors: Depreciation is non-cash, so a rental often shows a tax loss while cash-flowing — sheltering income. Rental losses are passive: they offset passive income freely, and up to $25,000/yr can offset ordinary (W-2) income if you actively participate and your MAGI is under $100k (phasing out to $0 by $150k); unused losses carry forward. On sale, claimed depreciation is recaptured at up to 25%, and gains may owe capital-gains tax (a 1031 exchange can defer both). Figures are a year-1 estimate at your 24.0% rate — not tax advice; consult a CPA.
Schools (NCES district)
- District
- Cincinnati Public Schools
- NCES district ID
- 3904375
- Math proficiency
- 25% ▼ -19.00%
- Reading proficiency
- 36% ▼ -14.00%
- Median HH income
- $35,743
- Composite
- 25.21/100
- National rank
- #7508
- State rank
- #581 of 656 in OH
Livability — Cincinnati
- Score
- 80/100
- State rank
- #130
- US rank
- #1856
Category grades
Schools grade is shown separately in the Schools card above.
Census & demographics
- Census place
- Cincinnati, OH
- County
- Hamilton County · 701,295 people
- City population
- 505,555
- Metro
- Cincinnati, OH-KY-IN
- Population (ZIP)
- 48,351
- Household income
- $66,277
- Rent vs Own
- Severe rent burden
- 2012.0
Population outlook (Hamilton County) Hauer SSP2
- Today (2025)
- 826,054 people
- By 2030
- 830,947 · +0.6%
- By 2040
- 832,319 · +0.8%
- By 2050
- 822,428 · -0.4%
- By 2075
- 788,688 · -4.5%
- By 2100
- 710,674 · -14.0%
Race, ethnicity, and origin ACS 2023
- Neighborhood character
- Majority White (64%)
- Race & ethnicity
- White 64% Black 28% Two or more races 6% Hispanic / Latino 3%
- Common ancestry
- Italian 2% Lithuanian 2% Slovak 1%
- Foreign-born
- 10% · Canada
- Languages at home
- 88% English-only · French/Haitian/Cajun 4% Spanish 2% German/W. Germanic 1%
Political lean MEDSL · Hamilton
- 2024 margin
- D (+14.9) · D 57.0% · R 42.1%
- 2008→2024 swing
- +7.9pp toward D · 2008: 7.0pp · 2024: 14.9pp
- All cycles
- 2024: D+14.9 2020: D+15.9 2016: D+9.5 2012: D+4.9 2008: D+7.0
Not yet ingested
- Civics
- —
Market trends
- HPI YoY
- ▼ -197.57%
- Current HPI
- 213.5097
- Rent YoY
- ▲ 4.87%
- Metro
- Cincinnati, OH-KY-IN
- State GDP YoY
- ▲ 1.98%
- F500 in state
- 48
Industry mix (Fortune 500 HQ in OH)
| Industry | F500 HQs | Revenue |
|---|---|---|
| Insurance | 3 | $145B |
|
||
| Industrial Machinery | 3 | $49B |
|
||
| Financial Services | 3 | $24B |
|
||
| Consumer Goods | 2 | $93B |
|
||
| Aerospace / Defense | 2 | $47B |
|
||
| Utilities | 2 | $33B |
|
||
Price history
+125.6% since first listed4 events — show timeline
- 2026-05-14 Price Changed $139,900 Cincy MLS
- 2026-04-09 Listed $144,900 Cincy MLS
- 2007-09-28 Sold (MLS) $57,000 Cincy MLS
- 2007-07-16 Listed $62,000 Cincy MLS
Property tax history
+10.8%/yrLatest (2025): $1,917 · +0.1% YoY. Source: county tax records.
Cash-flow waterfall
monthlySold comps — $/sqft
last 12 mo · ≤1 miLoading sold comps…