158 Cranford Rd · Fountain Inn, SC
Flood risk 1/10 · Minimal
- FEMA flood zone
- X (unshaded)
- Chance of flooding over 30 yrs
- 0.0%
- Est. flood insurance / yr
- $507 – $1,088
Fire risk 4/10 · Minor
- Est. fire insurance / yr
- $783 – $1,453
Heat risk 5/10 · Moderate
- Hot days now (above 104°F)
- 7 days/yr
- Hot days in 30 yrs
- 15 days/yr
Wind risk 2/10 · Minimal
- Chance of severe wind over 30 yrs
- 3.0%
Air-quality risk 3/10 · Minor
- Unhealthy air days now
- 3 days/yr
- Unhealthy air days in 30 yrs
- 3 days/yr
Risk factors via First Street. Map © Google.
Why this score? — see what drove the D+ grade
The composite is a weighted blend of 9 inputs, each scored 0–100. Each bar is that input's sub-score; the figure is the points it added to the 100-point composite (weight × sub-score).
- ARV discount +12.5/15.0
- Cash flow +11.6/30.0
- Schools +4.2/10.0
- Livability +4.1/5.0
- Condition / age +4.0/5.0
- 1% rule +3.6/10.0
- Rent growth +3.6/5.0
- DSCR +3.4/10.0
- Appreciation +0.0/10.0
$281,900
🖨 Deal sheet 📄 Offer letter ✓ Due diligence
Listing remarks MLS
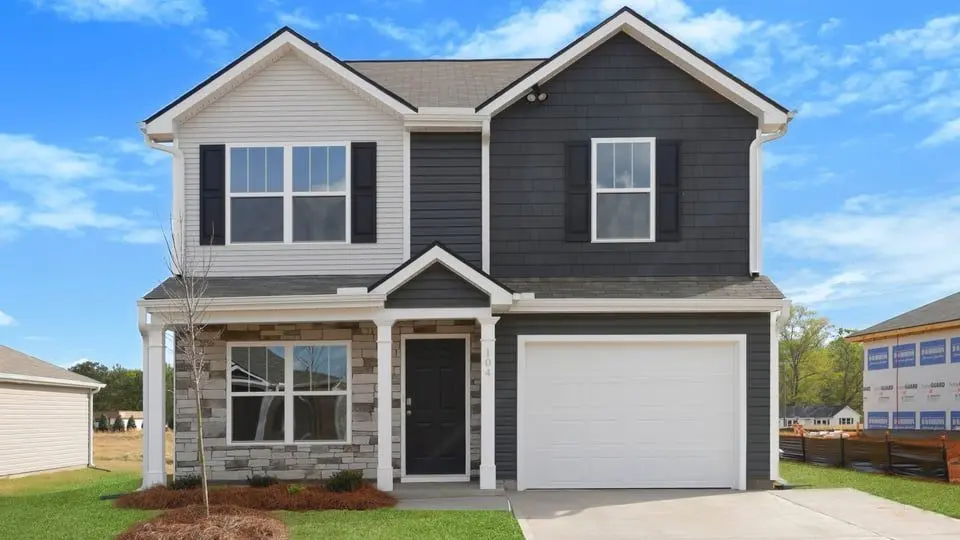
Check out 158 Cranford Road a beautiful new home in our Cedar Gap community. This spacious two-story home features three bedrooms, two and a half bathrooms, and a one-car garage, providing the perfect space for both relaxing and entertaining. As you enter the home, you'll be welcomed into the great room, a warm and inviting atmosphere. At the back of the home, the well-appointed kitchen opens into the dining area, creating an ideal space for gatherings. The kitchen is equipped with a pantry, stainless steel appliances, and a large breakfast bar, making it perfect for both cooking and casual dining. The primary suite Features a peaceful retreat with a large walk-in closet and an en suite bathroom featuring dual vanities and a spacious shower. The two additional bedrooms share a full bathroom with dual vanities, providing ample space and convenience. The laundry room is also located on the second floor for added convenience. Outside, you'll enjoy a patio that's perfect for outdoor entertaining or simply soaking in the beautiful weather. With its spacious design and well-planned layout, this home Features both comfort and functionality for modern living. Pictures are representative.
Key facts
- Pantry
- Large breakfast bar
- Primary suite
Tags
Property features AI
Finance
- Other: Approximate completion date: 2026-08-17
- HOA & community: Homeowners association present; HOA includes pool, street lights, and restrictive covenants; Community amenities include common areas, lighting, pool, and some sidewalks
Exterior
- Parking: Attached garage with door opener (1-car); Paved concrete driveway
- Utilities: Public water; Public sewer; Public garbage pickup; Gas tankless water heater
- Home design: Two-story single-family home (Brandon E model); Under construction; Slab foundation; Underground utilities; Level lot (1/2 acre or less)
- Construction: Built by D.R. Horton
- Exterior features: Patio; Tilt-out windows; Vinyl and aluminum trim; Thermal windows; Stone and vinyl siding exterior; Composition shingle roof
Interior
- Kitchen: Dishwasher; Garbage disposal; Gas range (freestanding); Self-cleaning oven; Built-in microwave
- Bedrooms: Primary bedroom on second level with double sink, full bath, shower (no tub), and walk-in closet; Bedroom sizes: Primary ~13 x 15, Second ~11 x 10, Third ~15 x 10
- Flooring: Carpet; Luxury vinyl tile/plank
- Bathrooms: Two full bathrooms and one half bathroom
- Heating & cooling: Forced-air heating (natural gas); Central electric cooling
- Interior features: Attic pull-down stairs; Cable available; Smooth ceilings; Open floor plan; Smoke detector; Walk-in pantry; Quartz countertops; Radon mitigation system; Smart systems pre-wiring; No fireplace
- Laundry & utility: Laundry on second floor with walk-in area and electric dryer hookup
Neighborhood map
What this means for you Summary
Snapshot
- This is a 3-bed/2.5-bath single-family listed at $282k. Condition is rated good.
Deal economics
- At list price, monthly cash flow is $-90 ($-1k/yr) — negative.
- To cash-flow at today's rent, offer at most $269k (4.6% below list).
- To meet the 1% rule (rent ≥ 1% of price), the offer needs to be $242k (14.3% below list).
- Recommended offer: $242k (14.3% below list) — sets the bar for 1% rule.
- Cap rate 5.9% vs local median 4.2% in Fountain Inn — top-decile yield for the area; either an underpriced asset or a hidden risk that comps aren't pricing in. Stress-test before assuming the spread holds.
Location & tenants
- Location reads 82/100 on livability (#4 in SC, #1,162 nationally) — a professional / high-income tenant draw. Strengths: crime A+, cost of living A+, housing A+; Watch: commute F.
- Greenville 01 (suburban): math 44% / reading 54% proficiency, ranked #10 of 80 in SC (top 12%) — families likely to look elsewhere, expect single-tenant / working-renter base with shorter leases.
- Zoned schools: Bryson Elementary (math 52% / reading 52%, grade C-, #145 of 597 statewide, top 26%, 911 students, 70% FRL) — zoned schools average 70% FRL vs 42% district-wide (28 pts higher); higher-poverty schools than district average — tighter screening recommended.
- Market conditions: Rents rising fast (+4.5%/yr); 482 active listings in the ZIP; 3 comparable units currently listed for rent nearby; rentals at typical pace (median 19d on market — plan ~3-4 weeks tenant-placement turnaround); 5,595 units permitted in Greenville County in 2024 (566 in 5+ unit buildings).
- This rent runs 41% of the median local income ($70k/yr) — at the standard rent-burdened threshold; future hikes will face affordability resistance.
Forward outlook
- Local home prices are declining (-3.0%/yr); year-one equity from $2k of loan paydown is wiped out by about $8k of value loss. Plan a longer hold.
- Greenville County population projected at +34% by 2050 — long-run rental-demand tailwind backs the buy-and-hold thesis.
Negotiation context
- It's been on market 30 days — a 2% lower offer ($278k) is reasonable based on typical stale-listing flexibility.
- 2 sale attempts with the ask held roughly flat each time — persistent listings suggest the price (not the market) is what's stuck; bring a comps-based counter.
Risks & watch-outs
- Climate carrying-cost: extreme-heat days projected 7→15/yr by 2055 (HVAC capex compounding) — expect insurance premiums to compound above CPI over the hold.
Questions for the listing agent
- What do current leases actually rent for vs. the listed asking? Can we see a recent rent roll and the last 12 months of T-12 income?
- What does the HOA fee cover, when was the last increase, and are there any pending special assessments or reserve-fund shortfalls?
- Is there a deadline driving the sale (1031 exchange, divorce, estate, relocation)? That informs how much negotiation room exists.
- The area grade is low — what's the realistic commute time and amenity access for the typical tenant pool here? Any planned neighborhood developments (good or bad) we should know about?
- What's the average days-on-market for RENTAL listings here right now (not sales)? A rising rental-DOM trend means longer vacancies and softer asking-rent achievability than the comps imply.
- What's the recent tenant-quality profile in this submarket — average credit score on applications, eviction rate, late-payment / NSF rate, and stable-employment percentage? A property-management company in the area should have these aggregated.
- How much new for-sale + rental construction is in the pipeline within 1–3 miles? Heavy new supply typically softens prices + rents 12–24 months out; constrained supply supports both.
Investment metrics
- 1% rule
- 0.86% ✗
- Cap rate
- 5.91%
- Cash-on-cash
- -1.36%
- DSCR
- 0.94
- GRM
- 9.7
CMA / ARV
- ARV (on-the-fly)
- $317,262
- Comps found
- 2
Show comp detail 2 sales within ~0.75 mi
| Address | Dist | Beds/Ba | Sqft | Sold | Price | $/sf | Match |
|---|---|---|---|---|---|---|---|
| 104 Beechcroft Pl | 0.41mi | 3/2.0 | 1,533 (+1%) | 6mo | $300,475 | $196 | 72 |
| 516 Crossgate Way | 0.40mi | 4/2.0 (+1) | 1,434 (-6%) | 23mo | $300,000 | $209 | 46 |
Match score weights: distance 35% · size 25% · config 20% · recency 20%. Top-matched comps best support the ARV.
Projected returns pro-forma
-3.0% appreciation · 4.55% rent growth · sell at horizon
- IRR
- -16.8%
- Equity multiple
- 0.40×
- Total profit
- $-47,499
- Equity at exit
- $42,032
- IRR
- -5.9%
- Equity multiple
- 0.59×
- Total profit
- $-32,241
- Equity at exit
- $24,374
Cash invested: $78,932 (down + closing). Projections, not guarantees.
Landlord ↔ Tenant lean methodology
- Overall (STATE)
- 90 Strongly Landlord-Friendly
- State South Carolina
- 90 Strongly Landlord-Friendly · R+6
- County
- — inherits STATE
- City
- — inherits STATE
ZIP-level market 29644
- Home prices YoY
- -28.6%
- Rents YoY
- 4.5%
- Active inventory
- 482
- Price-to-rent
- 9.7×
Monthly cashflow live
- Estimated rent
- $2,416 medium interval (Pro) →
- Mortgage (P&I)
- −$1,478
- Tax est. 1.5%
- −$352 /mo · $4,228/yr
- Insurance
- −$117
- HOA
- −$50
- Vacancy / Maint / Mgmt
- −$507
- Net cashflow
- $-90
Break-even live
UW: 25.0% down · 7.5% · 30yr · 1.5% tax · 5.0% vac · 8.0% maint · 8.0% mgmt
Financing live
Cash to close
- Down payment
- $70,475
- Closing costs
- $8,457
- Reserves months
- —
- Total cash needed
- —
Loan-product check · same deal, 3 products live
Conventional
25% down · 7.5% · 30yr
- Down + closing
- —
- Monthly P&I
- —
- Monthly cashflow
- —
- DSCR
- —
- Eligible?
- —
Personal DTI + credit; lowest rate.
DSCR
20% down · 8.5% · 30yr
- Down + closing
- —
- Monthly P&I
- —
- Monthly cashflow
- —
- DSCR
- —
- Eligible?
- —
No personal income docs; deal must DSCR.
Hard money
10% down · 12.0% · 12mo
- Down + closing
- —
- Monthly P&I
- —
- Monthly cashflow
- —
- DSCR
- —
- Eligible?
- —
Short-term bridge; refi at stabilization.
Rent comps 3 comps
| Address | Beds | Baths | Sqft | Rent | $/sqft | DOM | Units | Dist |
|---|---|---|---|---|---|---|---|---|
| 119 Cranford Rd Fountain Inn, SC | 4.0 | 3.0 | 2174 | $2,495 | $1.15 | 19d | 1 | 0.13mi |
| 4 Rockshire Trl Fountain Inn, SC | 3.0 | 2.5 | 1400 | $1,900 | $1.36 | 23d | 1 | 1.10mi |
| 101 Fennec Dr Fountain Inn, SC | 3.0 | 3.0 | 1735 | $2,099 | $1.21 | 3d | 1 | 1.33mi |
HOA detail
- Monthly dues
- $50 · $600/yr
Listing history 16 events
-
2026-06-18days on market $281,900 Active 30 DOM
-
2026-06-17days on market $281,900 Active 29 DOM
-
2026-06-16days on market $281,900 Active 28 DOM
-
2026-06-15days on market $281,900 Active 27 DOM
-
2026-06-13days on market $281,900 Active 25 DOM
-
2026-06-13days on market $281,900 Active 24 DOM
-
2026-06-10days on market $281,900 Active 22 DOM
-
2026-06-09days on market $281,900 Active 21 DOM
-
2026-06-08days on market $281,900 Active 20 DOM
-
2026-06-07days on market $281,900 Active 19 DOM
-
2026-06-03days on market $281,900 Active 15 DOM
-
2026-06-03days on market $281,900 Active 14 DOM
-
2026-06-01days on market $281,900 Active 13 DOM
-
2026-05-31days on market $281,900 Active 12 DOM
-
2026-05-20$281,990 Active 1198-char remark
Show marketing remark (1198 chars)
Check out 158 Cranford Road a beautiful new home in our Cedar Gap community. This spacious two-story home features three bedrooms, two and a half bathrooms, and a one-car garage, providing the perfect space for both relaxing and entertaining. As you enter the home, you'll be welcomed into the great room, a warm and inviting atmosphere. At the back of the home, the well-appointed kitchen opens into the dining area, creating an ideal space for gatherings. The kitchen is equipped with a pantry, stainless steel appliances, and a large breakfast bar, making it perfect for both cooking and casual dining. The primary suite Features a peaceful retreat with a large walk-in closet and an en suite bathroom featuring dual vanities and a spacious shower. The two additional bedrooms share a full bathroom with dual vanities, providing ample space and convenience. The laundry room is also located on the second floor for added convenience. Outside, you'll enjoy a patio that's perfect for outdoor entertaining or simply soaking in the beautiful weather. With its spacious design and well-planned layout, this home Features both comfort and functionality for modern living. Pictures are representative.
-
2026-05-19$281,990 Active
ⓘ Source: listings_history table (triggers on properties + properties_extension) + one-shot
backfill from property_details.listing_events for pre-trigger history.
Climate risk First Street
- Flood 1/10 Low FEMA zone X (unshaded) · 0% chance over 30 yrs
- Wildfire 4/10 Moderate
- Heat 5/10 Major 7 d/yr ≥104°F today · 15 d/yr by 30 yrs out
- Wind 2/10 Low 3% chance of damaging wind over 30 yrs
- Air quality 3/10 Moderate 3 unhealthy d/yr today · 3 by 30 yrs out
Nearby sold comps map
Loading sold comps map…
Walkable amenities ~0.75 mi
Loading nearby amenities…
Taxation est. · year 1
- Rental income
- $28,989
- − Mortgage interest
- −$15,791
- − Property taxes
- −$4,228
- − Insurance
- −$1,410
- − Repairs & maintenance
- −$2,319
- − Management
- −$2,319
- − HOA
- −$600
- − Depreciation
- −$8,201
- Taxable loss
- −$5,878
- Est. tax savings @ 24.0%
- +$1,411
- After-tax cash flow
- $335/yr
For passive investors: Depreciation is non-cash, so a rental often shows a tax loss while cash-flowing — sheltering income. Rental losses are passive: they offset passive income freely, and up to $25,000/yr can offset ordinary (W-2) income if you actively participate and your MAGI is under $100k (phasing out to $0 by $150k); unused losses carry forward. On sale, claimed depreciation is recaptured at up to 25%, and gains may owe capital-gains tax (a 1031 exchange can defer both). Figures are a year-1 estimate at your 24.0% rate — not tax advice; consult a CPA.
Condition & rehab AI · 1 photo
This beautiful new home in the Cedar Gap community is in excellent condition with no visible repairs needed. It offers a spacious layout, modern appliances, and a well-maintained exterior, making it an ideal investment for both resale and rental.
Value-add opportunities
- Both Painting — Enhances curb appeal and interior aesthetics
- Both Landscaping — Improves curb appeal and enhances property value
- Both New flooring — Updates the interior and improves comfort
- Both New kitchen appliances — Modernizes the kitchen and enhances functionality
Renovation cost estimate screening
Value-add ROI direction
- Both Painting — Enhances curb appeal and interior aesthetics ↑
- Both Landscaping — Improves curb appeal and enhances property value ↑
- Both New flooring — Updates the interior and improves comfort ↑
- Both New kitchen appliances — Modernizes the kitchen and enhances functionality ↑
ⓘ Cost ranges are severity-bucket heuristics (US national rule-of-thumb). Get contractor quotes + a written scope before underwriting a rehab budget.
Schools (NCES district)
- District
- Greenville 01
- NCES district ID
- 4502310
- Math proficiency
- 44% ▼ -10.00%
- Reading proficiency
- 54% ▼ -2.00%
- Median HH income
- $49,596
- Composite
- 41.88/100
- National rank
- #3370
- State rank
- #10 of 80 in SC
Livability — Fountain Inn
- Score
- 82/100
- State rank
- #4
- US rank
- #1162
Category grades
Schools grade is shown separately in the Schools card above.
Census & demographics
- Census place
- Fountain Inn, SC
- County
- Greenville County · 573,815 people
- City population
- 22,907
- Metro
- Greenville-Anderson, SC
- Population (ZIP)
- 22,907
- Household income
- $70,301
- Rent vs Own
- Severe rent burden
- 475.0
Population outlook (Greenville County) Hauer SSP2
- Today (2025)
- 574,580 people
- By 2030
- 615,615 · +7.1%
- By 2040
- 695,373 · +21.0%
- By 2050
- 769,367 · +33.9%
- By 2075
- 933,296 · +62.4%
- By 2100
- 1,029,196 · +79.1%
Race, ethnicity, and origin ACS 2023
- Neighborhood character
- Predominantly White (66%)
- Race & ethnicity
- White 66% Black 18% Two or more races 10% Hispanic / Latino 10%
- Hispanic origin (detail)
- Mexican 3% Puerto Rican 2%
- Common ancestry
- Slovak 3% Romanian 2% Lithuanian 2%
- Foreign-born
- 6% · Canada, Jamaica
- Languages at home
- 89% English-only · Spanish 9% Tagalog/Filipino 1%
Political lean MEDSL · Greenville
- 2024 margin
- Strong R (+22.2) · D 38.0% · R 60.2% · Other 1.8%
- 2008→2024 swing
- +1.7pp toward D · 2008: -23.9pp · 2024: -22.2pp
- All cycles
- 2024: R+22.2 2020: R+18.2 2016: R+24.7 2012: R+27.8 2008: R+23.9
Not yet ingested
- Civics
- —
Market trends
- HPI YoY
- ▼ -100.45%
- Current HPI
- 250.5271
- Rent YoY
- ▲ 4.55%
- Metro
- Greenville-Anderson, SC
- State GDP YoY
- ▲ 4.51%
- F500 in state
- 2
Industry mix (Fortune 500 HQ in SC)
| Industry | F500 HQs | Revenue |
|---|---|---|
| Packaging | 1 | $7B |
|
||
Price history
+0.0% since first listed2 events — show timeline
- 2026-05-20 Listed $281,990 Zillow
- 2026-05-19 Listed $281,990 Greater Greenville MLS
Cash-flow waterfall
monthlySold comps — $/sqft
last 12 mo · ≤1 miLoading sold comps…