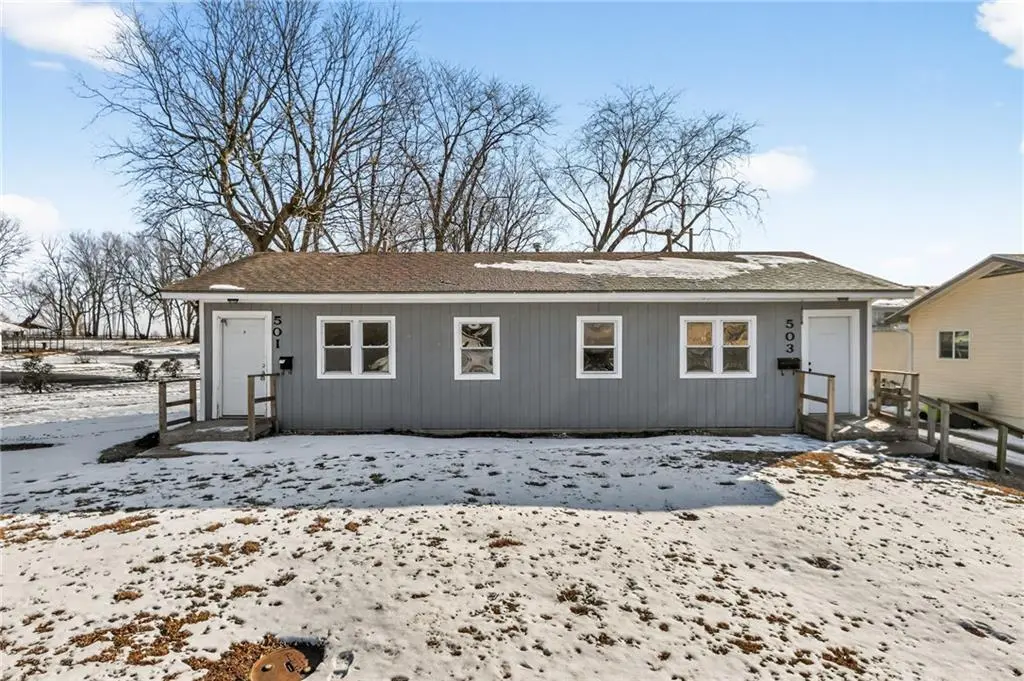
501 Maier Dr · Belton, MO
Flood risk 1/10 · Minimal
- FEMA flood zone
- X (unshaded)
- Chance of flooding over 30 yrs
- 0.0%
- Est. flood insurance / yr
- $473 – $860
Fire risk 3/10 · Minor
- Est. fire insurance / yr
- $1,054 – $1,958
Heat risk 4/10 · Minor
- Hot days now (above 107°F)
- 7 days/yr
- Hot days in 30 yrs
- 17 days/yr
Wind risk 2/10 · Minimal
- Chance of severe wind over 30 yrs
- —
Air-quality risk 2/10 · Minimal
- Unhealthy air days now
- 2 days/yr
- Unhealthy air days in 30 yrs
- 2 days/yr
Risk factors via First Street. Map © Google.
Why this score? — see what drove the C grade
The composite is a weighted blend of 9 inputs, each scored 0–100. Each bar is that input's sub-score; the figure is the points it added to the 100-point composite (weight × sub-score).
- Cash flow +19.8/30.0
- ARV discount +15.0/15.0
- DSCR +6.3/10.0
- 1% rule +4.6/10.0
- Rent growth +3.8/5.0
- Livability +3.8/5.0
- Schools +3.0/10.0
- Condition / age +2.5/5.0
- Appreciation +0.0/10.0
$175,000
🖨 Deal sheet 📄 Offer letter ✓ Due diligence
Listing remarks
Calling all investors and house hackers! This turn-key duplex in Belton, Missouri is fully ready for immediate occupancy and income generation. Each side features a well-designed 1 bed, 1 bath layout—making it easy to maintain and consistently rent. Recently remodeled and freshly painted throughout, this property offers a clean, modern feel that tenants will love. With all the major work already completed, you can step in and start collecting rent from day one—no heavy lifting required. Whether you’re looking to expand your portfolio or live in one unit while offsetting your mortgage with rental income from the other, this is a prime opportunity. Strong rental appeal, low
Key facts
- 7,362 sq ft lot
- Built 1960
- Listed 74 days
Property features AI
Finance
- Other: Zoning: R-3
- Financial info: Gross income reported as $19,200 annually; Operating expenses include other items (not specified); Current occupancy approximately 90–95%; Two total units
- HOA & community: No association fees
Exterior
- Parking: Off-site parking
- Utilities: Public water; Public sewer; Individual water heaters; Separate meters
- Home design: Duplex residential income property; Single-story
- Construction: Board & batten siding; Concrete construction; Composition roof; Estimated age: 76–100 years
- Exterior features: Paved road access; Publicly maintained road; Property not in a flood plain
Interior
- Kitchen: No kitchen appliance details provided
- Bedrooms: Two 1-bedroom units (each unit listed as 1 bedroom)
- Bathrooms: Each unit has 1 bathroom
- Heating & cooling: Wall furnace; Cooling present (other type)
- Interior features: Wall furnace heating; Has cooling (type listed as Other)
- Laundry & utility: Individual water heaters; Separate utility meters
Neighborhood map
What this means for you Summary
Snapshot
- This is a 2-bed/4.0-bath single-family listed at $175k.
Deal economics
- At list price, monthly cash flow is $210 ($3k/yr) — positive.
- The deal already cash-flows at list — no discount required.
- To meet the 1% rule (rent ≥ 1% of price), the offer needs to be $167k (4.4% below list).
- Recommended offer: $164k (6.0% below list) — sets the bar for market timing.
- Cap rate 7.7% vs local median 4.7% in Belton — top-decile yield for the area; either an underpriced asset or a hidden risk that comps aren't pricing in. Stress-test before assuming the spread holds.
Location & tenants
- Location reads 76/100 on livability (#52 in MO, #3,782 nationally) — a middle-class / working-renter tenant base. Strengths: cost of living A+, housing A+, health & safety A+; Watch: crime C-, schools D+, commute F.
- Belton 124 (suburban): math 28% / reading 39% proficiency, ranked #216 of 324 in MO (top 67%) — families likely to look elsewhere, expect single-tenant / working-renter base with shorter leases.
- Market conditions: Rents rising fast (+5.2%/yr); 204 active listings in the ZIP; 8 comparable units currently listed for rent nearby; rentals leasing fast (median 8d on market — plan ~1-2 weeks tenant-placement turnaround); 588 units permitted in Cass County in 2024 (0 in 5+ unit buildings).
Forward outlook
- Local home prices are declining (-3.0%/yr); year-one equity from $1k of loan paydown is wiped out by about $5k of value loss. Plan a longer hold.
- Cass County population projected to shrink 3% by 2050 — rents likely to lag national; underwrite the cash flow, not the appreciation.
Negotiation context
- It's been on market 74 days — a 6% lower offer ($164k) is reasonable based on typical stale-listing flexibility.
Questions for the listing agent
- It's been on market 74 days. Have you received any prior offers? Is the seller open to a 6% concession, seller financing, or rate buy-down credit?
- Built in 1960 — when were the roof, HVAC, electrical panel, plumbing, and water heater last replaced?
- Why hasn't it sold? Are there any deal-killer items the seller is aware of (foundation, flood, title, zoning, code violations)?
- Is there a deadline driving the sale (1031 exchange, divorce, estate, relocation)? That informs how much negotiation room exists.
- Schools are D-rated, which usually means shorter tenancies and higher turnover. Who's the typical renter profile here, and what's been the actual vacancy rate?
- What's the average days-on-market for RENTAL listings here right now (not sales)? A rising rental-DOM trend means longer vacancies and softer asking-rent achievability than the comps imply.
- What's the recent tenant-quality profile in this submarket — average credit score on applications, eviction rate, late-payment / NSF rate, and stable-employment percentage? A property-management company in the area should have these aggregated.
- How much new for-sale + rental construction is in the pipeline within 1–3 miles? Heavy new supply typically softens prices + rents 12–24 months out; constrained supply supports both.
Investment metrics
- 1% rule
- 0.96% ✗
- Cap rate
- 7.73%
- Cash-on-cash
- 5.13%
- DSCR
- 1.23
- GRM
- 8.7
CMA / ARV
- ARV (on-the-fly)
- $215,280
- Comps found
- 12
Show comp detail 12 sales within ~0.75 mi
| Address | Dist | Beds/Ba | Sqft | Sold | Price | $/sf | Match |
|---|---|---|---|---|---|---|---|
| 621 Main St | 0.30mi | 2/1.0 | 1,060 (-4%) | 5mo | $175,000 | $165 | 63 |
| 708 Cedar St | 0.25mi | 2/1.0 | 1,060 (-4%) | 14mo | $155,000 | $146 | 58 |
| 612 S Cedar St | 0.35mi | 3/1.0 (+1) | 1,076 (-2%) | 8mo | $210,000 | $195 | 55 |
| 202 E Pacific Dr | 0.38mi | 3/1.0 (+1) | 1,056 (-4%) | 10mo | $170,000 | $161 | 50 |
| 513 S Cedar St | 0.25mi | 3/1.0 (+1) | 1,256 (+14%) | 3mo | $215,000 | $171 | 46 |
| 602 S Cedar St | 0.31mi | 3/1.0 (+1) | 956 (-13%) | 1mo | $269,900 | $282 | 45 |
| 403 Robie Dr | 0.53mi | 3/2.0 (+1) | 1,014 (-8%) | 4mo | $220,000 | $217 | 45 |
| 309 Herschel St | 0.38mi | 3/1.0 (+1) | 1,212 (+10%) | 10mo | $186,000 | $153 | 41 |
| 806 S Cedar St | 0.44mi | 3/2.0 (+1) | 1,260 (+14%) | 6mo | $285,000 | $226 | 38 |
| 206 Brookview Dr | 0.74mi | 3/1.5 (+1) | 1,032 (-6%) | 4mo | $175,000 | $170 | 37 |
| 709 S Scott Ave | 0.56mi | 3/2.0 (+1) | 956 (-13%) | 3mo | $235,000 | $246 | 36 |
| 204 Brookview Dr | 0.71mi | 3/1.5 (+1) | 989 (-10%) | 15mo | $195,000 | $197 | 22 |
Match score weights: distance 35% · size 25% · config 20% · recency 20%. Top-matched comps best support the ARV.
Projected returns pro-forma
-3.0% appreciation · 5.17% rent growth · sell at horizon
- IRR
- -6.1%
- Equity multiple
- 0.77×
- Total profit
- $-11,311
- Equity at exit
- $26,093
- IRR
- 5.8%
- Equity multiple
- 1.47×
- Total profit
- $23,216
- Equity at exit
- $15,131
Cash invested: $49,000 (down + closing). Projections, not guarantees.
Landlord ↔ Tenant lean methodology
- Overall (STATE)
- 81 Strongly Landlord-Friendly
- State Missouri
- 81 Strongly Landlord-Friendly · R+10
- County
- — inherits STATE
- City
- — inherits STATE
ZIP-level market 64012
- Rents YoY
- 5.2%
- Active inventory
- 204
- Price-to-rent
- 8.7×
Monthly cashflow live
- Estimated rent
- $1,674 high interval (Pro) →
- Mortgage (P&I)
- −$918
- Tax from tax record
- −$122 /mo · $1,466/yr
- Insurance
- −$73
- HOA
- −$0
- Vacancy / Maint / Mgmt
- −$352
- Net cashflow
- $210
Break-even live
UW: 25.0% down · 7.5% · 30yr · 1.5% tax · 5.0% vac · 8.0% maint · 8.0% mgmt
Financing live
Cash to close
- Down payment
- $43,750
- Closing costs
- $5,250
- Reserves months
- —
- Total cash needed
- —
Loan-product check · same deal, 3 products live
Conventional
25% down · 7.5% · 30yr
- Down + closing
- —
- Monthly P&I
- —
- Monthly cashflow
- —
- DSCR
- —
- Eligible?
- —
Personal DTI + credit; lowest rate.
DSCR
20% down · 8.5% · 30yr
- Down + closing
- —
- Monthly P&I
- —
- Monthly cashflow
- —
- DSCR
- —
- Eligible?
- —
No personal income docs; deal must DSCR.
Hard money
10% down · 12.0% · 12mo
- Down + closing
- —
- Monthly P&I
- —
- Monthly cashflow
- —
- DSCR
- —
- Eligible?
- —
Short-term bridge; refi at stabilization.
Rent comps 8 comps
| Address | Beds | Baths | Sqft | Rent | $/sqft | DOM | Units | Dist |
|---|---|---|---|---|---|---|---|---|
| 810 York Dr Belton, MO | 3.0 | 2.5 | 1148 | $1,781 | $1.55 | 20d | 1 | 0.50mi |
| 307 Dauphine St Belton, MO | 3.0 | 2.0 | 1225 | $1,495 | $1.22 | 23d | 1 | 0.53mi |
| 210 Mill St Belton, MO | 2.0 | 1.0 | 700 | $1,100 | $1.57 | 23d | 1 | 0.77mi |
| 301 Towne Center Dr Belton, MO | 1.0–2.0 | 1.0–2.0 | 1069 | $1,799 | $1.68 | 1d | 9 | 0.89mi |
| 6407 E 163rd St Belton, MO | 1.0 | 1.0 | 782 | $1,492 | $1.91 | 1d | 4 | 0.93mi |
| 1513 Sycamore Dr Belton, MO | 2.0–3.0 | 2.5 | 1315 | $1,589 | $1.21 | 1d | 8 | 0.93mi |
| 611 W Sunrise Dr Belton, MO | 3.0 | 2.5 | 1496 | $1,990 | $1.33 | 7d | 1 | 1.17mi |
| 107 N Cleveland Ave Belton, MO | 3.0 | 2.0 | 1128 | $1,860 | $1.65 | 4d | 1 | 1.42mi |
Listing history 13 events
-
2026-06-15statusdays on market $175,000 Pending 74 DOM
-
2026-06-13days on market $175,000 Active 73 DOM
-
2026-06-13days on market $175,000 Active 72 DOM
-
2026-06-09days on market $175,000 Active 69 DOM
-
2026-06-08days on market $175,000 Active 68 DOM
-
2026-06-07days on market $175,000 Active 67 DOM
-
2026-06-05days on market $175,000 Active 64 DOM
-
2026-06-03days on market $175,000 Active 63 DOM
-
2026-06-02days on market $175,000 Active 62 DOM
-
2026-06-01days on market $175,000 Active 61 DOM
-
2026-05-31days on market $175,000 Active 60 DOM
-
2026-04-01$175,000 Active
-
2022-05-10soldstatus
ⓘ Source: listings_history table (triggers on properties + properties_extension) + one-shot
backfill from property_details.listing_events for pre-trigger history.
Tax reassessment forecast MO · Resets to sale price
- Current annual tax
- $1,466 · $122/mo
- Projected year-2 tax
- $1,698 · $141/mo
- Expected delta
- +$232/yr (+$19/mo · 15.8%)
ⓘ Screening estimate from a state-policy table — verify with the county assessor before closing.
Climate risk First Street
- Flood 1/10 Low FEMA zone X (unshaded) · 0% chance over 30 yrs
- Wildfire 3/10 Moderate
- Heat 4/10 Moderate 7 d/yr ≥107°F today · 17 d/yr by 30 yrs out
- Wind 2/10 Low
- Air quality 2/10 Low 2 unhealthy d/yr today · 2 by 30 yrs out
Nearby sold comps map
Loading sold comps map…
Walkable amenities ~0.75 mi
Loading nearby amenities…
Taxation est. · year 1
- Rental income
- $20,086
- − Mortgage interest
- −$9,803
- − Property taxes
- −$1,466
- − Insurance
- −$875
- − Repairs & maintenance
- −$1,607
- − Management
- −$1,607
- − Depreciation
- −$5,091
- Taxable loss
- −$362
- Est. tax savings @ 24.0%
- +$87
- After-tax cash flow
- $2,602/yr
For passive investors: Depreciation is non-cash, so a rental often shows a tax loss while cash-flowing — sheltering income. Rental losses are passive: they offset passive income freely, and up to $25,000/yr can offset ordinary (W-2) income if you actively participate and your MAGI is under $100k (phasing out to $0 by $150k); unused losses carry forward. On sale, claimed depreciation is recaptured at up to 25%, and gains may owe capital-gains tax (a 1031 exchange can defer both). Figures are a year-1 estimate at your 24.0% rate — not tax advice; consult a CPA.
Schools (NCES district)
- District
- Belton 124
- NCES district ID
- 2904620
- Math proficiency
- 28% ▼ -9.00%
- Reading proficiency
- 39% ▼ -9.00%
- Median HH income
- $56,946
- Composite
- 29.73/100
- National rank
- #6446
- State rank
- #216 of 324 in MO
Livability — Belton
- Score
- 76/100
- State rank
- #52
- US rank
- #3782
Category grades
Schools grade is shown separately in the Schools card above.
Census & demographics
- Census place
- Belton, MO
- County
- Cass County · 65,358 people
- City population
- 29,304
- Metro
- Kansas City, MO-KS
- Population (ZIP)
- 29,304
- Household income
- $71,814
- Rent vs Own
- Severe rent burden
- 1081.0
Population outlook (Cass County) Hauer SSP2
- Today (2025)
- 105,292 people
- By 2030
- 106,109 · +0.8%
- By 2040
- 105,786 · +0.5%
- By 2050
- 102,062 · -3.1%
- By 2075
- 88,569 · -15.9%
- By 2100
- 68,293 · -35.1%
Race, ethnicity, and origin ACS 2023
- Neighborhood character
- Predominantly White (80%)
- Race & ethnicity
- White 80% Two or more races 7% Hispanic / Latino 7% Black 6% Asian 1%
- Hispanic origin (detail)
- Mexican 5%
- Common ancestry
- Italian 2% Lithuanian 2% Portuguese 2%
- Foreign-born
- 2% · Canada
- Languages at home
- 96% English-only · Spanish 2% German/W. Germanic 1% Other Asian/Pacific 1%
Political lean MEDSL · Cass
- 2024 margin
- Solid R (+32.1) · D 33.3% · R 65.4% · Other 1.3%
- 2008→2024 swing
- -12.5pp toward R · 2008: -19.6pp · 2024: -32.1pp
- All cycles
- 2024: R+32.1 2020: R+31.6 2016: R+35.9 2012: R+28.4 2008: R+19.6
Not yet ingested
- Civics
- —
Market trends
- HPI YoY
- ▼ -244.76%
- Current HPI
- 214.6157
- Rent YoY
- ▲ 5.17%
- Metro
- Kansas City, MO-KS
- State GDP YoY
- ▲ 1.84%
- F500 in state
- 20
Industry mix (Fortune 500 HQ in MO)
| Industry | F500 HQs | Revenue |
|---|---|---|
| Healthcare | 1 | $163B |
|
||
| Insurance | 1 | $21B |
|
||
| Industrial Technology | 1 | $17B |
|
||
| Retail | 1 | $16B |
|
||
| Industrial Distribution | 1 | $10B |
|
||
| Utilities | 1 | $9B |
|
||
Price history
2 events — show timeline
- 2026-04-01 Listed $175,000 Heartland MLS as Distributed by MLS Grid
- 2022-05-10 Sold (Public Records) — Public Records
Property tax history
+6.2%/yrLatest (2025): $1,466 · +19.4% YoY. Source: county tax records.
Cash-flow waterfall
monthlySold comps — $/sqft
last 12 mo · ≤1 miLoading sold comps…