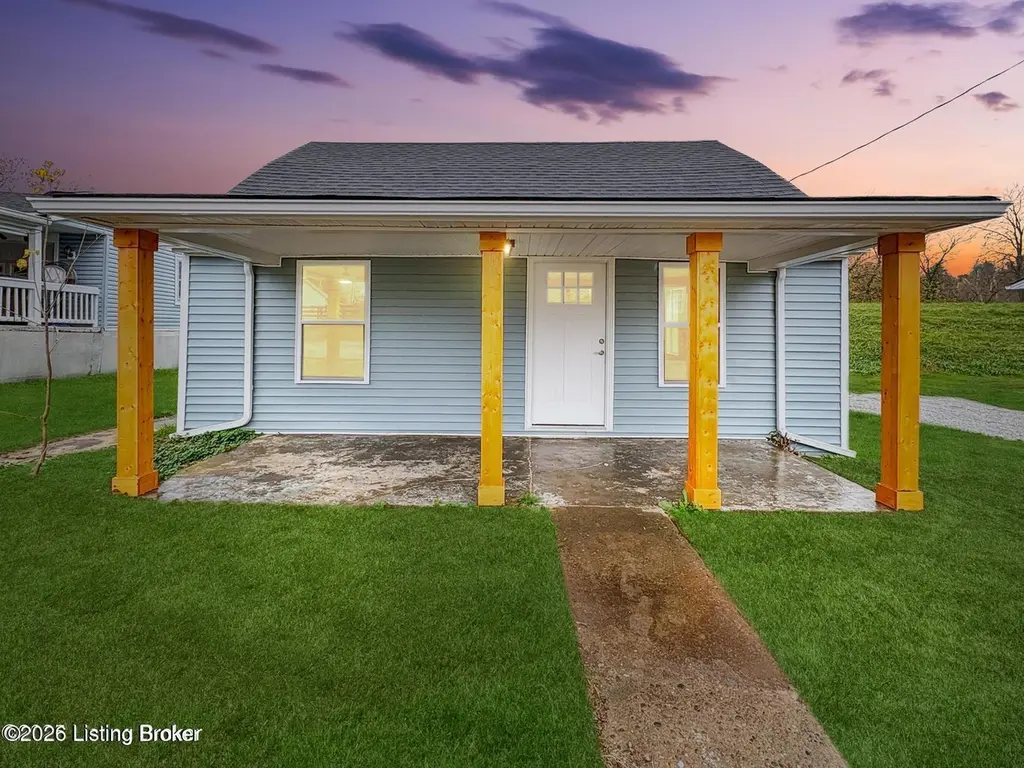
110 Hardin Ct · Taylorsville, KY
Flood risk 1/10 · Minimal
- FEMA flood zone
- X (shaded)
- Chance of flooding over 30 yrs
- 0.0%
- Est. flood insurance / yr
- $507 – $1,088
Fire risk 2/10 · Minimal
- Est. fire insurance / yr
- $839 – $1,559
Heat risk 5/10 · Moderate
- Hot days now (above 104°F)
- 7 days/yr
- Hot days in 30 yrs
- 19 days/yr
Wind risk 2/10 · Minimal
- Chance of severe wind over 30 yrs
- 2.0%
Air-quality risk 2/10 · Minimal
- Unhealthy air days now
- 1 days/yr
- Unhealthy air days in 30 yrs
- 2 days/yr
Risk factors via First Street. Map © Google.
Why this score? — see what drove the C+ grade
The composite is a weighted blend of 9 inputs, each scored 0–100. Each bar is that input's sub-score; the figure is the points it added to the 100-point composite (weight × sub-score).
- Cash flow +26.3/30.0
- DSCR +9.0/10.0
- ARV discount +8.8/15.0
- 1% rule +6.0/10.0
- Schools +3.9/10.0
- Livability +3.6/5.0
- Rent growth +2.5/5.0
- Condition / age +2.5/5.0
- Appreciation +0.0/10.0
$197,500
🖨 Deal sheet 📄 Offer letter ✓ Due diligence
Listing remarks
Welcome home! This beautifully remodeled 3-bedroom, 1-bath gem is nestled in the heart of the highly sought-after Taylorsville School District — just minutes from the Marina! Why rent when you can own and start building equity of your own? Fresh neutral paint and modern updates throughout make this home truly move-in ready. Every inch has been thoughtfully upgraded with all-new windows, doors, plumbing, flooring (including subfloor & joists), siding, gutters & fascia, cabinets, counters, light fixtures, and ceiling fans. Updated systems, timeless finishes, and a prime location — this one checks every box. Priced below previously appraised value, this is an opportunit
Key facts
- Remodeled
- All-new doors
- All-new flooring
Tags
Property features AI
Finance
- HOA & community: No association fee
Exterior
- Parking: Driveway
- Utilities: Electricity connected; Natural gas available; Propane available
- Home design: Single-family residence, Bungalow style; 2 stories; Built in 1960; Crawl space foundation; Shingle roof; Vinyl siding exterior
- Construction: Built in 1960; Vinyl siding construction; Shingle roof; Crawl space foundation
- Exterior features: No fencing; Easement
Interior
- Kitchen: Kitchen on the first floor; Dining area on the first floor
- Bedrooms: 3 bedrooms, all on the first floor
- Bathrooms: 1 full bathroom on the first floor
- Heating & cooling: Forced air heating (natural gas and propane); 1 HVAC unit; Central air cooling; 1 cooling unit
- Interior features: 8 total rooms; 3 closets; No basement; Easement on the lot
- Laundry & utility: Laundry room on the first floor; First-floor laundry
Neighborhood map
What this means for you Summary
Snapshot
- This is a 3-bed/1.0-bath other listed at $198k.
Deal economics
- At list price, monthly cash flow is $513 ($6k/yr) — positive.
- The deal already cash-flows at list — no discount required.
- Meets the 1% rule at list price ($2k rent vs $198k).
- Cap rate 9.4% vs local median 4.0% in Taylorsville — top-decile yield for the area; either an underpriced asset or a hidden risk that comps aren't pricing in. Stress-test before assuming the spread holds.
Location & tenants
- Location reads 71/100 on livability (#149 in KY) — a middle-class / working-renter tenant base. Strengths: cost of living A+, housing A+, crime B; Watch: amenities F, commute F, employment F.
- Spencer County (rural): math 41% / reading 46% proficiency, ranked #18 of 165 in KY (top 11%) — families likely to look elsewhere, expect single-tenant / working-renter base with shorter leases.
- Market conditions: 114 active listings in the ZIP; 126 units permitted in Spencer County in 2024 (0 in 5+ unit buildings).
Forward outlook
- Local home prices are declining (-3.0%/yr); year-one equity from $1k of loan paydown is wiped out by about $6k of value loss. Plan a longer hold.
- Spencer County population projected at +17% by 2050 — long-run rental-demand tailwind backs the buy-and-hold thesis.
- At projected returns (-3.0% appreciation + 3.0% rent growth), your $55k cash investment doubles in ~10 years — after that, you're playing with house money.
Negotiation context
- Only 6 days on market — expect competitive offers; lowballing is unlikely to land.
- 2 sale attempts since 25y ago with the ask held roughly flat each time — persistent listings suggest the price (not the market) is what's stuck; bring a comps-based counter.
Risks & watch-outs
- Climate carrying-cost: extreme-heat days projected 7→19/yr by 2055 (HVAC capex compounding) — expect insurance premiums to compound above CPI over the hold.
Questions for the listing agent
- Built in 1960 — when were the roof, HVAC, electrical panel, plumbing, and water heater last replaced?
- Is there a deadline driving the sale (1031 exchange, divorce, estate, relocation)? That informs how much negotiation room exists.
- What's the average days-on-market for RENTAL listings here right now (not sales)? A rising rental-DOM trend means longer vacancies and softer asking-rent achievability than the comps imply.
- What's the recent tenant-quality profile in this submarket — average credit score on applications, eviction rate, late-payment / NSF rate, and stable-employment percentage? A property-management company in the area should have these aggregated.
- How much new for-sale + rental construction is in the pipeline within 1–3 miles? Heavy new supply typically softens prices + rents 12–24 months out; constrained supply supports both.
Investment metrics
- 1% rule
- 1.10% ✓
- Cap rate
- 9.41%
- Cash-on-cash
- 11.13%
- DSCR
- 1.50
- GRM
- 7.6
CMA / ARV
- ARV (median comp)
- $203,398
- List price
- $197,500
- Delta
- -2.90%
- Verdict
- FAIR
- Comps
- 20 within 1.0 mi
Projected returns pro-forma
-3.0% appreciation · 3.0% rent growth · sell at horizon
- IRR
- 0.3%
- Equity multiple
- 1.01×
- Total profit
- $595
- Equity at exit
- $29,448
- IRR
- 9.9%
- Equity multiple
- 1.76×
- Total profit
- $42,300
- Equity at exit
- $17,076
Cash invested: $55,300 (down + closing). Projections, not guarantees.
Landlord ↔ Tenant lean methodology
- Overall (STATE)
- 83 Strongly Landlord-Friendly
- State Kentucky
- 83 Strongly Landlord-Friendly · R+16
- County
- — inherits STATE
- City
- — inherits STATE
ZIP-level market 40071
- Home prices YoY
- -13.4%
- Active inventory
- 114
- Price-to-rent
- 7.6×
Monthly cashflow live
- Estimated rent
- $2,167 medium interval (Pro) →
- Mortgage (P&I)
- −$1,036
- Tax from tax record
- −$81 /mo · $969/yr
- Insurance
- −$82
- HOA
- −$0
- Vacancy / Maint / Mgmt
- −$455
- Net cashflow
- $513
Break-even live
UW: 25.0% down · 7.5% · 30yr · 1.5% tax · 5.0% vac · 8.0% maint · 8.0% mgmt
Financing live
Cash to close
- Down payment
- $49,375
- Closing costs
- $5,925
- Reserves months
- —
- Total cash needed
- —
Loan-product check · same deal, 3 products live
Conventional
25% down · 7.5% · 30yr
- Down + closing
- —
- Monthly P&I
- —
- Monthly cashflow
- —
- DSCR
- —
- Eligible?
- —
Personal DTI + credit; lowest rate.
DSCR
20% down · 8.5% · 30yr
- Down + closing
- —
- Monthly P&I
- —
- Monthly cashflow
- —
- DSCR
- —
- Eligible?
- —
No personal income docs; deal must DSCR.
Hard money
10% down · 12.0% · 12mo
- Down + closing
- —
- Monthly P&I
- —
- Monthly cashflow
- —
- DSCR
- —
- Eligible?
- —
Short-term bridge; refi at stabilization.
Listing history 9 events
-
2026-05-18status Pending 720-char remark
-
2026-05-11$197,500 Active 720-char remark
-
2025-12-22price $182,500
-
2025-12-16price $197,900
-
2025-11-17price $215,000
-
2025-07-15soldstatus $425,000
-
2001-07-18historical
-
2001-01-22$68,500
-
1998-10-01soldstatus $44,000
ⓘ Source: listings_history table (triggers on properties + properties_extension) + one-shot
backfill from property_details.listing_events for pre-trigger history.
Tax reassessment forecast KY · Resets to sale price
- Current annual tax
- $969 · $81/mo
- Projected year-2 tax
- $1,698 · $142/mo
- Expected delta
- +$730/yr (+$61/mo · 75.4%)
ⓘ Screening estimate from a state-policy table — verify with the county assessor before closing.
Climate risk First Street
- Flood 1/10 Low FEMA zone X (shaded) · 0% chance over 30 yrs
- Wildfire 2/10 Low
- Heat 5/10 Major 7 d/yr ≥104°F today · 19 d/yr by 30 yrs out
- Wind 2/10 Low 2% chance of damaging wind over 30 yrs
- Air quality 2/10 Low 1 unhealthy d/yr today · 2 by 30 yrs out
Nearby sold comps map
Loading sold comps map…
Walkable amenities ~0.75 mi
Loading nearby amenities…
Taxation est. · year 1
- Rental income
- $25,999
- − Mortgage interest
- −$11,063
- − Property taxes
- −$969
- − Insurance
- −$988
- − Repairs & maintenance
- −$2,080
- − Management
- −$2,080
- − Depreciation
- −$5,745
- Taxable income
- $3,075
- Est. tax owed @ 24.0%
- −$738
- After-tax cash flow
- $5,417/yr
For passive investors: Depreciation is non-cash, so a rental often shows a tax loss while cash-flowing — sheltering income. Rental losses are passive: they offset passive income freely, and up to $25,000/yr can offset ordinary (W-2) income if you actively participate and your MAGI is under $100k (phasing out to $0 by $150k); unused losses carry forward. On sale, claimed depreciation is recaptured at up to 25%, and gains may owe capital-gains tax (a 1031 exchange can defer both). Figures are a year-1 estimate at your 24.0% rate — not tax advice; consult a CPA.
Schools (NCES district)
- District
- Spencer County
- NCES district ID
- 2105490
- Math proficiency
- 41% ▼ -14.00%
- Reading proficiency
- 46% ▼ -19.00%
- Median HH income
- $64,167
- Composite
- 38.74/100
- National rank
- #4125
- State rank
- #18 of 165 in KY
Livability — Taylorsville
- Score
- 71/100
- State rank
- #149
- US rank
- #7189
Category grades
Schools grade is shown separately in the Schools card above.
Census & demographics
- Census place
- Taylorsville, KY
- Population (ZIP)
- 16,702
Population outlook (Spencer County) Hauer SSP2
- Today (2025)
- 20,077 people
- By 2030
- 21,008 · +4.6%
- By 2040
- 22,560 · +12.4%
- By 2050
- 23,480 · +16.9%
- By 2075
- 25,222 · +25.6%
- By 2100
- 25,550 · +27.3%
Race, ethnicity, and origin ACS 2023
- Neighborhood character
- Predominantly White (93%)
- Race & ethnicity
- White 93% Two or more races 4% Hispanic / Latino 2% Black 1%
- Common ancestry
- Italian 4% Slovak 2% Lithuanian 1%
- Foreign-born
- 1%
- Languages at home
- 99% English-only · Spanish 1%
Political lean MEDSL · Spencer
- 2024 margin
- Solid R (+56.7) · D 21.0% · R 77.8% · Other 1.2%
- 2008→2024 swing
- -21.2pp toward R · 2008: -35.5pp · 2024: -56.7pp
- All cycles
- 2024: R+56.7 2020: R+54.3 2016: R+55.5 2012: R+37.7 2008: R+35.5
Not yet ingested
- Civics
- —
Market trends
- HPI YoY
- ▼ -42.62%
- Current HPI
- 274.9283
- Rent YoY
- —
- Metro
- —
- State GDP YoY
- ▲ 1.81%
- F500 in state
- 4
Industry mix (Fortune 500 HQ in KY)
| Industry | F500 HQs | Revenue |
|---|---|---|
| Healthcare | 1 | $118B |
|
||
| Food / Beverage | 1 | $7B |
|
||
Price history
+348.9% since first listed9 events — show timeline
- 2026-05-18 Pending — Metro Search MLS
- 2026-05-11 Listed $197,500 Metro Search MLS
- 2025-12-22 Price Changed $182,500 Metro Search MLS
- 2025-12-16 Price Changed $197,900 Metro Search MLS
- 2025-11-17 Price Changed $215,000 Metro Search MLS
- 2025-07-15 Sold (Public Records) $425,000 Public Records
- 2001-07-18 Listing Removed — Metro Search MLS
- 2001-01-22 Listed $68,500 Metro Search MLS
- 1998-10-01 Sold (Public Records) $44,000 Public Records
Property tax history
+12.4%/yrLatest (2025): $969 · +253.2% YoY. Source: county tax records.
Cash-flow waterfall
monthlySold comps — $/sqft
last 12 mo · ≤1 miLoading sold comps…