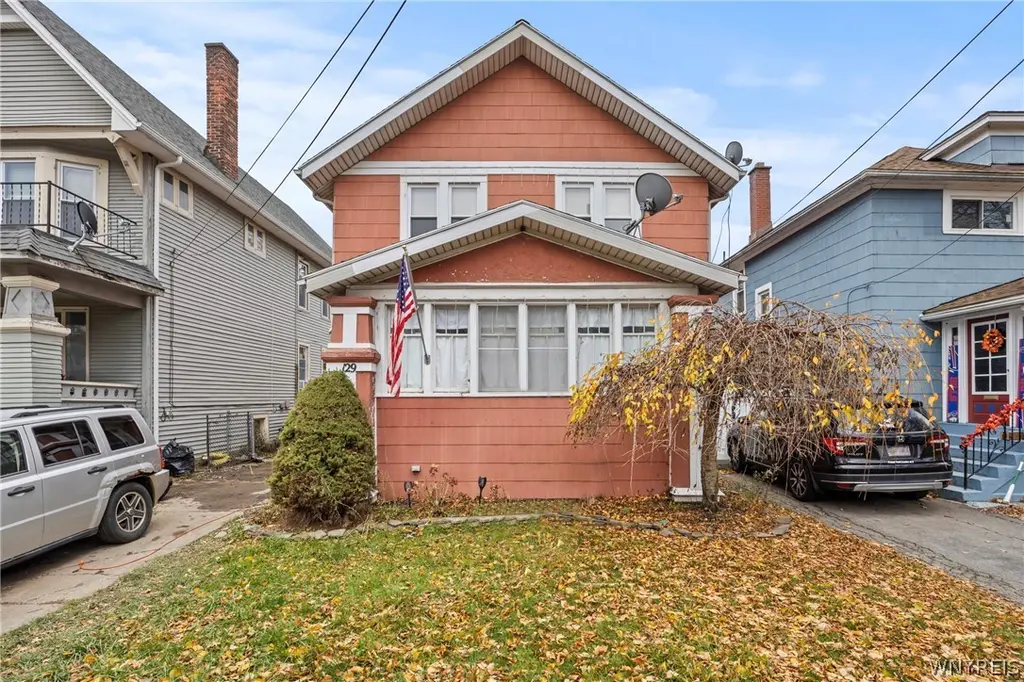
129 Armin Pl · Buffalo, NY
Flood risk 6/10 · Moderate
- FEMA flood zone
- X (unshaded)
- Chance of flooding over 30 yrs
- 0.75%
- Est. flood insurance / yr
- $473 – $860
Fire risk 2/10 · Minimal
- Est. fire insurance / yr
- $691 – $1,283
Heat risk 3/10 · Minor
- Hot days now (above 92°F)
- 7 days/yr
- Hot days in 30 yrs
- 15 days/yr
Wind risk 1/10 · Minimal
- Chance of severe wind over 30 yrs
- —
Air-quality risk 3/10 · Minor
- Unhealthy air days now
- 2 days/yr
- Unhealthy air days in 30 yrs
- 3 days/yr
Risk factors via First Street. Map © Google.
Why this score? — see what drove the B- grade
The composite is a weighted blend of 9 inputs, each scored 0–100. Each bar is that input's sub-score; the figure is the points it added to the 100-point composite (weight × sub-score).
- Cash flow +19.7/30.0
- ARV discount +15.0/15.0
- Appreciation +10.0/10.0
- DSCR +6.2/10.0
- Rent growth +5.0/5.0
- 1% rule +3.9/10.0
- Livability +3.9/5.0
- Schools +3.3/10.0
- Condition / age +2.5/5.0
$156,000
🖨 Deal sheet 📄 Offer letter ✓ Due diligence
Listing remarks
Welcome to 129 Armin Pl, a well-maintained 3 bed, 1 bath single-family home in South Buffalo offering 1,248 sq ft of living space with a bright living and dining area, an efficient kitchen, full basement for storage, and a fenced yard with a detached garage and patio. This charming home is ideal for both owner-occupants and investors, combining classic character with practical updates and a solid rental profile. Conveniently located near South Buffalo amenities—including South Park, local dining along South Park Ave, neighborhood shops, and easy commuter routes—and just minutes from the vibrant Kaisertown corridor with its Clinton Street restaurants, markets, and community pubs.
Key facts
- New furnace
- Fenced yard
- Full basement
Tags
Neighborhood map
What this means for you Summary
Snapshot
- This is a 3-bed/1.0-bath single-family listed at $156k.
Deal economics
- At list price, monthly cash flow is $183 ($2k/yr) — positive.
- The deal already cash-flows at list — no discount required.
- To meet the 1% rule (rent ≥ 1% of price), the offer needs to be $139k (10.7% below list).
- Recommended offer: $139k (10.7% below list) — sets the bar for 1% rule.
Location & tenants
- Location reads 77/100 on livability (#195 in NY, #3,011 nationally) — a middle-class / working-renter tenant base. Strengths: commute A+, housing A+, health & safety A+; Watch: crime F, employment D-.
- Buffalo City School District (urban): math 41% / reading 40% proficiency, ranked #535 of 590 in NY (top 91%) — families likely to look elsewhere, expect single-tenant / working-renter base with shorter leases; 75% free/reduced lunch — lower-income household profile, screen leases tightly.
- Market conditions: Rents rising fast (+12.7%/yr); 94 active listings in the ZIP; 16 comparable units currently listed for rent nearby; rentals at typical pace (median 16d on market — plan ~3-4 weeks tenant-placement turnaround); 1,244 units permitted in Erie County in 2024 (563 in 5+ unit buildings).
- This rent runs 31% of the median local income ($54k/yr) — at the standard rent-burdened threshold; future hikes will face affordability resistance.
Forward outlook
- In year one you build about $17k of equity ($1k loan paydown + $16k appreciation (10.0% local appreciation)).
- At projected returns (10.0% appreciation + 8.0% rent growth), your $44k cash investment doubles in ~3 years — after that, you're playing with house money.
- By year 3, paydown + projected appreciation supports a ~$42k cash-out refi (75% LTV) — recoverable capital for the next deal without selling this one.
Negotiation context
- Only 14 days on market — expect competitive offers; lowballing is unlikely to land.
- 9 sale attempts since 14y ago; this cycle's ask has dropped $9k (5%) from the opening price — seller is motivated, your offer sets the floor, not the list.
- Current owner paid $85k; list at $156k implies a 84% gain — meaningful room to come down on a strong offer.
Risks & watch-outs
- Watch-outs: built in 1920 — expect roof / HVAC / electrical / plumbing capex.
- Climate carrying-cost: major flood risk — expect insurance premiums to compound above CPI over the hold.
Questions for the listing agent
- Built in 1920 — when were the roof, HVAC, electrical panel, plumbing, and water heater last replaced?
- Is there a deadline driving the sale (1031 exchange, divorce, estate, relocation)? That informs how much negotiation room exists.
- Crime grade is F in this area — have there been break-ins, vandalism, or insurance claims at this property in the last 3 years? What carrier currently insures it and at what premium?
- What's the average days-on-market for RENTAL listings here right now (not sales)? A rising rental-DOM trend means longer vacancies and softer asking-rent achievability than the comps imply.
- What's the recent tenant-quality profile in this submarket — average credit score on applications, eviction rate, late-payment / NSF rate, and stable-employment percentage? A property-management company in the area should have these aggregated.
- How much new for-sale + rental construction is in the pipeline within 1–3 miles? Heavy new supply typically softens prices + rents 12–24 months out; constrained supply supports both.
Investment metrics
- 1% rule
- 0.89% ✗
- Cap rate
- 7.70%
- Cash-on-cash
- 5.04%
- DSCR
- 1.22
- GRM
- 9.3
CMA / ARV
- ARV (on-the-fly)
- $189,696
- Comps found
- 12
Show comp detail 12 sales within ~0.75 mi
| Address | Dist | Beds/Ba | Sqft | Sold | Price | $/sf | Match |
|---|---|---|---|---|---|---|---|
| 102 Pomona Pl | 0.10mi | 4/1.0 (+1) | 1,232 (-1%) | 2mo | $81,000 | $66 | 86 |
| 91 Armin Pl | 0.07mi | 3/1.0 | 1,330 (+7%) | 0mo | $175,000 | $132 | 85 |
| 105 Armin Pl | 0.05mi | 3/1.5 | 1,352 (+8%) | 6mo | $170,000 | $126 | 77 |
| 59 Hammerschmidt Ave | 0.38mi | 3/1.0 | 1,405 (+13%) | 1mo | $232,500 | $165 | 60 |
| 89 Roberts Ave | 0.61mi | 3/1.0 | 1,338 (+7%) | 4mo | $106,500 | $80 | 57 |
| 93 Salem St | 0.74mi | 3/1.5 | 1,184 (-5%) | 1mo | $235,000 | $198 | 54 |
| 287 Willett St | 0.70mi | 3/1.0 | 1,342 (+8%) | 3mo | $192,000 | $143 | 52 |
| 45 Unger Ave | 0.48mi | 3/1.0 | 1,072 (-14%) | 3mo | $223,600 | $209 | 52 |
| 330 Cumberland Ave | 0.70mi | 3/1.5 | 1,321 (+6%) | 6mo | $217,000 | $164 | 51 |
| 40 Remington Pl | 0.51mi | 3/1.0 | 1,413 (+13%) | 6mo | $215,000 | $152 | 50 |
| 287 Fenton St | 0.66mi | 4/1.0 (+1) | 1,170 (-6%) | 6mo | $235,000 | $201 | 48 |
| 143 Weiss St | 0.62mi | 3/1.0 | 1,410 (+13%) | 3mo | $106,000 | $75 | 47 |
Match score weights: distance 35% · size 25% · config 20% · recency 20%. Top-matched comps best support the ARV.
Projected returns pro-forma
10.0% appreciation · 8.0% rent growth · sell at horizon
- IRR
- 29.7%
- Equity multiple
- 3.38×
- Total profit
- $103,933
- Equity at exit
- $140,537
- IRR
- 27.1%
- Equity multiple
- 8.21×
- Total profit
- $314,961
- Equity at exit
- $303,074
Cash invested: $43,680 (down + closing). Projections, not guarantees.
Landlord ↔ Tenant lean methodology
- Overall (STATE)
- 15 Strongly Tenant-Friendly
- State New York
- 15 Strongly Tenant-Friendly · D+10
- County
- — inherits STATE
- City
- — inherits STATE
ZIP-level market 14210
- Home prices YoY
- 13.8%
- Rents YoY
- 12.7%
- Active inventory
- 94
- Price-to-rent
- 9.3×
Monthly cashflow live
- Estimated rent
- $1,393 high interval (Pro) →
- Mortgage (P&I)
- −$818
- Tax from tax record
- −$34 /mo · $409/yr
- Insurance
- −$65
- HOA
- −$0
- Vacancy / Maint / Mgmt
- −$293
- Net cashflow
- $183
Break-even live
UW: 25.0% down · 7.5% · 30yr · 1.5% tax · 5.0% vac · 8.0% maint · 8.0% mgmt
Financing live
Cash to close
- Down payment
- $39,000
- Closing costs
- $4,680
- Reserves months
- —
- Total cash needed
- —
Loan-product check · same deal, 3 products live
Conventional
25% down · 7.5% · 30yr
- Down + closing
- —
- Monthly P&I
- —
- Monthly cashflow
- —
- DSCR
- —
- Eligible?
- —
Personal DTI + credit; lowest rate.
DSCR
20% down · 8.5% · 30yr
- Down + closing
- —
- Monthly P&I
- —
- Monthly cashflow
- —
- DSCR
- —
- Eligible?
- —
No personal income docs; deal must DSCR.
Hard money
10% down · 12.0% · 12mo
- Down + closing
- —
- Monthly P&I
- —
- Monthly cashflow
- —
- DSCR
- —
- Eligible?
- —
Short-term bridge; refi at stabilization.
Rent comps 16 comps
| Address | Beds | Baths | Sqft | Rent | $/sqft | DOM | Units | Dist |
|---|---|---|---|---|---|---|---|---|
| 34 Hayden St Unit Back Buffalo, NY | 3.0 | 1.0 | 1200 | $1,600 | $1.33 | 44d | 1 | 0.27mi |
| 1899 Seneca St Buffalo, NY | 3.0 | 1.0 | 1134 | $1,075 | $0.95 | 14d | 1 | 0.27mi |
| 1927 Seneca St Buffalo, NY | 3.0 | 1.0 | 1196 | $1,250 | $1.05 | 24d | 1 | 0.29mi |
| 76 Hammerschmidt Ave Buffalo, NY | 3.0 | 1.0 | 1200 | $1,275 | $1.06 | 2d | 1 | 0.36mi |
| 2111 Seneca St #3 Buffalo, NY | 2.0 | 1.0 | 937 | $1,150 | $1.23 | 44d | 1 | 0.52mi |
| 61 Princeton Pl Buffalo, NY | 2.0 | 1.0 | 820 | $1,300 | $1.59 | 3d | 1 | 0.57mi |
| 298 Cumberland Ave Buffalo, NY | 3.0 | 1.5 | 1208 | $2,200 | $1.82 | 2d | 1 | 0.67mi |
| 23 Indian Orchard Pl Unit Lower Buffalo, NY | 3.0 | 1.0 | 1200 | $1,250 | $1.04 | 44d | 1 | 0.67mi |
| 214 Abbott Rd Unit 2 Buffalo, NY | 2.0 | 1.0 | 945 | $1,200 | $1.27 | 14d | 1 | 0.70mi |
| 89 Macamley St #2 Buffalo, NY | 3.0 | 1.0 | 1274 | $1,100 | $0.86 | 10d | 1 | 0.98mi |
| 47 Lester St Unit Main Floor Buffalo, NY | 3.0 | 1.0 | 900 | $1,000 | $1.11 | 44d | 1 | 1.02mi |
| 102 Wildwood Pl Unit 1 Buffalo, NY | 3.0 | 1.0 | 1100 | $1,250 | $1.14 | 16d | 1 | 1.13mi |
| 700 Hopkins St Buffalo, NY | 3.0 | 1.0 | 1100 | $1,225 | $1.11 | 14d | 1 | 1.15mi |
| 696 Hopkins St Unit 2 Buffalo, NY | 2.0 | 1.0 | 750 | $950 | $1.27 | 44d | 1 | 1.16mi |
| 46 Kirkwood Dr Unit Lower West Seneca, NY | 2.0 | 1.0 | 1064 | $1,350 | $1.27 | 16d | 1 | 1.31mi |
| 74 Woodside Ave Unit 1 Buffalo, NY | 3.0 | 1.0 | 1250 | $1,510 | $1.21 | 2d | 1 | 1.45mi |
Listing history 30 events
-
2026-04-19status Pending
-
2026-04-13status Active
-
2026-04-13price $156,000
-
2026-04-09status Pending
-
2026-04-01$164,900 Active
-
2026-04-01historical
-
2026-01-19$164,900 Active
-
2026-01-19historical
-
2025-12-18price $164,900
-
2025-11-18$169,900 Active
-
2019-11-27soldstatus $85,000 Closed Sale or Rented
-
2019-11-27soldstatus $85,000
-
2019-10-29status Pending Sale
-
2019-09-12status Under Contract- Do Not Show
-
2019-08-30historical Continue to Show- Under Contract
-
2019-08-22status Active
-
2019-08-20status Under Contract- Do Not Show
-
2019-08-14$92,900 Active
-
2016-10-27soldstatus $70,000 Closed Sale or Rented
-
2016-10-27soldstatus $70,000
-
2016-08-30status Pending Sale
-
2016-08-12price $77,000
-
2016-08-11price $78,900
-
2016-07-13status Active
-
2016-05-19status Pending Sale
-
2016-03-29$80,000 Active
-
2012-10-26soldstatus $59,000
-
2012-10-22soldstatus $59,000
-
2012-09-07$62,500
-
2008-10-15soldstatus $47,700
ⓘ Source: listings_history table (triggers on properties + properties_extension) + one-shot
backfill from property_details.listing_events for pre-trigger history.
Tax reassessment forecast NY · Partial reset (capped growth)
- Current annual tax
- $409 · $34/mo
- Projected year-2 tax
- $1,523 · $127/mo
- Expected delta
- +$1,114/yr (+$93/mo · 272.2%)
ⓘ Screening estimate from a state-policy table — verify with the county assessor before closing.
Climate risk First Street
- Flood 6/10 Major FEMA zone X (unshaded) · 75% chance over 30 yrs
- Wildfire 2/10 Low
- Heat 3/10 Moderate 7 d/yr ≥92°F today · 15 d/yr by 30 yrs out
- Wind 1/10 Low
- Air quality 3/10 Moderate 2 unhealthy d/yr today · 3 by 30 yrs out
Nearby sold comps map
Loading sold comps map…
Walkable amenities ~0.75 mi
Loading nearby amenities…
Taxation est. · year 1
- Rental income
- $16,719
- − Mortgage interest
- −$8,738
- − Property taxes
- −$409
- − Insurance
- −$780
- − Repairs & maintenance
- −$1,338
- − Management
- −$1,338
- − Depreciation
- −$4,538
- Taxable loss
- −$422
- Est. tax savings @ 24.0%
- +$101
- After-tax cash flow
- $2,303/yr
For passive investors: Depreciation is non-cash, so a rental often shows a tax loss while cash-flowing — sheltering income. Rental losses are passive: they offset passive income freely, and up to $25,000/yr can offset ordinary (W-2) income if you actively participate and your MAGI is under $100k (phasing out to $0 by $150k); unused losses carry forward. On sale, claimed depreciation is recaptured at up to 25%, and gains may owe capital-gains tax (a 1031 exchange can defer both). Figures are a year-1 estimate at your 24.0% rate — not tax advice; consult a CPA.
Schools (NCES district)
- District
- Buffalo City School District
- NCES district ID
- 3605850
- Math proficiency
- 41% ▲ 11.00%
- Reading proficiency
- 40% ▲ 7.00%
- Median HH income
- $31,665
- Composite
- 33.17/100
- National rank
- #5544
- State rank
- #535 of 590 in NY
Livability — Buffalo
- Score
- 77/100
- State rank
- #195
- US rank
- #3011
Category grades
Schools grade is shown separately in the Schools card above.
Census & demographics
- Census place
- Buffalo, NY
- County
- Erie County · 714,559 people
- City population
- 440,021
- Metro
- Buffalo-Cheektowaga, NY
- Population (ZIP)
- 15,563
- Household income
- $54,197
- Rent vs Own
- Severe rent burden
- 959.0
Population outlook (Erie County) Hauer SSP2
- Today (2025)
- 933,037 people
- By 2030
- 935,181 · +0.2%
- By 2040
- 928,531 · -0.5%
- By 2050
- 905,725 · -2.9%
- By 2075
- 834,037 · -10.6%
- By 2100
- 708,033 · -24.1%
Race, ethnicity, and origin ACS 2023
- Neighborhood character
- Predominantly White (79%)
- Race & ethnicity
- White 79% Two or more races 8% Black 8% Hispanic / Latino 7% Asian 1%
- Hispanic origin (detail)
- Puerto Rican 6%
- Common ancestry
- Romanian 21% Lithuanian 2% Serbian 1%
- Foreign-born
- 2% · Canada, China
- Languages at home
- 95% English-only · Spanish 2% Arabic 1% Other Indo-European 1%
Political lean MEDSL · Erie
- 2024 margin
- Lean D (+9.7) · D 54.8% · R 45.2%
- 2008→2024 swing
- -7.9pp toward R · 2008: 17.5pp · 2024: 9.7pp
- All cycles
- 2024: D+9.7 2020: D+14.7 2016: D+4.8 2012: D+15.6 2008: D+17.5
Not yet ingested
- Civics
- —
Market trends
- HPI YoY
- ▲ 52.34%
- Current HPI
- 431.7951
- Rent YoY
- ▲ 12.67%
- Metro
- Buffalo-Cheektowaga, NY
- State GDP YoY
- ▲ 2.60%
- F500 in state
- 92
Industry mix (Fortune 500 HQ in NY)
| Industry | F500 HQs | Revenue |
|---|---|---|
| Financial Services | 10 | $950B |
|
||
| Consumer Goods | 9 | $162B |
|
||
| Insurance | 4 | $225B |
|
||
| Telecommunications | 2 | $144B |
|
||
| Pharmaceuticals | 2 | $112B |
|
||
| Media / Entertainment | 2 | $69B |
|
||
Price history
+227.0% since first listed30 events — show timeline
- 2026-04-19 Pending — WNYREIS
- 2026-04-13 Relisted — WNYREIS
- 2026-04-13 Price Changed $156,000 WNYREIS
- 2026-04-09 Pending — WNYREIS
- 2026-04-01 Listing Removed — WNYREIS
- 2026-04-01 Listed $164,900 WNYREIS
- 2026-01-19 Listing Removed — WNYREIS
- 2026-01-19 Listed $164,900 WNYREIS
- 2025-12-18 Price Changed $164,900 WNYREIS
- 2025-11-18 Listed $169,900 WNYREIS
- 2019-11-27 Sold (Public Records) $85,000 Public Records
- 2019-11-27 Sold (MLS) $85,000 WNYREIS
- 2019-10-29 Pending — WNYREIS
- 2019-09-12 Pending — WNYREIS
- 2019-08-30 Contingent — WNYREIS
- 2019-08-22 Relisted — WNYREIS
- 2019-08-20 Pending — WNYREIS
- 2019-08-14 Listed $92,900 WNYREIS
- 2016-10-27 Sold (Public Records) $70,000 Public Records
- 2016-10-27 Sold (MLS) $70,000 WNYREIS
- 2016-08-30 Pending — WNYREIS
- 2016-08-12 Price Changed $77,000 WNYREIS
- 2016-08-11 Price Changed $78,900 WNYREIS
- 2016-07-13 Relisted — WNYREIS
- 2016-05-19 Pending — WNYREIS
- 2016-03-29 Listed $80,000 WNYREIS
- 2012-10-26 Sold (Public Records) $59,000 Public Records
- 2012-10-22 Sold (MLS) $59,000 WNYREIS
- 2012-09-07 Listed $62,500 WNYREIS
- 2008-10-15 Sold (Public Records) $47,700 Public Records
Property tax history
+3.4%/yrLatest (2025): $409 · +0.0% YoY. Source: county tax records.
Cash-flow waterfall
monthlySold comps — $/sqft
last 12 mo · ≤1 miLoading sold comps…