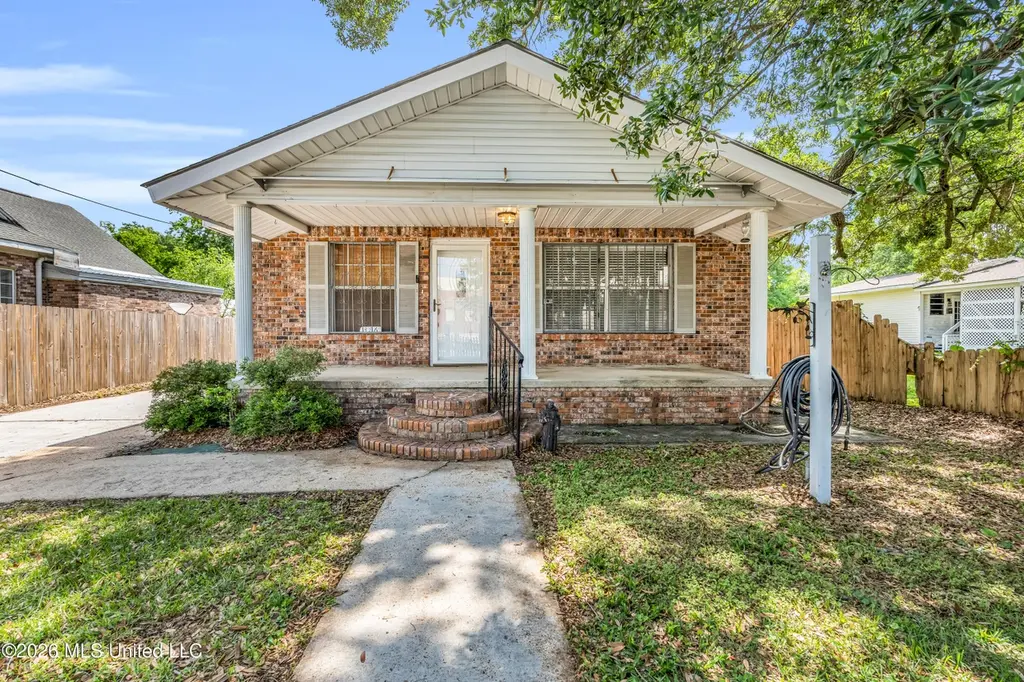
386 Lameuse St · Biloxi, MS
Flood risk 8/10 · Major
- FEMA flood zone
- AE
- Chance of flooding over 30 yrs
- 0.95%
- Est. flood insurance / yr
- $1,737 – $8,500
Fire risk 1/10 · Minimal
- Est. fire insurance / yr
- $1,241 – $2,305
Heat risk 10/10 · Severe
- Hot days now (above 106°F)
- 7 days/yr
- Hot days in 30 yrs
- 22 days/yr
Wind risk 9/10 · Severe
- Chance of severe wind over 30 yrs
- 99.0%
Air-quality risk 2/10 · Minimal
- Unhealthy air days now
- 1 days/yr
- Unhealthy air days in 30 yrs
- 2 days/yr
Risk factors via First Street. Map © Google.
Why this score? — see what drove the C grade
The composite is a weighted blend of 9 inputs, each scored 0–100. Each bar is that input's sub-score; the figure is the points it added to the 100-point composite (weight × sub-score).
- Cash flow +21.1/30.0
- ARV discount +11.4/15.0
- DSCR +6.7/10.0
- 1% rule +5.6/10.0
- Schools +4.5/10.0
- Livability +4.0/5.0
- Rent growth +2.5/5.0
- Condition / age +2.5/5.0
- Appreciation +0.0/10.0
$189,900
🖨 Deal sheet 📄 Offer letter ✓ Due diligence
Listing remarks
Nestled in the heart of Old Biloxi, just moments from the back bay, this well-built brick home is full of character, space, and opportunity. Loved by the same family for generations, this 4-bedroom, 3-bath home offers a warm, welcoming feel with room to make it your own. From the moment you arrive, the charming white picket fence and inviting front porch set the tone for this classic property, full of timeless appeal. Inside, you'll find a generously sized kitchen with a dedicated dining area—perfect for gathering. Even better, the sellers are including a beautiful solid wood dining table that comfortably seats 10-12, making it ideal for hosting holidays and special occasions from day
Key facts
- Inviting front porch
- Full bath
- Spacious addition
Tags
Property features AI
Finance
- HOA & community: Near entertainment
Exterior
- Parking: Driveway; Paved parking; Parking for 3 vehicles
- Security: Window bars
- Utilities: Public water; Public sewer; Cable available; Natural gas connected
- Home design: Single-family house; Two levels; Move-in ready
- Construction: Brick construction; Chainwall foundation; Asphalt shingle roof; Built in public-records year
- Exterior features: Front porch; Side porch; Private yard; Front yard fencing; See remarks
Interior
- Kitchen: Cooktop; Gas cooktop
- Flooring: Carpet; Wood
- Bathrooms: 3 full bathrooms
- Heating & cooling: Central heating (natural gas); Central air; Ceiling fans for cooling
- Interior features: Ceiling fans; Eat-in kitchen; Laminate counters; Breakfast bar; Blinds; Storm doors
- Laundry & utility: Indoor laundry
Neighborhood map
What this means for you Summary
Snapshot
- This is a 4-bed/1.0-bath single-family listed at $190k.
Deal economics
- At list price, monthly cash flow is $-154 ($-2k/yr) — negative.
- To cash-flow at today's rent, offer at most $168k (11.7% below list).
- Meets the 1% rule at list price ($2k rent vs $190k).
- Recommended offer: $168k (11.7% below list) — sets the bar for cash-flow.
- Cap rate 8.0% vs local median 3.5% in Biloxi — top-decile yield for the area; either an underpriced asset or a hidden risk that comps aren't pricing in. Stress-test before assuming the spread holds.
Location & tenants
- Location reads 79/100 on livability (#6 in MS, #2,141 nationally) — a middle-class / working-renter tenant base. Strengths: crime A+, cost of living A+, housing A+; Watch: commute D+, amenities F, employment D-.
- Biloxi Public School District (urban): math 60% / reading 48% proficiency, ranked #7 of 130 in MS (top 5%) — acceptable for families but not a draw, mixed tenant base, ~2y average lease.
- Zoned schools: Biloxi Junior High (math 60% / reading 43%, grade C, #27 of 179 statewide, top 16%, 881 students, 100% FRL); Biloxi High School (math 65% / reading 53%, grade C+, #7 of 197 statewide, top 3%, 1,728 students, 100% FRL) — zoned schools average 100% FRL vs 59% district-wide (40 pts higher); higher-poverty schools than district average — tighter screening recommended.
- Market conditions: 164 active listings in the ZIP; 4 comparable units currently listed for rent nearby; rentals at typical pace (median 21d on market — plan ~3-4 weeks tenant-placement turnaround); lower-income renter base — watch delinquency; 2,194 units permitted in Harrison County in 2024 (0 in 5+ unit buildings).
- At $2,006/mo this rent would consume 59% of the median local household income ($41k/yr) (locally 329% of renters already pay >50% of income on rent) — very limited rent-growth headroom before tenants either downsize or default.
Forward outlook
- Local home prices are declining (-3.0%/yr); year-one equity from $1k of loan paydown is wiped out by about $6k of value loss. Plan a longer hold.
- Harrison County population projected at +27% by 2050 — long-run rental-demand tailwind backs the buy-and-hold thesis.
Negotiation context
- It's been on market 48 days — a 3% lower offer ($184k) is reasonable based on typical stale-listing flexibility.
Risks & watch-outs
- Watch-outs: flood insurance adds $427/mo; built in 1955 — expect roof / HVAC / electrical / plumbing capex.
- Climate carrying-cost: in FEMA flood zone AE (mandatory federal flood insurance); severe wind risk, 99% chance of damaging wind over 30y; extreme-heat days projected 7→22/yr by 2055 (HVAC capex compounding) — expect insurance premiums to compound above CPI over the hold.
Questions for the listing agent
- What do current leases actually rent for vs. the listed asking? Can we see a recent rent roll and the last 12 months of T-12 income?
- It's been on market 48 days. Have you received any prior offers? Is the seller open to a 12% concession, seller financing, or rate buy-down credit?
- Built in 1955 — when were the roof, HVAC, electrical panel, plumbing, and water heater last replaced?
- What's the actual annual flood-insurance premium (NFIP or private), and is the property in a SFHA with mandatory coverage?
- Is there a deadline driving the sale (1031 exchange, divorce, estate, relocation)? That informs how much negotiation room exists.
- What's the average days-on-market for RENTAL listings here right now (not sales)? A rising rental-DOM trend means longer vacancies and softer asking-rent achievability than the comps imply.
- What's the recent tenant-quality profile in this submarket — average credit score on applications, eviction rate, late-payment / NSF rate, and stable-employment percentage? A property-management company in the area should have these aggregated.
- How much new for-sale + rental construction is in the pipeline within 1–3 miles? Heavy new supply typically softens prices + rents 12–24 months out; constrained supply supports both.
Investment metrics
- 1% rule
- 1.06% ✓
- Cap rate
- 8.02%
- Cash-on-cash
- 6.15%
- DSCR
- 1.27
- GRM
- 7.9
CMA / ARV
- ARV (median comp)
- $207,987
- List price
- $189,900
- Delta
- -8.70%
- Verdict
- FAIR
- Comps
- 20 within 1.0 mi
Show comp detail 3 sales within ~0.75 mi
| Address | Dist | Beds/Ba | Sqft | Sold | Price | $/sf | Match |
|---|---|---|---|---|---|---|---|
| 345 Bowen St | 0.58mi | 3/2.0 (-1) | 2,219 (+2%) | 14mo | $178,000 | $80 | 48 |
| 941 Diaz Ave | 0.52mi | 4/2.0 | 1,971 (-9%) | 12mo | $199,900 | $101 | 47 |
| 230 Reynoir St | 0.55mi | 3/2.5 (-1) | 1,949 (-10%) | 15mo | $235,000 | $121 | 34 |
Match score weights: distance 35% · size 25% · config 20% · recency 20%. Top-matched comps best support the ARV.
Projected returns pro-forma
-3.0% appreciation · 3.0% rent growth · sell at horizon
- IRR
- -21.9%
- Equity multiple
- 0.24×
- Total profit
- $-40,287
- Equity at exit
- $28,315
- IRR
- -15.3%
- Equity multiple
- 0.13×
- Total profit
- $-46,523
- Equity at exit
- $16,419
Cash invested: $53,172 (down + closing). Projections, not guarantees.
Landlord ↔ Tenant lean methodology
- Overall (STATE)
- 90 Strongly Landlord-Friendly
- State Mississippi
- 90 Strongly Landlord-Friendly · R+11
- County
- — inherits STATE
- City
- — inherits STATE
ZIP-level market 39530
- Active inventory
- 164
- Price-to-rent
- 7.9×
Monthly cashflow live
- Estimated rent
- $2,006 medium interval (Pro) →
- Mortgage (P&I)
- −$996
- Tax est. 1.5%
- −$237 /mo · $2,848/yr
- Insurance
- −$79
- Flood insurance flood zone
- −$427 /mo · $5,118/yr
- HOA
- −$0
- Vacancy / Maint / Mgmt
- −$421
- Net cashflow
- $-154
Break-even live
UW: 25.0% down · 7.5% · 30yr · 1.5% tax · 5.0% vac · 8.0% maint · 8.0% mgmt
Financing live
Cash to close
- Down payment
- $47,475
- Closing costs
- $5,697
- Reserves months
- —
- Total cash needed
- —
Loan-product check · same deal, 3 products live
Conventional
25% down · 7.5% · 30yr
- Down + closing
- —
- Monthly P&I
- —
- Monthly cashflow
- —
- DSCR
- —
- Eligible?
- —
Personal DTI + credit; lowest rate.
DSCR
20% down · 8.5% · 30yr
- Down + closing
- —
- Monthly P&I
- —
- Monthly cashflow
- —
- DSCR
- —
- Eligible?
- —
No personal income docs; deal must DSCR.
Hard money
10% down · 12.0% · 12mo
- Down + closing
- —
- Monthly P&I
- —
- Monthly cashflow
- —
- DSCR
- —
- Eligible?
- —
Short-term bridge; refi at stabilization.
Rent comps 4 comps
| Address | Beds | Baths | Sqft | Rent | $/sqft | DOM | Units | Dist |
|---|---|---|---|---|---|---|---|---|
| 271 Ebony Ln Biloxi, MS | 3.0 | 2.0 | 1498 | $1,600 | $1.07 | 13d | 1 | 0.49mi |
| 626 Water St Biloxi, MS | 3.0 | 2.0 | 1800 | $2,300 | $1.28 | 43d | 1 | 0.95mi |
| 626 Water St Biloxi, MS | 3.0 | 2.0 | 1800 | $2,200 | $1.22 | 21d | 1 | 0.95mi |
| 172 Hoxie St Biloxi, MS | 3.0 | 2.0 | 2117 | $1,800 | $0.85 | 21d | 1 | 1.29mi |
Listing history 16 events
-
2026-06-18days on market $189,900 Active 48 DOM
-
2026-06-17days on market $189,900 Active 47 DOM
-
2026-06-16days on market $189,900 Active 46 DOM
-
2026-06-15days on market $189,900 Active 45 DOM
-
2026-06-14days on market $189,900 Active 43 DOM
-
2026-06-13days on market $189,900 Active 42 DOM
-
2026-06-09days on market $189,900 Active 39 DOM
-
2026-06-08days on market $189,900 Active 38 DOM
-
2026-06-07days on market $189,900 Active 37 DOM
-
2026-06-05pricedays on market $189,900 Active 34 DOM
-
2026-06-03days on market $199,900 Active 33 DOM
-
2026-06-02days on market $199,900 Active 32 DOM
-
2026-06-01days on market $199,900 Active 31 DOM
-
2026-05-31days on market $199,900 Active 30 DOM
-
2026-05-30days on market $199,900 Active 29 DOM
-
2026-04-30$199,900 Active 1209-char remark
ⓘ Source: listings_history table (triggers on properties + properties_extension) + one-shot
backfill from property_details.listing_events for pre-trigger history.
Climate risk First Street
- Flood 8/10 Severe FEMA zone AE · 95% chance over 30 yrs
- Wildfire 1/10 Low
- Heat 10/10 Extreme 7 d/yr ≥106°F today · 22 d/yr by 30 yrs out
- Wind 9/10 Extreme 99% chance of damaging wind over 30 yrs
- Air quality 2/10 Low 1 unhealthy d/yr today · 2 by 30 yrs out
Nearby sold comps map
Loading sold comps map…
Walkable amenities ~0.75 mi
Loading nearby amenities…
Taxation est. · year 1
- Rental income
- $24,075
- − Mortgage interest
- −$10,637
- − Property taxes
- −$2,848
- − Insurance
- −$6,068
- − Repairs & maintenance
- −$1,926
- − Management
- −$1,926
- − Depreciation
- −$5,524
- Taxable loss
- −$4,856
- Est. tax savings @ 24.0%
- +$1,165
- After-tax cash flow
- $-683/yr
For passive investors: Depreciation is non-cash, so a rental often shows a tax loss while cash-flowing — sheltering income. Rental losses are passive: they offset passive income freely, and up to $25,000/yr can offset ordinary (W-2) income if you actively participate and your MAGI is under $100k (phasing out to $0 by $150k); unused losses carry forward. On sale, claimed depreciation is recaptured at up to 25%, and gains may owe capital-gains tax (a 1031 exchange can defer both). Figures are a year-1 estimate at your 24.0% rate — not tax advice; consult a CPA.
Schools (NCES district)
- District
- Biloxi Public School District
- NCES district ID
- 2800630
- Math proficiency
- 60% ▼ -7.00%
- Reading proficiency
- 48% ▼ -3.00%
- Median HH income
- $40,608
- Composite
- 45.26/100
- National rank
- #2657
- State rank
- #7 of 130 in MS
Livability — Biloxi
- Score
- 79/100
- State rank
- #6
- US rank
- #2141
Category grades
Schools grade is shown separately in the Schools card above.
Census & demographics
- Census place
- Biloxi, MS
- County
- Harrison County · 178,171 people
- City population
- 63,281
- Metro
- Gulfport-Biloxi, MS
- Population (ZIP)
- 7,701
- Household income
- $41,117
- Rent vs Own
- Severe rent burden
- 329.0
Population outlook (Harrison County) Hauer SSP2
- Today (2025)
- 228,444 people
- By 2030
- 241,942 · +5.9%
- By 2040
- 267,531 · +17.1%
- By 2050
- 291,062 · +27.4%
- By 2075
- 346,711 · +51.8%
- By 2100
- 378,165 · +65.5%
Race, ethnicity, and origin ACS 2023
- Neighborhood character
- Diverse neighborhood (Simpson 0.66)
- Race & ethnicity
- White 48% Black 28% Hispanic / Latino 15% Two or more races 5% Asian 4% Native American 3%
- Hispanic origin (detail)
- Mexican 6%
- Common ancestry
- Lithuanian 9% Slovak 2% Italian 1%
- Foreign-born
- 13% · Canada, Vietnam
- Languages at home
- 82% English-only · Spanish 14% Vietnamese 2% Other Indo-European 1%
Political lean MEDSL · Harrison
- 2024 margin
- Strong R (+28.9) · D 35.0% · R 63.9% · Other 1.1%
- 2008→2024 swing
- -2.9pp toward R · 2008: -26.0pp · 2024: -28.9pp
- All cycles
- 2024: R+28.9 2020: R+25.2 2016: R+30.7 2012: R+26.6 2008: R+26.0
Not yet ingested
- Civics
- —
Market trends
- HPI YoY
- ▼ -108.19%
- Current HPI
- 181.0603
- Rent YoY
- —
- Metro
- Gulfport-Biloxi, MS
- State GDP YoY
- —
- F500 in state
- 0
Price history
-5.0% since first listed2 events — show timeline
- 2026-06-03 Price Changed $189,900 MLSU
- 2026-04-30 Listed $199,900 MLSU
Property tax history
+56.2%/yrLatest (2018): $244 · +440.2% YoY. Source: county tax records.
Cash-flow waterfall
monthlySold comps — $/sqft
last 12 mo · ≤1 miLoading sold comps…