 Duplex
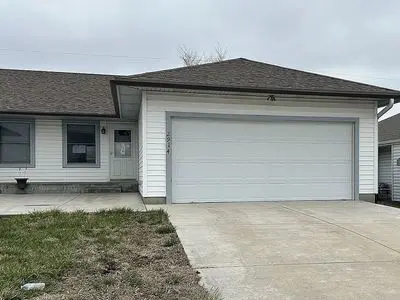
2914 SE Walnut Dr · Topeka, KS
Flood risk 1/10 · Minimal
- FEMA flood zone
- X (unshaded)
- Chance of flooding over 30 yrs
- 0.0%
- Est. flood insurance / yr
- $473 – $860
Fire risk 4/10 · Minor
- Est. fire insurance / yr
- $1,154 – $2,142
Heat risk 5/10 · Moderate
- Hot days now (above 107°F)
- 7 days/yr
- Hot days in 30 yrs
- 17 days/yr
Wind risk 2/10 · Minimal
- Chance of severe wind over 30 yrs
- —
Air-quality risk 2/10 · Minimal
- Unhealthy air days now
- 1 days/yr
- Unhealthy air days in 30 yrs
- 1 days/yr
Risk factors via First Street. Map © Google.
Why this score? — see what drove the C+ grade
The composite is a weighted blend of 9 inputs, each scored 0–100. Each bar is that input's sub-score; the figure is the points it added to the 100-point composite (weight × sub-score).
- Cash flow +27.6/30.0
- DSCR +9.7/10.0
- 1% rule +7.5/10.0
- ARV discount +7.5/15.0
- Livability +3.5/5.0
- Schools +2.7/10.0
- Rent growth +2.5/5.0
- Condition / age +2.5/5.0
- Appreciation +0.0/10.0
$195,000
🖨 Deal sheet 📄 Offer letter ✓ Due diligence
Multi-family units
County records classify this as Multi-Family (2-4 Unit). Listing-text estimate: 2 units. confirmed
Listing remarks MLS
Great opportunity for sweat equity in this half duplex home in SE Topeka. Two bedrooms on the main and 1 in the basement, 2.5 baths, 2 car attached garage, privacy fenced yard, back deck and more. Call today!
Key facts
- Back deck
- Big closets
- Privacy fenced yard
Tags
Property features AI
Exterior
- Home design: Built in 1996
- Construction: Living area approximately 1050
- Exterior features: Located in the East Topeka subdivision
Neighborhood map
What this means for you Summary
Snapshot
- This is a 2 × 3-bed/2.5-bath units multifamily listed at $195k.
Deal economics
- At list price, monthly cash flow is $581 ($7k/yr) — positive. Per door: $290/mo.
- The deal already cash-flows at list — no discount required.
- Meets the 1% rule at list price ($2k rent vs $195k).
- Recommended offer: $192k (1.5% below list) — sets the bar for market timing.
- Cap rate 9.9% vs local median 4.3% in Topeka — top-decile yield for the area; either an underpriced asset or a hidden risk that comps aren't pricing in. Stress-test before assuming the spread holds.
Location & tenants
- Location reads 69/100 on livability (#195 in KS) — a middle-class / working-renter tenant base. Strengths: cost of living A+, housing A+, health & safety A+; Watch: employment C-, schools D-, crime F.
- Shawnee Heights (rural): math 27% / reading 30% proficiency, ranked #90 of 169 in KS (top 53%) — low school quality limits family demand, transient renter base, plan for 1-2y turnover.
- Market conditions: 52 active listings in the ZIP; 219 units permitted in Shawnee County in 2024 (25 in 5+ unit buildings).
- At $2,443/mo this rent would consume 50% of the median local household income ($59k/yr) (locally 490% of renters already pay >50% of income on rent) — very limited rent-growth headroom before tenants either downsize or default.
Forward outlook
- Local home prices are declining (-3.0%/yr); year-one equity from $1k of loan paydown is wiped out by about $6k of value loss. Plan a longer hold.
- Shawnee County population projected to shrink 7% by 2050 — rents likely to lag national; underwrite the cash flow, not the appreciation.
- At projected returns (-3.0% appreciation + 3.0% rent growth), your $55k cash investment doubles in ~9 years — after that, you're playing with house money.
Negotiation context
- It's been on market 21 days — a 2% lower offer ($192k) is reasonable based on typical stale-listing flexibility.
- 2 sale attempts since 2y ago with the ask held roughly flat each time — persistent listings suggest the price (not the market) is what's stuck; bring a comps-based counter.
- Current owner paid $17k; list at $195k implies a 1054% gain — meaningful room to come down on a strong offer.
Risks & watch-outs
- Climate carrying-cost: extreme-heat days projected 7→17/yr by 2055 (HVAC capex compounding) — expect insurance premiums to compound above CPI over the hold.
Questions for the listing agent
- Can we see the unit-by-unit rent roll, current vacancy, and any below-market leases? What's the average tenancy length?
- What capital expenditures (roof, boiler, parking lot, exteriors) have been made in the last 5 years, and what's planned in the next 2?
- Is there a deadline driving the sale (1031 exchange, divorce, estate, relocation)? That informs how much negotiation room exists.
- Schools are D-rated, which usually means shorter tenancies and higher turnover. Who's the typical renter profile here, and what's been the actual vacancy rate?
- Crime grade is F in this area — have there been break-ins, vandalism, or insurance claims at this property in the last 3 years? What carrier currently insures it and at what premium?
- What's the average days-on-market for RENTAL listings here right now (not sales)? A rising rental-DOM trend means longer vacancies and softer asking-rent achievability than the comps imply.
- What's the recent tenant-quality profile in this submarket — average credit score on applications, eviction rate, late-payment / NSF rate, and stable-employment percentage? A property-management company in the area should have these aggregated.
- How much new apartment / multifamily construction is in the pipeline within 1–3 miles? Heavy new supply (>2% of stock underway) typically softens rents 12–24 months out; light construction supports rent growth.
Investment metrics
- 1% rule
- 1.25% ✓
- Cap rate
- 9.87%
- Cash-on-cash
- 12.76%
- DSCR
- 1.57
- GRM
- 6.7
CMA / ARV
No comps found within radius.
Projected returns pro-forma
-3.0% appreciation · 3.0% rent growth · sell at horizon
- IRR
- 2.6%
- Equity multiple
- 1.10×
- Total profit
- $5,414
- Equity at exit
- $29,075
- IRR
- 12.2%
- Equity multiple
- 1.96×
- Total profit
- $52,479
- Equity at exit
- $16,860
Cash invested: $54,600 (down + closing). Projections, not guarantees.
Landlord ↔ Tenant lean methodology
- Overall (STATE)
- 83 Strongly Landlord-Friendly
- State Kansas
- 83 Strongly Landlord-Friendly · R+10
- County
- — inherits STATE
- City
- — inherits STATE
ZIP-level market 66605
- Active inventory
- 52
- Price-to-rent
- 13.3×
Monthly cashflow live
- Estimated rent
- $2,443 medium interval (Pro) →
- Mortgage (P&I)
- −$1,023
- Tax from tax record
- −$246 /mo · $2,947/yr
- Insurance
- −$81
- HOA
- −$0
- Vacancy / Maint / Mgmt
- −$513
- Net cashflow
- $581
Break-even live
2-unit breakdown (identical units grouped — click to expand)
| Units | Beds | Baths | Est. rent |
|---|---|---|---|
| 2× units | 3 | 2.5 | $2,442 |
| #1 | 3 | 2.5 | $1,221 |
| #2 | 3 | 2.5 | $1,221 |
| Total (2 units) | $2,443 | ||
UW: 25.0% down · 7.5% · 30yr · 1.5% tax · 5.0% vac · 8.0% maint · 8.0% mgmt
Financing live
Cash to close
- Down payment
- $48,750
- Closing costs
- $5,850
- Reserves months
- —
- Total cash needed
- —
Loan-product check · same deal, 3 products live
Conventional
25% down · 7.5% · 30yr
- Down + closing
- —
- Monthly P&I
- —
- Monthly cashflow
- —
- DSCR
- —
- Eligible?
- —
Personal DTI + credit; lowest rate.
DSCR
20% down · 8.5% · 30yr
- Down + closing
- —
- Monthly P&I
- —
- Monthly cashflow
- —
- DSCR
- —
- Eligible?
- —
No personal income docs; deal must DSCR.
Hard money
10% down · 12.0% · 12mo
- Down + closing
- —
- Monthly P&I
- —
- Monthly cashflow
- —
- DSCR
- —
- Eligible?
- —
Short-term bridge; refi at stabilization.
Listing history 21 events
-
2026-06-16status $195,000 Under Contract 21 DOM
-
2026-06-15days on market $195,000 Active 21 DOM
-
2026-06-14days on market $195,000 Active 19 DOM
-
2026-06-13days on market $195,000 Active 18 DOM
-
2026-06-10days on market $195,000 Active 16 DOM
-
2026-06-09days on market $195,000 Active 15 DOM
-
2026-06-08days on market $195,000 Active 14 DOM
-
2026-06-07days on market $195,000 Active 13 DOM
-
2026-06-05days on market $195,000 Active 10 DOM
-
2026-06-03days on market $195,000 Active 9 DOM
-
2026-06-02days on market $195,000 Active 8 DOM
-
2026-06-01days on market $195,000 Active 7 DOM
-
2026-05-31days on market $195,000 Active 6 DOM
-
2026-05-30days on market $195,000 Active 5 DOM
-
2026-05-25$195,000 Active
-
2024-05-21soldstatus
-
2024-05-17soldstatus Closed 208-char remark
Show marketing remark (208 chars)
Great opportunity for sweat equity in this half duplex home in SE Topeka. Two bedrooms on the main and 1 in the basement, 2.5 baths, 2 car attached garage, privacy fenced yard, back deck and more. Call today!
-
2024-04-08status Pending 208-char remark
Show marketing remark (208 chars)
Great opportunity for sweat equity in this half duplex home in SE Topeka. Two bedrooms on the main and 1 in the basement, 2.5 baths, 2 car attached garage, privacy fenced yard, back deck and more. Call today!
-
2024-03-28$160,000 Active 208-char remark
Show marketing remark (208 chars)
Great opportunity for sweat equity in this half duplex home in SE Topeka. Two bedrooms on the main and 1 in the basement, 2.5 baths, 2 car attached garage, privacy fenced yard, back deck and more. Call today!
-
2008-06-05soldstatus
-
1995-10-01soldstatus $16,900
ⓘ Source: listings_history table (triggers on properties + properties_extension) + one-shot
backfill from property_details.listing_events for pre-trigger history.
Tax reassessment forecast KS · Resets to sale price
- Current annual tax
- $2,947 · $246/mo
- Projected year-2 tax
- $2,947 · $246/mo
- Expected delta
- $0/yr ($0/mo · 0.0%)
ⓘ Screening estimate from a state-policy table — verify with the county assessor before closing.
Climate risk First Street
- Flood 1/10 Low FEMA zone X (unshaded) · 0% chance over 30 yrs
- Wildfire 4/10 Moderate
- Heat 5/10 Major 7 d/yr ≥107°F today · 17 d/yr by 30 yrs out
- Wind 2/10 Low
- Air quality 2/10 Low 1 unhealthy d/yr today · 1 by 30 yrs out
Nearby sold comps map
Loading sold comps map…
Walkable amenities ~0.75 mi
Loading nearby amenities…
Taxation est. · year 1
- Rental income
- $29,316
- − Mortgage interest
- −$10,923
- − Property taxes
- −$2,947
- − Insurance
- −$975
- − Repairs & maintenance
- −$2,345
- − Management
- −$2,345
- − Depreciation
- −$5,673
- Taxable income
- $4,108
- Est. tax owed @ 24.0%
- −$986
- After-tax cash flow
- $5,981/yr
For passive investors: Depreciation is non-cash, so a rental often shows a tax loss while cash-flowing — sheltering income. Rental losses are passive: they offset passive income freely, and up to $25,000/yr can offset ordinary (W-2) income if you actively participate and your MAGI is under $100k (phasing out to $0 by $150k); unused losses carry forward. On sale, claimed depreciation is recaptured at up to 25%, and gains may owe capital-gains tax (a 1031 exchange can defer both). Figures are a year-1 estimate at your 24.0% rate — not tax advice; consult a CPA.
Schools (NCES district)
- District
- Shawnee Heights
- NCES district ID
- 2012180
- Math proficiency
- 27% ▼ -11.00%
- Reading proficiency
- 30% ▼ -7.00%
- Median HH income
- $71,771
- Composite
- 27.04/100
- National rank
- #7053
- State rank
- #90 of 169 in KS
Livability — Topeka
- Score
- 69/100
- State rank
- #195
- US rank
- #8848
Category grades
Schools grade is shown separately in the Schools card above.
Census & demographics
- Census place
- Topeka, KS
- County
- Shawnee County · 118,130 people
- City population
- 118,130
- Metro
- Topeka, KS
- Population (ZIP)
- 20,891
- Household income
- $59,106
- Rent vs Own
- Severe rent burden
- 490.0
Population outlook (Shawnee County) Hauer SSP2
- Today (2025)
- 179,277 people
- By 2030
- 177,762 · -0.8%
- By 2040
- 172,341 · -3.9%
- By 2050
- 166,330 · -7.2%
- By 2075
- 152,417 · -15.0%
- By 2100
- 134,782 · -24.8%
Race, ethnicity, and origin ACS 2023
- Neighborhood character
- Diverse neighborhood (Simpson 0.58)
- Race & ethnicity
- White 60% Hispanic / Latino 20% Black 13% Two or more races 10%
- Hispanic origin (detail)
- Mexican 17% Puerto Rican 2%
- Common ancestry
- Lithuanian 3% Slovak 1% Italian 1%
- Foreign-born
- 6% · Canada
- Languages at home
- 90% English-only · Spanish 9% Other Indo-European 1%
Political lean MEDSL · Shawnee
- 2024 margin
- Toss-up / Even · D 49.3% · R 48.8% · Other 2.0%
- 2008→2024 swing
- +0.8pp no change · 2008: -0.3pp · 2024: 0.5pp
- All cycles
- 2024: D+0.5 2020: D+3.0 2016: R+2.8 2012: R+1.7 2008: R+0.3
Not yet ingested
- Civics
- —
Market trends
- HPI YoY
- ▼ -150.37%
- Current HPI
- 206.375
- Rent YoY
- —
- Metro
- Topeka, KS
- State GDP YoY
- —
- F500 in state
- 0
Price history
+1053.8% since first listed7 events — show timeline
- 2026-05-25 Listed $195,000 FSBO.com
- 2024-05-21 Sold (Public Records) — Public Records
- 2024-05-17 Sold (MLS) — Sunflower MLS as distributed by MLS GRID
- 2024-04-08 Pending — Sunflower MLS as distributed by MLS GRID
- 2024-03-28 Listed $160,000 Sunflower MLS as distributed by MLS GRID
- 2008-06-05 Sold (Public Records) — Public Records
- 1995-10-01 Sold (Public Records) $16,900 Public Records
Property tax history
+4.1%/yrLatest (2025): $2,947 · -4.5% YoY. Source: county tax records.
Cash-flow waterfall
monthlySold comps — $/sqft
last 12 mo · ≤1 miLoading sold comps…