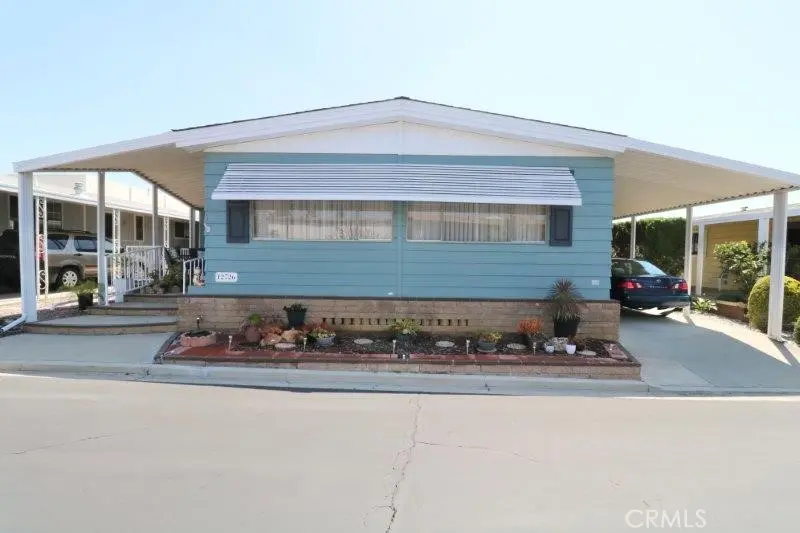
12726 Lake Forest Dr #25 · La Mirada, CA
Flood risk 1/10 · Minimal
- FEMA flood zone
- X (unshaded)
- Chance of flooding over 30 yrs
- 0.0%
- Est. flood insurance / yr
- $507 – $1,088
Fire risk 1/10 · Minimal
- Est. fire insurance / yr
- $659 – $1,223
Heat risk 6/10 · Moderate
- Hot days now (above 93°F)
- 7 days/yr
- Hot days in 30 yrs
- 21 days/yr
Wind risk 1/10 · Minimal
- Chance of severe wind over 30 yrs
- —
Air-quality risk 5/10 · Moderate
- Unhealthy air days now
- 9 days/yr
- Unhealthy air days in 30 yrs
- 10 days/yr
Risk factors via First Street. Map © Google.
Why this score? — see what drove the B- grade
The composite is a weighted blend of 9 inputs, each scored 0–100. Each bar is that input's sub-score; the figure is the points it added to the 100-point composite (weight × sub-score).
- Cash flow +26.9/30.0
- DSCR +9.3/10.0
- ARV discount +7.5/15.0
- 1% rule +7.3/10.0
- Rent growth +4.0/5.0
- Schools +4.0/10.0
- Livability +3.7/5.0
- Condition / age +2.8/5.0
- Appreciation +0.0/10.0
$275,000
🖨 Deal sheet 📄 Offer letter ✓ Due diligence
Listing remarks MLS
Senior Park community, featuring a Large Clubhouse Overlooking our Beautiful Lake Entrance. This 2 Bed 2 Bath home features a large living room, larger family room open to the beautiful kitchen with a butcher block island, large master bed and bathroom, and an additional bonus room. Outside features a small front and back covered patios, newer roof, newer exterior paint, close to the clubhouse, pool and lake. This is a must see!
Key facts
- Newer roof
- Pool and lake
- Butcher block island
Tags
Neighborhood map
What this means for you Summary
Snapshot
- This is a 2-bed/2.0-bath manufactured listed at $275k. Condition is rated average.
Deal economics
- At list price, monthly cash flow is $765 ($9k/yr) — positive.
- The deal already cash-flows at list — no discount required.
- Meets the 1% rule at list price ($3k rent vs $275k).
- Recommended offer: $242k (12.0% below list) — sets the bar for market timing.
- Cap rate 9.6% vs local median 2.4% in La Mirada — top-decile yield for the area; either an underpriced asset or a hidden risk that comps aren't pricing in. Stress-test before assuming the spread holds.
Location & tenants
- Location reads 73/100 on livability (#149 in CA) — a middle-class / working-renter tenant base. Strengths: employment A+, commute A, schools B; Watch: health & safety D, cost of living F.
- Norwalk-La Mirada Unified (suburban): math 28% / reading 61% proficiency, ranked #177 of 517 in CA (top 34%) — families likely to look elsewhere, expect single-tenant / working-renter base with shorter leases; 61% free/reduced lunch — lower-income household profile, screen leases tightly.
- Market conditions: Rents rising fast (+6.1%/yr); 52 active listings in the ZIP; 12 comparable units currently listed for rent nearby; rentals leasing fast (median 2d on market — plan ~1-2 weeks tenant-placement turnaround); solid renter incomes; 19,697 units permitted in Los Angeles County in 2024 (9,426 in 5+ unit buildings).
- This rent runs 37% of the median local income ($110k/yr) — at the standard rent-burdened threshold; future hikes will face affordability resistance.
Forward outlook
- Local home prices are declining (-3.0%/yr); year-one equity from $2k of loan paydown is wiped out by about $8k of value loss. Plan a longer hold.
- Los Angeles County population projected at +9% by 2050 — modest demand growth; plan on rents tracking national, not racing it.
- At projected returns (-3.0% appreciation + 6.1% rent growth), your $77k cash investment doubles in ~8 years — after that, you're playing with house money.
Negotiation context
- It's been on market 408 days — a 12% lower offer ($242k) is reasonable based on typical stale-listing flexibility.
Risks & watch-outs
- Climate carrying-cost: extreme-heat days projected 7→21/yr by 2055 (HVAC capex compounding) — expect insurance premiums to compound above CPI over the hold.
Questions for the listing agent
- It's been on market 408 days. Have you received any prior offers? Is the seller open to a 12% concession, seller financing, or rate buy-down credit?
- Built in 1976 — when were the roof, HVAC, electrical panel, plumbing, and water heater last replaced?
- Why hasn't it sold? Are there any deal-killer items the seller is aware of (foundation, flood, title, zoning, code violations)?
- Is there a deadline driving the sale (1031 exchange, divorce, estate, relocation)? That informs how much negotiation room exists.
- Schools are B-rated — typically a magnet for longer-tenancy family renters. What's the average tenant stay here, and is there a school-zone premium baked into asking?
- What's the average days-on-market for RENTAL listings here right now (not sales)? A rising rental-DOM trend means longer vacancies and softer asking-rent achievability than the comps imply.
- What's the recent tenant-quality profile in this submarket — average credit score on applications, eviction rate, late-payment / NSF rate, and stable-employment percentage? A property-management company in the area should have these aggregated.
- How much new for-sale + rental construction is in the pipeline within 1–3 miles? Heavy new supply typically softens prices + rents 12–24 months out; constrained supply supports both.
Investment metrics
- 1% rule
- 1.23% ✓
- Cap rate
- 9.63%
- Cash-on-cash
- 11.92%
- DSCR
- 1.53
- GRM
- 6.8
CMA / ARV
- ARV (median comp)
- $275,000
- List price
- $275,000
- Delta
- —
- Verdict
- FAIR
- Comps
- 7 within 1.0 mi
Show comp detail 8 sales within ~0.75 mi
| Address | Dist | Beds/Ba | Sqft | Sold | Price | $/sf | Match |
|---|---|---|---|---|---|---|---|
| 12921 Lake Frst #35 | 0.08mi | 2/2.0 | 1,440 (0%) | 10mo | $260,000 | $181 | 88 |
| 14006 Lake Glen Dr #48 | 0.14mi | 2/2.0 | 1,440 (0%) | 15mo | $330,000 | $229 | 82 |
| 14010 Lake Glen Dr #47 | 0.13mi | 2/2.0 | 1,440 (0%) | 16mo | $359,500 | $250 | 80 |
| 14046 Lake Crest Dr #76 | 0.04mi | 2/2.0 | 1,536 (+7%) | 9mo | $180,000 | $117 | 79 |
| 14041 Lake Side Dr #130 | 0.03mi | 2/2.0 | 1,632 (+13%) | 0mo | $295,000 | $181 | 76 |
| 14044 Lake Glen Dr #38 | 0.08mi | 2/2.0 | 1,248 (-13%) | 0mo | $275,000 | $220 | 74 |
| 14020 Lake Glen Dr #45 | 0.12mi | 2/2.0 | 1,638 (+14%) | 9mo | $245,000 | $150 | 64 |
| 14038 Lake Glen Dr #40 | 0.11mi | 3/2.0 (+1) | 1,354 (-6%) | 22mo | $325,000 | $240 | 62 |
Match score weights: distance 35% · size 25% · config 20% · recency 20%. Top-matched comps best support the ARV.
Projected returns pro-forma
-3.0% appreciation · 6.07% rent growth · sell at horizon
- IRR
- 4.8%
- Equity multiple
- 1.19×
- Total profit
- $14,937
- Equity at exit
- $41,003
- IRR
- 17.0%
- Equity multiple
- 2.60×
- Total profit
- $122,877
- Equity at exit
- $23,777
Cash invested: $77,000 (down + closing). Projections, not guarantees.
Landlord ↔ Tenant lean methodology
- Overall (STATE)
- 18 Strongly Tenant-Friendly
- State California
- 18 Strongly Tenant-Friendly · D+13
- County
- — inherits STATE
- City
- — inherits STATE
ZIP-level market 90638
- Rents YoY
- 6.1%
- Active inventory
- 52
- Price-to-rent
- 6.8×
Monthly cashflow live
- Estimated rent
- $3,374 high interval (Pro) →
- Mortgage (P&I)
- −$1,442
- Tax est. 1.5%
- −$344 /mo · $4,125/yr
- Insurance
- −$115
- HOA
- −$0
- Vacancy / Maint / Mgmt
- −$708
- Net cashflow
- $765
Break-even live
UW: 25.0% down · 7.5% · 30yr · 1.5% tax · 5.0% vac · 8.0% maint · 8.0% mgmt
Financing live
Cash to close
- Down payment
- $68,750
- Closing costs
- $8,250
- Reserves months
- —
- Total cash needed
- —
Loan-product check · same deal, 3 products live
Conventional
25% down · 7.5% · 30yr
- Down + closing
- —
- Monthly P&I
- —
- Monthly cashflow
- —
- DSCR
- —
- Eligible?
- —
Personal DTI + credit; lowest rate.
DSCR
20% down · 8.5% · 30yr
- Down + closing
- —
- Monthly P&I
- —
- Monthly cashflow
- —
- DSCR
- —
- Eligible?
- —
No personal income docs; deal must DSCR.
Hard money
10% down · 12.0% · 12mo
- Down + closing
- —
- Monthly P&I
- —
- Monthly cashflow
- —
- DSCR
- —
- Eligible?
- —
Short-term bridge; refi at stabilization.
Rent comps 12 comps
| Address | Beds | Baths | Sqft | Rent | $/sqft | DOM | Units | Dist |
|---|---|---|---|---|---|---|---|---|
| 12202 Colima Rd Whittier, CA | 3.0 | 2.0 | 1224 | $4,000 | $3.27 | 10d | 1 | 0.45mi |
| 13857 Leffingwell Rd Whittier, CA | 2.0–3.0 | 2.0 | 1100 | $2,990 | $2.72 | 1d | 1 | 0.54mi |
| 13987 Coteau Dr #10 Whittier, CA | 3.0 | 2.0 | 1426 | $3,250 | $2.28 | 16d | 1 | 0.62mi |
| 14130 Bay St La Mirada, CA | 3.0 | 3.5 | 1460 | $3,950 | $2.71 | 43d | 1 | 0.72mi |
| 14022 Bay St Santa Fe Springs, CA | 3.0 | 2.5 | 1530 | $4,100 | $2.68 | 12d | 1 | 0.73mi |
| 14515 Leffingwell Rd Whittier, CA | 2.0 | 1.0 | 1050 | $2,495 | $2.38 | 1d | 6 | 0.84mi |
| 11442 Colima Rd Whittier, CA | 2.0 | 2.0 | 900 | $2,300 | $2.56 | 1d | 1 | 0.92mi |
| 14820 Ragan Dr La Mirada, CA | 3.0 | 2.0 | 1358 | $3,600 | $2.65 | 12d | 1 | 0.92mi |
| 14055 Honeysuckle Ln Unit 1/2 Whittier, CA | 3.0 | 3.0 | 1200 | $3,200 | $2.67 | 1d | 1 | 1.05mi |
| 12123 Laurel Ave Whittier, CA | 3.0 | 2.0 | 1238 | $4,200 | $3.39 | 1d | 1 | 1.15mi |
| 11622 Carmenita Rd Whittier, CA | 2.0–4.0 | 1.0–2.5 | 1049 | $2,935 | $2.80 | 1d | 1 | 1.17mi |
| 11920 Laurel Ave Unit A Whittier, CA | 3.0 | 1.0 | 1200 | $3,500 | $2.92 | 1d | 1 | 1.20mi |
Listing history 16 events
-
2026-06-18days on market $275,000 Active 408 DOM
-
2026-06-17days on market $275,000 Active 407 DOM
-
2026-06-16days on market $275,000 Active 406 DOM
-
2026-06-15days on market $275,000 Active 405 DOM
-
2026-06-13days on market $275,000 Active 403 DOM
-
2026-06-13days on market $275,000 Active 402 DOM
-
2026-06-09days on market $275,000 Active 399 DOM
-
2026-06-08days on market $275,000 Active 398 DOM
-
2026-06-07days on market $275,000 Active 397 DOM
-
2026-06-04days on market $275,000 Active 394 DOM
-
2026-06-03days on market $275,000 Active 393 DOM
-
2026-06-02days on market $275,000 Active 392 DOM
-
2026-06-01days on market $275,000 Active 391 DOM
-
2026-05-31days on market $275,000 Active 390 DOM
-
2025-08-14price $275,000 432-char remark
Show marketing remark (432 chars)
Senior Park community, featuring a Large Clubhouse Overlooking our Beautiful Lake Entrance. This 2 Bed 2 Bath home features a large living room, larger family room open to the beautiful kitchen with a butcher block island, large master bed and bathroom, and an additional bonus room. Outside features a small front and back covered patios, newer roof, newer exterior paint, close to the clubhouse, pool and lake. This is a must see!
-
2025-05-06$295,000 Active 432-char remark
Show marketing remark (432 chars)
Senior Park community, featuring a Large Clubhouse Overlooking our Beautiful Lake Entrance. This 2 Bed 2 Bath home features a large living room, larger family room open to the beautiful kitchen with a butcher block island, large master bed and bathroom, and an additional bonus room. Outside features a small front and back covered patios, newer roof, newer exterior paint, close to the clubhouse, pool and lake. This is a must see!
ⓘ Source: listings_history table (triggers on properties + properties_extension) + one-shot
backfill from property_details.listing_events for pre-trigger history.
Climate risk First Street
- Flood 1/10 Low FEMA zone X (unshaded) · 0% chance over 30 yrs
- Wildfire 1/10 Low
- Heat 6/10 Major 7 d/yr ≥93°F today · 21 d/yr by 30 yrs out
- Wind 1/10 Low
- Air quality 5/10 Major 9 unhealthy d/yr today · 10 by 30 yrs out
Nearby sold comps map
Loading sold comps map…
Walkable amenities ~0.75 mi
Loading nearby amenities…
Taxation est. · year 1
- Rental income
- $40,484
- − Mortgage interest
- −$15,404
- − Property taxes
- −$4,125
- − Insurance
- −$1,375
- − Repairs & maintenance
- −$3,239
- − Management
- −$3,239
- − Depreciation
- −$8,000
- Taxable income
- $5,102
- Est. tax owed @ 24.0%
- −$1,225
- After-tax cash flow
- $7,952/yr
For passive investors: Depreciation is non-cash, so a rental often shows a tax loss while cash-flowing — sheltering income. Rental losses are passive: they offset passive income freely, and up to $25,000/yr can offset ordinary (W-2) income if you actively participate and your MAGI is under $100k (phasing out to $0 by $150k); unused losses carry forward. On sale, claimed depreciation is recaptured at up to 25%, and gains may owe capital-gains tax (a 1031 exchange can defer both). Figures are a year-1 estimate at your 24.0% rate — not tax advice; consult a CPA.
Condition & rehab AI · 12 photos
This manufactured home is in good condition with a good roof and exterior. It has a good kitchen and hardwood floors, but the bathrooms need updating. Painting the interior and replacing fixtures would significantly increase its value.
Repairs flagged
- Minor bathroom fixtures — need updating for a modern look
- Minor kitchen backsplash — dated design
Value-add opportunities
- Both paint interior walls — enhances curb appeal and interior aesthetics
- Both replace bathroom fixtures — modernizes the space and improves functionality
Renovation cost estimate screening
| Repair item | Severity | Est. cost |
|---|---|---|
| bathroom fixtures · need updating for a modern look | Minor | $500–3,000 |
| kitchen backsplash · dated design | Minor | $500–3,000 |
| Total estimated repair cost · 2 items | $1,000–6,000 |
Value-add ROI direction
- Both paint interior walls — enhances curb appeal and interior aesthetics ↑
- Both replace bathroom fixtures — modernizes the space and improves functionality ↑
ⓘ Cost ranges are severity-bucket heuristics (US national rule-of-thumb). Get contractor quotes + a written scope before underwriting a rehab budget.
Schools (NCES district)
- District
- Norwalk-La Mirada Unified
- NCES district ID
- 0627690
- Math proficiency
- 28% ▼ -7.00%
- Reading proficiency
- 61% ▲ 14.00%
- Median HH income
- $65,950
- Composite
- 39.62/100
- National rank
- #3919
- State rank
- #177 of 517 in CA
Livability — La Mirada
- Score
- 73/100
- State rank
- #149
- US rank
- #5020
Category grades
Schools grade is shown separately in the Schools card above.
Census & demographics
- Census place
- La Mirada, CA
- County
- Los Angeles County · 9,444,647 people
- City population
- 45,933
- Metro
- Los Angeles-Long Beach-Anaheim, CA
- Population (ZIP)
- 45,933
- Household income
- $109,649
- Rent vs Own
- Severe rent burden
- 814.0
Population outlook (Los Angeles County) Hauer SSP2
- Today (2025)
- 10,940,515 people
- By 2030
- 11,256,481 · +2.9%
- By 2040
- 11,729,929 · +7.2%
- By 2050
- 11,948,407 · +9.2%
- By 2075
- 11,818,114 · +8.0%
- By 2100
- 10,842,928 · -0.9%
Race, ethnicity, and origin ACS 2023
- Neighborhood character
- Diverse neighborhood (Simpson 0.67)
- Race & ethnicity
- Hispanic / Latino 46% White 26% Asian 23% Two or more races 17% Black 2%
- Hispanic origin (detail)
- Mexican 37% Cuban 1%
- Common ancestry
- Lithuanian 1% Italian 1% Slovak 1%
- Foreign-born
- 27% · Canada, South Korea, China
- Languages at home
- 56% English-only · Spanish 25% Korean 10% Tagalog/Filipino 3%
Political lean MEDSL · Los Angeles
- 2024 margin
- Solid D (+32.9) · D 64.8% · R 31.9% · Other 3.3%
- 2008→2024 swing
- -7.4pp toward R · 2008: 40.4pp · 2024: 32.9pp
- All cycles
- 2024: D+32.9 2020: D+44.2 2016: D+48.0 2012: D+40.0 2008: D+40.4
Not yet ingested
- Civics
- —
Market trends
- HPI YoY
- ▼ -892.51%
- Current HPI
- 370.4661
- Rent YoY
- ▲ 6.07%
- Metro
- Los Angeles-Long Beach-Anaheim, CA
- State GDP YoY
- ▲ 3.21%
- F500 in state
- 116
Industry mix (Fortune 500 HQ in CA)
| Industry | F500 HQs | Revenue |
|---|---|---|
| Technology | 27 | $1,492B |
|
||
| Financial Services | 3 | $174B |
|
||
| Retail | 3 | $44B |
|
||
| Insurance | 3 | $26B |
|
||
| Media / Entertainment | 2 | $115B |
|
||
| Pharmaceuticals / Biotech | 2 | $62B |
|
||
Price history
-6.8% since first listed2 events — show timeline
- 2025-08-14 Price Changed $275,000 CRMLS
- 2025-05-06 Listed $295,000 CRMLS
Cash-flow waterfall
monthlySold comps — $/sqft
last 12 mo · ≤1 miLoading sold comps…