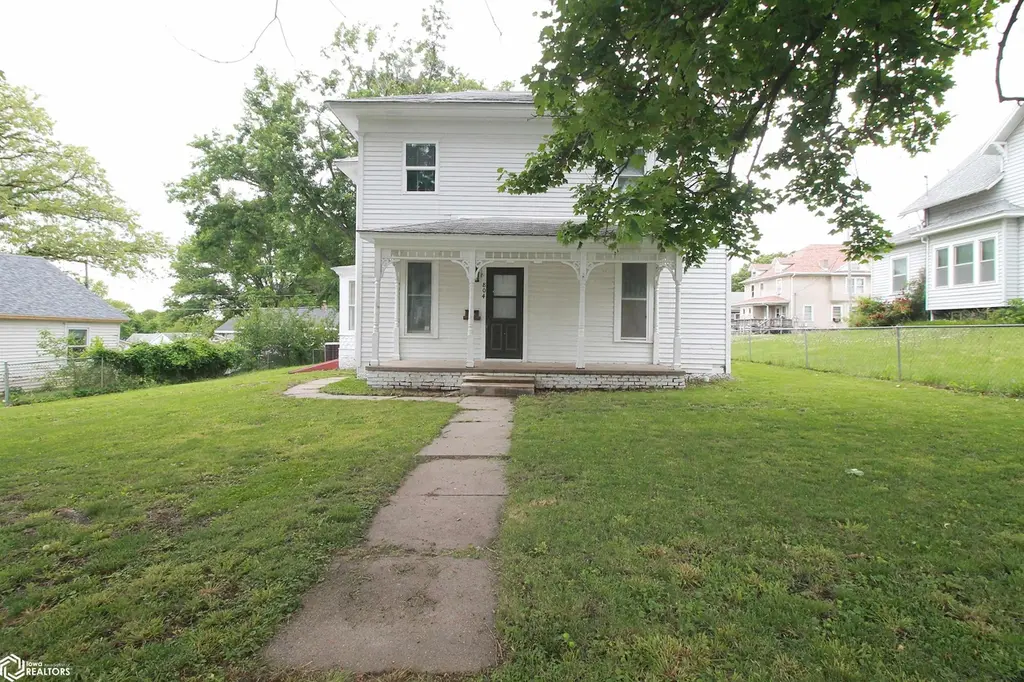
804 S Center St · Shenandoah, IA
Flood risk 1/10 · Minimal
- FEMA flood zone
- X (unshaded)
- Chance of flooding over 30 yrs
- 0.0%
- Est. flood insurance / yr
- $507 – $1,088
Fire risk 1/10 · Minimal
- Est. fire insurance / yr
- $902 – $1,676
Heat risk 3/10 · Minor
- Hot days now (above 106°F)
- 7 days/yr
- Hot days in 30 yrs
- 15 days/yr
Wind risk 2/10 · Minimal
- Chance of severe wind over 30 yrs
- —
Air-quality risk 1/10 · Minimal
- Unhealthy air days now
- 0 days/yr
- Unhealthy air days in 30 yrs
- 0 days/yr
Risk factors via First Street. Map © Google.
Why this score? — see what drove the D grade
The composite is a weighted blend of 9 inputs, each scored 0–100. Each bar is that input's sub-score; the figure is the points it added to the 100-point composite (weight × sub-score).
- Cash flow +14.4/30.0
- ARV discount +7.5/15.0
- Schools +5.6/10.0
- DSCR +4.4/10.0
- 1% rule +3.9/10.0
- Livability +3.8/5.0
- Rent growth +2.5/5.0
- Condition / age +2.5/5.0
- Appreciation +0.0/10.0
$140,000
🖨 Deal sheet (PDF) 📄 Offer letter ✓ Due diligence
Listing remarks MLS
his house was built in 1890 and a lot of the hardwood floors are still in existence. Most of the woodwork is painted. It is as is condition. Nice large double car garage. 5 bedrooms with one bedroom on main floor. It would be real easy to turn this into a duplex. Investors are welcome to take a look at this property. We need someone to go in and do the things to bring this back to great house that it once was. this is now under Auction. (9/16/2016First American Asset
Key facts
- Main floor laundry
- New electrical
- Updated kitchen
Tags
Property features AI
Finance
- Other: Directions: House sits on the west side of the street
Exterior
- Parking: Detached 2-car garage
- Utilities: Public sewer
- Home design: Two levels; Single-family residence; Wood siding
- Construction: Wood siding construction
- Exterior features: Lot approximately 0.19 acres (66 x 125); Gravel driveway
Interior
- Bathrooms: 1 full bathroom; 1 three-quarter bathroom
- Interior features: Central air conditioning; Forced air heating
Neighborhood map
What this means for you Summary
Snapshot
- This is a 5-bed/2.0-bath single-family listed at $140k.
Deal economics
- At list price, monthly cash flow is $28 ($338/yr) — positive.
- The deal already cash-flows at list — no discount required.
- To meet the 1% rule (rent ≥ 1% of price), the offer needs to be $125k (10.7% below list).
- Recommended offer: $125k (10.7% below list) — sets the bar for 1% rule.
Location & tenants
- Location reads 76/100 on livability (#206 in IA, #3,757 nationally) — a middle-class / working-renter tenant base. Strengths: cost of living A+, housing A+, health & safety A+; Watch: crime D-, amenities F, commute F.
- Shenandoah Community School District (town): math 64% / reading 69% proficiency, ranked #190 of 289 in IA (top 66%) — acceptable for families but not a draw, mixed tenant base, ~2y average lease.
- Zoned schools: Shenandoah Elementary School (math 77% / reading 57%, grade B+, #273 of 616 statewide, top 51%, 375 students, 39% FRL); Shenandoah Middle School (math 61% / reading 74%, grade A-, #133 of 246 statewide, top 56%, 296 students, 38% FRL); Shenandoah High School (math 61% / reading 68%, grade B-, #211 of 336 statewide, top 70%, 259 students, 38% FRL) — zoned schools at 38% FRL track the district average.
- Market conditions: 24 active listings in the ZIP; 1 comparable units currently listed for rent nearby; 25 units permitted in Page County in 2024 (0 in 5+ unit buildings).
Forward outlook
- Local home prices are declining (-3.0%/yr); year-one equity from $968 of loan paydown is wiped out by about $4k of value loss. Plan a longer hold.
- Page County population projected at -12% by 2050 — secular population decline; favor cash flow + early exit over multi-decade hold.
Negotiation context
- It's been on market 24 days — a 2% lower offer ($138k) is reasonable based on typical stale-listing flexibility.
- 2 sale attempts since 10y ago with the ask held roughly flat each time — persistent listings suggest the price (not the market) is what's stuck; bring a comps-based counter.
Risks & watch-outs
- Watch-outs: built in 1890 — expect roof / HVAC / electrical / plumbing capex.
Questions for the listing agent
- Built in 1890 — when were the roof, HVAC, electrical panel, plumbing, and water heater last replaced?
- Is there a deadline driving the sale (1031 exchange, divorce, estate, relocation)? That informs how much negotiation room exists.
- Schools are B-rated — typically a magnet for longer-tenancy family renters. What's the average tenant stay here, and is there a school-zone premium baked into asking?
- Crime grade is D in this area — have there been break-ins, vandalism, or insurance claims at this property in the last 3 years? What carrier currently insures it and at what premium?
- The area grade is low — what's the realistic commute time and amenity access for the typical tenant pool here? Any planned neighborhood developments (good or bad) we should know about?
- What's the average days-on-market for RENTAL listings here right now (not sales)? A rising rental-DOM trend means longer vacancies and softer asking-rent achievability than the comps imply.
- What's the recent tenant-quality profile in this submarket — average credit score on applications, eviction rate, late-payment / NSF rate, and stable-employment percentage? A property-management company in the area should have these aggregated.
- How much new for-sale + rental construction is in the pipeline within 1–3 miles? Heavy new supply typically softens prices + rents 12–24 months out; constrained supply supports both.
Investment metrics
- 1% rule
- 0.89% ✗
- Cap rate
- 6.53%
- Cash-on-cash
- 0.86%
- DSCR
- 1.04
- GRM
- 9.3
CMA / ARV
- ARV (on-the-fly)
- $66,816
- Comps found
- 9
Show comp detail 9 sales within ~0.75 mi
| Address | Dist | Beds/Ba | Sqft | Sold | Price | $/sf | Match |
|---|---|---|---|---|---|---|---|
| 307 Anna St | 0.36mi | 5/2.0 | 2,038 (+10%) | 1mo | $57,500 | $28 | 66 |
| 712 West St | 0.23mi | 4/1.0 (-1) | 1,688 (-9%) | 3mo | $60,000 | $36 | 63 |
| 509 5th Ave | 0.51mi | 5/2.0 | 1,791 (-4%) | 20mo | $20,000 | $11 | 53 |
| 306 E Farnham St | 0.51mi | 4/2.0 (-1) | 1,781 (-4%) | 14mo | $140,000 | $79 | 53 |
| 104 E Grant Ave | 0.35mi | 4/1.0 (-1) | 1,597 (-14%) | 2mo | $45,000 | $28 | 50 |
| 508 8th Ave | 0.36mi | 4/2.0 (-1) | 1,616 (-13%) | 11mo | $120,000 | $74 | 47 |
| 105 Southview Cir | 0.30mi | 6/2.5 (+1) | 1,700 (-8%) | 21mo | $230,000 | $135 | 47 |
| 602 6th Ave | 0.45mi | 4/2.0 (-1) | 1,736 (-6%) | 19mo | $40,000 | $23 | 47 |
| 306 W Sheridan Ave | 0.52mi | 5/1.0 | 2,044 (+10%) | 13mo | $189,900 | $93 | 44 |
Match score weights: distance 35% · size 25% · config 20% · recency 20%. Top-matched comps best support the ARV.
Projected returns pro-forma
-3.0% appreciation · 3.0% rent growth · sell at horizon
- IRR
- -14.9%
- Equity multiple
- 0.47×
- Total profit
- $-20,879
- Equity at exit
- $20,874
- IRR
- -6.3%
- Equity multiple
- 0.60×
- Total profit
- $-15,815
- Equity at exit
- $12,105
Cash invested: $39,200 (down + closing). Projections, not guarantees.
Landlord ↔ Tenant lean methodology
- Overall (STATE)
- 83 Strongly Landlord-Friendly
- State Iowa
- 83 Strongly Landlord-Friendly · R+6
- County
- — inherits STATE
- City
- — inherits STATE
ZIP-level market 51601
- Home prices YoY
- -14.9%
- Active inventory
- 24
- Price-to-rent
- 9.3×
Monthly cashflow live
- Estimated rent
- $1,250 medium interval (Pro) →
- Mortgage (P&I)
- −$734
- Tax from tax record
- −$167 /mo · $2,002/yr
- Insurance
- −$58
- HOA
- −$0
- Vacancy / Maint / Mgmt
- −$262
- Net cashflow
- $28
Break-even live
Sensitivity live
| Price | -10% $107 | -5% $68 | +0% $28 | +5% $-11 | +10% $-51 |
|---|---|---|---|---|---|
| Rent | -10% $-71 | -5% $-21 | +0% $28 | +5% $78 | +10% $127 |
| Rate | -1.0pp $99 | -0.5pp $64 | base $28 | +0.5pp $-8 | +1.0pp $-45 |
UW: 25.0% down · 7.5% · 30yr · 1.5% tax · 5.0% vac · 8.0% maint · 8.0% mgmt
Financing live
Cash to close
- Down payment
- $35,000
- Closing costs
- $4,200
- Reserves months
- —
- Total cash needed
- —
Loan-product check · same deal, 3 products live
Conventional
25% down · 7.5% · 30yr
- Down + closing
- —
- Monthly P&I
- —
- Monthly cashflow
- —
- DSCR
- —
- Eligible?
- —
Personal DTI + credit; lowest rate.
DSCR
20% down · 8.5% · 30yr
- Down + closing
- —
- Monthly P&I
- —
- Monthly cashflow
- —
- DSCR
- —
- Eligible?
- —
No personal income docs; deal must DSCR.
Hard money
10% down · 12.0% · 12mo
- Down + closing
- —
- Monthly P&I
- —
- Monthly cashflow
- —
- DSCR
- —
- Eligible?
- —
Short-term bridge; refi at stabilization.
Rent comps 1 comps
| Address | Beds | Baths | Sqft | Rent | $/sqft | DOM | Units | Dist |
|---|---|---|---|---|---|---|---|---|
| 803 5th Ave Shenandoah, IA | 4.0 | 2.0 | 1721 | $1,250 | $0.73 | 16d | 1 | 0.62mi |
Listing history 22 events
-
2026-06-21days on market $140,000 Active 24 DOM
-
2026-06-21days on market $140,000 Active 23 DOM
-
2026-06-18days on market $140,000 Active 21 DOM
-
2026-06-17days on market $140,000 Active 20 DOM
-
2026-06-16days on market $140,000 Active 19 DOM
-
2026-06-15days on market $140,000 Active 18 DOM
-
2026-06-13days on market $140,000 Active 16 DOM
-
2026-06-12days on market $140,000 Active 15 DOM
-
2026-06-09days on market $140,000 Active 12 DOM
-
2026-06-08days on market $140,000 Active 11 DOM
-
2026-06-07days on market $140,000 Active 10 DOM
-
2026-06-07days on market $140,000 Active 9 DOM
-
2026-06-04days on market $140,000 Active 6 DOM
-
2026-06-02days on market $140,000 Active 5 DOM
-
2026-06-01days on market $140,000 Active 4 DOM
-
2026-05-31days on market $140,000 Active 3 DOM
-
2026-05-31days on market $140,000 Active 2 DOM
-
2026-05-28$140,000 Active
-
2023-06-13soldstatus $123,000
-
2016-12-09soldstatus $9,655 471-char remark
Show marketing remark (471 chars)
his house was built in 1890 and a lot of the hardwood floors are still in existence. Most of the woodwork is painted. It is as is condition. Nice large double car garage. 5 bedrooms with one bedroom on main floor. It would be real easy to turn this into a duplex. Investors are welcome to take a look at this property. We need someone to go in and do the things to bring this back to great house that it once was. this is now under Auction. (9/16/2016First American Asset
-
2016-06-17$19,900 471-char remark
Show marketing remark (471 chars)
his house was built in 1890 and a lot of the hardwood floors are still in existence. Most of the woodwork is painted. It is as is condition. Nice large double car garage. 5 bedrooms with one bedroom on main floor. It would be real easy to turn this into a duplex. Investors are welcome to take a look at this property. We need someone to go in and do the things to bring this back to great house that it once was. this is now under Auction. (9/16/2016First American Asset
-
2007-06-19soldstatus $61,750
ⓘ Source: listings_history table (triggers on properties + properties_extension) + one-shot
backfill from property_details.listing_events for pre-trigger history.
Tax reassessment forecast IA · Partial reset (capped growth)
- Current annual tax
- $2,002 · $167/mo
- Projected year-2 tax
- $2,100 · $175/mo
- Expected delta
- +$98/yr (+$8/mo · 4.9%)
ⓘ Screening estimate from a state-policy table — verify with the county assessor before closing.
Climate risk First Street
- Flood 1/10 Low FEMA zone X (unshaded) · 0% chance over 30 yrs
- Wildfire 1/10 Low
- Heat 3/10 Moderate 7 d/yr ≥106°F today · 15 d/yr by 30 yrs out
- Wind 2/10 Low
- Air quality 1/10 Low 0 unhealthy d/yr today · 0 by 30 yrs out
Nearby sold comps map
Loading sold comps map…
Walkable amenities ~0.75 mi
Loading nearby amenities…
Taxation est. · year 1
- Rental income
- $15,000
- − Mortgage interest
- −$7,842
- − Property taxes
- −$2,002
- − Insurance
- −$700
- − Repairs & maintenance
- −$1,200
- − Management
- −$1,200
- − Depreciation
- −$4,073
- Taxable loss
- −$2,017
- Est. tax savings @ 24.0%
- +$484
- After-tax cash flow
- $822/yr
For passive investors: Depreciation is non-cash, so a rental often shows a tax loss while cash-flowing — sheltering income. Rental losses are passive: they offset passive income freely, and up to $25,000/yr can offset ordinary (W-2) income if you actively participate and your MAGI is under $100k (phasing out to $0 by $150k); unused losses carry forward. On sale, claimed depreciation is recaptured at up to 25%, and gains may owe capital-gains tax (a 1031 exchange can defer both). Figures are a year-1 estimate at your 24.0% rate — not tax advice; consult a CPA.
Schools (NCES district)
- District
- Shenandoah Community School District
- NCES district ID
- 1926070
- Math proficiency
- 64% ▼ -10.00%
- Reading proficiency
- 69% ▼ -5.00%
- Median HH income
- $41,835
- Composite
- 55.67/100
- National rank
- #1225
- State rank
- #190 of 289 in IA
Livability — Shenandoah
- Score
- 76/100
- State rank
- #206
- US rank
- #3757
Category grades
Schools grade is shown separately in the Schools card above.
Census & demographics
- Census place
- Shenandoah, IA
- Population (ZIP)
- 5,562
Population outlook (Page County) Hauer SSP2
- Today (2025)
- 15,052 people
- By 2030
- 14,709 · -2.3%
- By 2040
- 13,981 · -7.1%
- By 2050
- 13,302 · -11.6%
- By 2075
- 11,678 · -22.4%
- By 2100
- 9,213 · -38.8%
Race, ethnicity, and origin ACS 2023
- Neighborhood character
- Predominantly White (94%)
- Race & ethnicity
- White 94% Hispanic / Latino 3% Two or more races 3%
- Common ancestry
- Greek 3% Lithuanian 2% Iranian 2%
- Foreign-born
- 1% · Canada
- Languages at home
- 97% English-only · Spanish 1%
Political lean MEDSL · Page
- 2024 margin
- Solid R (+42.4) · D 28.2% · R 70.6% · Other 1.1%
- 2008→2024 swing
- -22.7pp toward R · 2008: -19.7pp · 2024: -42.4pp
- All cycles
- 2024: R+42.4 2020: R+43.0 2016: R+44.1 2012: R+24.9 2008: R+19.7
Not yet ingested
- Civics
- —
Market trends
- HPI YoY
- ▼ -31.90%
- Current HPI
- 181.7259
- Rent YoY
- —
- Metro
- —
- State GDP YoY
- ▲ 2.48%
- F500 in state
- 4
Industry mix (Fortune 500 HQ in IA)
| Industry | F500 HQs | Revenue |
|---|---|---|
| Financial Services | 1 | $16B |
|
||
| Retail / Convenience | 1 | $15B |
|
||
Price history
+126.7% since first listed5 events — show timeline
- 2026-05-28 Listed $140,000 IAR
- 2023-06-13 Sold (Public Records) $123,000 Public Records
- 2016-12-09 Sold (MLS) $9,655 IAR
- 2016-06-17 Listed $19,900 IAR
- 2007-06-19 Sold (Public Records) $61,750 Public Records
Property tax history
+11.6%/yrLatest (2025): $2,002 · -1.4% YoY. Source: county tax records.
Cash-flow waterfall
monthlySold comps — $/sqft
last 12 mo · ≤1 miLoading sold comps…