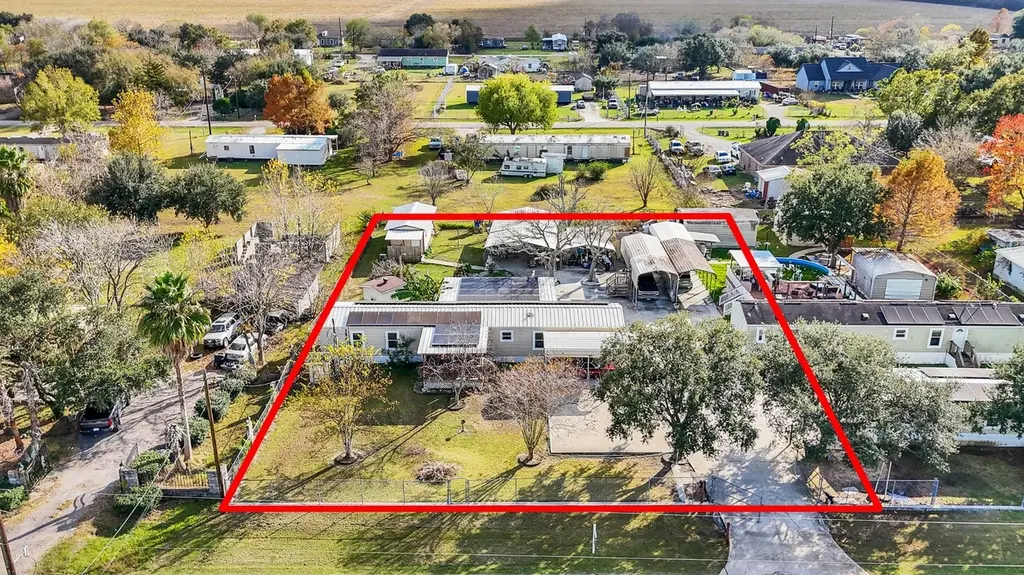
1010 Airline N · Rosharon, TX
Flood risk 6/10 · Moderate
- FEMA flood zone
- X (unshaded)
- Chance of flooding over 30 yrs
- 0.68%
- Est. flood insurance / yr
- $507 – $1,088
Fire risk 7/10 · Major
- Est. fire insurance / yr
- $1,222 – $2,270
Heat risk 9/10 · Severe
- Hot days now (above 109°F)
- 6 days/yr
- Hot days in 30 yrs
- 18 days/yr
Wind risk 9/10 · Severe
- Chance of severe wind over 30 yrs
- 99.0%
Air-quality risk 2/10 · Minimal
- Unhealthy air days now
- 1 days/yr
- Unhealthy air days in 30 yrs
- 1 days/yr
Risk factors via First Street. Map © Google.
Why this score? — see what drove the C- grade
The composite is a weighted blend of 9 inputs, each scored 0–100. Each bar is that input's sub-score; the figure is the points it added to the 100-point composite (weight × sub-score).
- Cash flow +22.4/30.0
- DSCR +7.2/10.0
- 1% rule +5.9/10.0
- Schools +3.5/10.0
- Livability +3.2/5.0
- ARV discount +3.0/15.0
- Rent growth +2.6/5.0
- Condition / age +2.2/5.0
- Appreciation +0.0/10.0
$219,900
🖨 Deal sheet (PDF) 📄 Offer letter ✓ Due diligence
Listing remarks
Unique multi-family opportunity just steps from the Grand Parkway expansion sits on . 65 Acre. This well-maintained property features a beautifully kept manufactured home with 4 bedrooms, 2baths, solar panels, generator, inviting outdoor spaces, a pond, multiple carports, RV storage, an extended concrete driveway, storage sheds, and front/rear decks. A detached, rent-producing ADU adds strong income and is currently leased at $1,217/month on a long-term lease. Schedule your showing today! All furnishings are negotiable . .. .. . * ADU only shown with accepted offer. Rentable RV Space w/ Hook-ups. + Space to add an additional Trailer with $1800 rent.
Key facts
- Pond
- Solar panels
- Multiple carports
Tags
Property features AI
Finance
- Financial info: Lease not considered
Exterior
- Parking: Additional parking; Driveway parking; Electric gate; RV access/parking; Boat parking
- Security: Electric gate
- Utilities: Public water and well; Public sewer
- Home design: Residential property; Pillar/post/pier foundation; Metal roof
- Construction: Built in 1994
- Exterior features: Deck; Patio; Porch; Fully fenced yard; Paved driveway; Storage; Shed(s); Garage apartment
Interior
- Kitchen: Dishwasher; Electric cooktop; Electric range; Microwave; Refrigerator
- Bedrooms: 4 total rooms (bedroom count not explicitly provided)
- Flooring: Laminate; Tile
- Bathrooms: 2 full bathrooms
- Heating & cooling: Central heating (Gas, Heat Pump); Central electric air conditioning
- Interior features: Double vanity; Jetted tub; Separate shower; Kitchen/family room combo; Ceiling fans
- Laundry & utility: Washer hookup; Gas dryer hookup
Neighborhood map
What this means for you Summary
Snapshot
- This is a 4-bed/2.0-bath single-family listed at $220k. Condition is rated fair.
Deal economics
- At list price, monthly cash flow is $366 ($4k/yr) — positive.
- The deal already cash-flows at list — no discount required.
- Meets the 1% rule at list price ($2k rent vs $220k).
- Recommended offer: $217k (1.5% below list) — sets the bar for market timing.
Location & tenants
- Location reads 65/100 on livability (#701 in TX) — a middle-class / working-renter tenant base. Strengths: crime A+, cost of living A+, housing A+; Watch: amenities F, commute F, health & safety F.
- Angleton ISD (suburban): math 36% / reading 44% proficiency, ranked #375 of 826 in TX (top 45%) — families likely to look elsewhere, expect single-tenant / working-renter base with shorter leases.
- Zoned schools: Frontier El (math 66% / reading 58%, grade B, #321 of 4,322 statewide, top 8%, 445 students, 53% FRL); Angleton J H School (math 26% / reading 41%, grade F, #911 of 1,662 statewide, top 56%, 1,561 students, 68% FRL); Angleton H S (math 22% / reading 45%, grade F, #1,011 of 1,632 statewide, top 63%, 2,066 students, 67% FRL).
- Market conditions: Rents flat; 1148 active listings in the ZIP; high-income renter base; 3,960 units permitted in Brazoria County in 2024 (593 in 5+ unit buildings).
Forward outlook
- Local home prices are declining (-3.0%/yr); year-one equity from $2k of loan paydown is wiped out by about $7k of value loss. Plan a longer hold.
- Brazoria County population projected at +44% by 2050 — long-run rental-demand tailwind backs the buy-and-hold thesis.
Negotiation context
- It's been on market 19 days — a 2% lower offer ($217k) is reasonable based on typical stale-listing flexibility.
- 3 sale attempts with the ask held roughly flat each time — persistent listings suggest the price (not the market) is what's stuck; bring a comps-based counter.
Risks & watch-outs
- Climate carrying-cost: major flood risk; severe wind risk, 99% chance of damaging wind over 30y; major wildfire risk; extreme-heat days projected 6→18/yr by 2055 (HVAC capex compounding) — expect insurance premiums to compound above CPI over the hold.
Questions for the listing agent
- Have any recent inspections been done? Can we get a copy of the seller's disclosures and any deferred-maintenance estimates?
- Is there a deadline driving the sale (1031 exchange, divorce, estate, relocation)? That informs how much negotiation room exists.
- Schools are F-rated, which usually means shorter tenancies and higher turnover. Who's the typical renter profile here, and what's been the actual vacancy rate?
- What's the average days-on-market for RENTAL listings here right now (not sales)? A rising rental-DOM trend means longer vacancies and softer asking-rent achievability than the comps imply.
- What's the recent tenant-quality profile in this submarket — average credit score on applications, eviction rate, late-payment / NSF rate, and stable-employment percentage? A property-management company in the area should have these aggregated.
- How much new for-sale + rental construction is in the pipeline within 1–3 miles? Heavy new supply typically softens prices + rents 12–24 months out; constrained supply supports both.
Investment metrics
- 1% rule
- 1.09% ✓
- Cap rate
- 8.29%
- Cash-on-cash
- 7.13%
- DSCR
- 1.32
- GRM
- 7.7
CMA / ARV
- ARV (median comp)
- $199,977
- List price
- $219,900
- Delta
- 9.51%
- Verdict
- FAIR
- Comps
- 4 within 1.0 mi
Projected returns pro-forma
-3.0% appreciation · 0.44% rent growth · sell at horizon
- IRR
- -8.3%
- Equity multiple
- 0.70×
- Total profit
- $-18,297
- Equity at exit
- $32,788
- IRR
- -2.5%
- Equity multiple
- 0.85×
- Total profit
- $-9,158
- Equity at exit
- $19,013
Cash invested: $61,572 (down + closing). Projections, not guarantees.
Landlord ↔ Tenant lean methodology
- Overall (STATE)
- 87 Strongly Landlord-Friendly
- State Texas
- 87 Strongly Landlord-Friendly · R+5
- County
- — inherits STATE
- City
- — inherits STATE
ZIP-level market 77583
- Rents YoY
- 0.4%
- Active inventory
- 1148
- Price-to-rent
- 7.7×
Monthly cashflow live
- Estimated rent
- $2,387 medium interval (Pro) →
- Mortgage (P&I)
- −$1,153
- Tax est. 1.5%
- −$275 /mo · $3,298/yr
- Insurance
- −$92
- HOA
- −$0
- Vacancy / Maint / Mgmt
- −$501
- Net cashflow
- $366
Break-even live
Sensitivity live
| Price | -10% $518 | -5% $442 | +0% $366 | +5% $290 | +10% $214 |
|---|---|---|---|---|---|
| Rent | -10% $177 | -5% $271 | +0% $366 | +5% $460 | +10% $554 |
| Rate | -1.0pp $476 | -0.5pp $422 | base $366 | +0.5pp $309 | +1.0pp $251 |
UW: 25.0% down · 7.5% · 30yr · 1.5% tax · 5.0% vac · 8.0% maint · 8.0% mgmt
Financing live
Cash to close
- Down payment
- $54,975
- Closing costs
- $6,597
- Reserves months
- —
- Total cash needed
- —
Loan-product check · same deal, 3 products live
Conventional
25% down · 7.5% · 30yr
- Down + closing
- —
- Monthly P&I
- —
- Monthly cashflow
- —
- DSCR
- —
- Eligible?
- —
Personal DTI + credit; lowest rate.
DSCR
20% down · 8.5% · 30yr
- Down + closing
- —
- Monthly P&I
- —
- Monthly cashflow
- —
- DSCR
- —
- Eligible?
- —
No personal income docs; deal must DSCR.
Hard money
10% down · 12.0% · 12mo
- Down + closing
- —
- Monthly P&I
- —
- Monthly cashflow
- —
- DSCR
- —
- Eligible?
- —
Short-term bridge; refi at stabilization.
Listing history 18 events
-
2026-06-21days on market $219,900 Active 19 DOM
-
2026-06-18days on market $219,900 Active 16 DOM
-
2026-06-17days on market $219,900 Active 15 DOM
-
2026-06-16days on market $219,900 Active 14 DOM
-
2026-06-15days on market $219,900 Active 13 DOM
-
2026-06-13days on market $219,900 Active 11 DOM
-
2026-06-09days on market $219,900 Active 7 DOM
-
2026-06-08days on market $219,900 Active 6 DOM
-
2026-06-07days on market $219,900 Active 5 DOM
-
2026-06-04days on market $219,900 Active 2 DOM
-
2026-06-03pricedays on market $219,900 Active 1 DOM
-
2026-06-01days on market $219,000 Active 43 DOM
-
2026-05-31days on market $219,000 Active 42 DOM
-
2026-04-21price $219,000 651-char remark
-
2026-04-19$210,000 Active 651-char remark
-
2026-04-19historical
-
2026-03-20price $269,990
-
2025-12-16$279,990 Active
ⓘ Source: listings_history table (triggers on properties + properties_extension) + one-shot
backfill from property_details.listing_events for pre-trigger history.
Climate risk First Street
- Flood 6/10 Major FEMA zone X (unshaded) · 68% chance over 30 yrs
- Wildfire 7/10 Severe
- Heat 9/10 Extreme 6 d/yr ≥109°F today · 18 d/yr by 30 yrs out
- Wind 9/10 Extreme 99% chance of damaging wind over 30 yrs
- Air quality 2/10 Low 1 unhealthy d/yr today · 1 by 30 yrs out
Nearby sold comps map
Loading sold comps map…
Walkable amenities ~0.75 mi
Loading nearby amenities…
Taxation est. · year 1
- Rental income
- $28,639
- − Mortgage interest
- −$12,318
- − Property taxes
- −$3,298
- − Insurance
- −$1,100
- − Repairs & maintenance
- −$2,291
- − Management
- −$2,291
- − Depreciation
- −$6,397
- Taxable income
- $944
- Est. tax owed @ 24.0%
- −$227
- After-tax cash flow
- $4,162/yr
For passive investors: Depreciation is non-cash, so a rental often shows a tax loss while cash-flowing — sheltering income. Rental losses are passive: they offset passive income freely, and up to $25,000/yr can offset ordinary (W-2) income if you actively participate and your MAGI is under $100k (phasing out to $0 by $150k); unused losses carry forward. On sale, claimed depreciation is recaptured at up to 25%, and gains may owe capital-gains tax (a 1031 exchange can defer both). Figures are a year-1 estimate at your 24.0% rate — not tax advice; consult a CPA.
Condition & rehab AI · 12 photos
This property requires moderate renovations to improve its condition and increase its value. Key areas for improvement include the roof, exterior siding, and interior walls.
Repairs flagged
- Major roof — visible wear
- Major exterior siding — aged appearance
- Minor kitchen cabinets — wooden, could be refinished
Value-add opportunities
- Both paint interior walls — enhances curb appeal and interior aesthetics
- Both repair and replace roof — critical for structural integrity and longevity
- Both repair and replace exterior siding — enhances curb appeal and structural integrity
Renovation cost estimate screening
| Repair item | Severity | Est. cost |
|---|---|---|
| roof · visible wear | Major | $15,000–50,000 |
| exterior siding · aged appearance | Major | $15,000–50,000 |
| kitchen cabinets · wooden, could be refinished | Minor | $500–3,000 |
| Total estimated repair cost · 3 items | $30,500–103,000 |
Value-add ROI direction
- Both paint interior walls — enhances curb appeal and interior aesthetics ↑
- Both repair and replace roof — critical for structural integrity and longevity ↑
- Both repair and replace exterior siding — enhances curb appeal and structural integrity ↑
ⓘ Cost ranges are severity-bucket heuristics (US national rule-of-thumb). Get contractor quotes + a written scope before underwriting a rehab budget.
Schools (NCES district)
- District
- Angleton ISD
- NCES district ID
- 4808310
- Math proficiency
- 36% ▼ -8.00%
- Reading proficiency
- 44% ▲ 1.00%
- Median HH income
- $55,670
- Composite
- 35.01/100
- National rank
- #5046
- State rank
- #375 of 826 in TX
Livability — Rosharon
- Score
- 65/100
- State rank
- #701
- US rank
- #13120
Category grades
Schools grade is shown separately in the Schools card above.
Census & demographics
- Census place
- Rosharon, TX
- County
- Brazoria County · 374,982 people
- Metro
- Houston-The Woodlands-Sugar Land, TX
- Population (ZIP)
- 52,747
- Household income
- $119,287
- Rent vs Own
- Severe rent burden
- 251.0
Population outlook (Brazoria County) Hauer SSP2
- Today (2025)
- 420,414 people
- By 2030
- 457,585 · +8.8%
- By 2040
- 532,232 · +26.6%
- By 2050
- 605,399 · +44.0%
- By 2075
- 779,358 · +85.4%
- By 2100
- 883,759 · +110.2%
Race, ethnicity, and origin ACS 2023
- Neighborhood character
- Highly diverse neighborhood (Simpson 0.70)
- Race & ethnicity
- Hispanic / Latino 38% Black 34% White 20% Two or more races 18% Asian 5%
- Hispanic origin (detail)
- Mexican 31% Puerto Rican 2%
- Common ancestry
- Lithuanian 1% Slovak 1% Romanian 1%
- Foreign-born
- 16% · Canada, Vietnam, China
- Languages at home
- 64% English-only · Spanish 28% Other Asian/Pacific 2% Vietnamese 1%
Political lean MEDSL · Brazoria
- 2024 margin
- R (+19.7) · D 39.5% · R 59.2% · Other 1.3%
- 2008→2024 swing
- +9.9pp toward D · 2008: -29.6pp · 2024: -19.7pp
- All cycles
- 2024: R+19.7 2020: R+18.2 2016: R+24.6 2012: R+34.2 2008: R+29.6
Not yet ingested
- Civics
- —
Market trends
- HPI YoY
- ▼ -120.19%
- Current HPI
- 198.6559
- Rent YoY
- ▲ 0.44%
- Metro
- Houston-The Woodlands-Sugar Land, TX
- State GDP YoY
- ▲ 3.95%
- F500 in state
- 110
Industry mix (Fortune 500 HQ in TX)
| Industry | F500 HQs | Revenue |
|---|---|---|
| Energy | 16 | $1,198B |
|
||
| Technology | 5 | $198B |
|
||
| Engineering / Construction | 4 | $72B |
|
||
| Energy Services | 3 | $60B |
|
||
| Utilities | 3 | $41B |
|
||
| Healthcare | 2 | $330B |
|
||
Price history
-21.5% since first listed7 events — show timeline
- 2026-06-03 Listed $219,900 HARMLS
- 2026-06-01 Listing Removed — HARMLS
- 2026-04-21 Price Changed $219,000 HARMLS
- 2026-04-19 Listing Removed — HARMLS
- 2026-04-19 Listed $210,000 HARMLS
- 2026-03-20 Price Changed $269,990 HARMLS
- 2025-12-16 Listed $279,990 HARMLS
Cash-flow waterfall
monthlySold comps — $/sqft
last 12 mo · ≤1 miLoading sold comps…